Downloaded 1,068 times
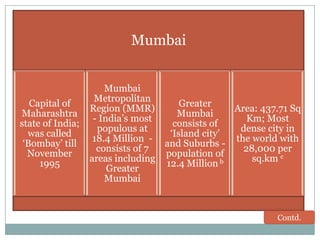
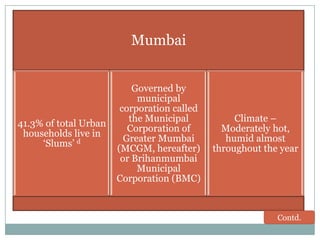
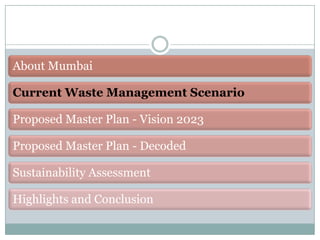
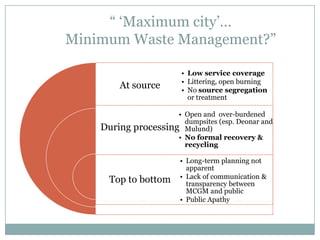
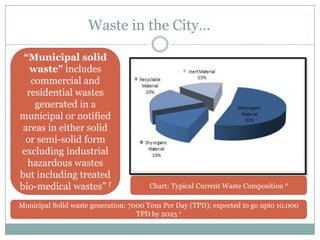
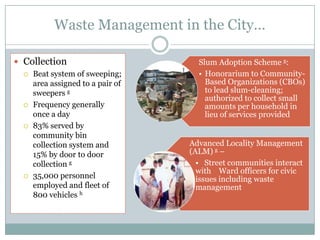
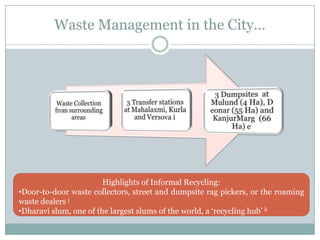
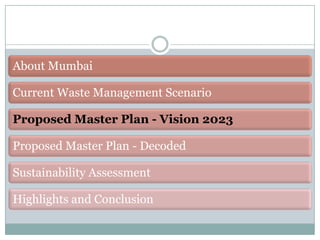
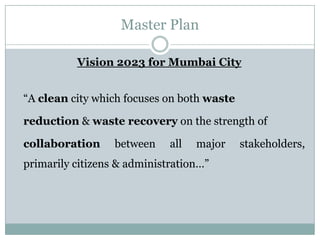
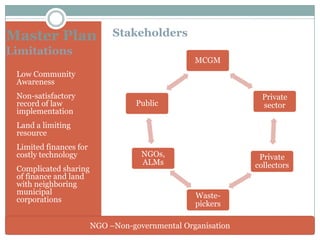
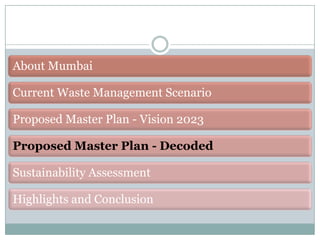
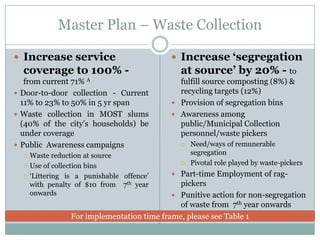

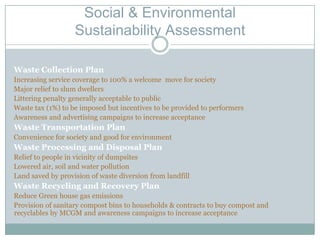
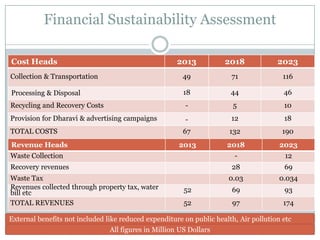
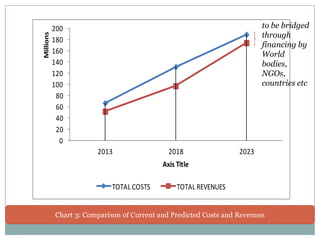
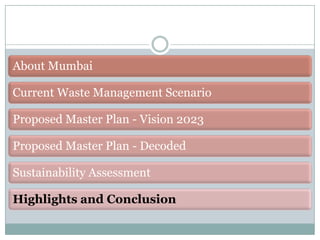


The document presents a Solid Waste Management Master Plan for Mumbai, India, aiming for a cleaner city by 2023 through increased waste reduction and recovery. It outlines the current waste management challenges, including low service coverage and informal recycling systems, and proposes strategies to enhance waste collection, processing, and public awareness. Key goals include achieving 100% service coverage, improving segregation at source, and incentivizing participation from citizens and stakeholders.


