Download to read offline

![Comparative Analysis Of Three Wind Turbines Of Varying Blade Sizes
DOI: 10.9790/1684-1304029496 www.iosrjournals.org 96 | Page
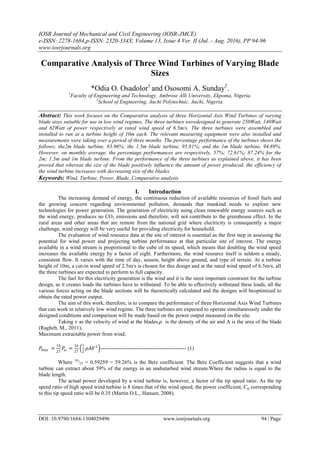
Fig.1. Average Power generated per Week in the month of November
Fig.2. Average Power generated per Week in the month of December
IV. Conclusion
The suitability of a wind turbine for low wind speed regime is its ability to extract power at that low
wind speed. From the performance of the three turbines as explained above, it has been proved thatwhereas the
size of the blade positively influence the amount of power produced, the efficiency of the wind turbine increases
with decreasing size of the blades. This evidently is as a result of reduction in aerodynamic loses associated with
reduced size of blades.
References
[1]. Calvert, N.G, 1979. “Windpower Principles: Their Application on the Small Scale”, Charles Griffin & Co. Ltd, London, England.
[2]. Dane Witt up, 2013. Wind Power for the World: The Rise of Modern Wind Energy.www.academia.edu/…/9814364932
[3]. De Vries, O. 1979. Fluid Dynamic Aspects of Wind Energy Conversion, Agardograaph.No.243, Advisory A rough Aeronautical
Research and Development. https://books.google.com.ng/books
[4]. Enrich Hau, 2006. Wind Turbines. Fundamentals, Technologies, Applications and Economics, Third, Translated Edition, Springer
Heidelberg, New York.
[5]. Martin O. L. Hansen, 2008. Aerodynamics of Wind Turbines, 2nd
Edition, Earth scan Publications, UK.
[6]. Mort horst, Paul Erik, 2002. A Green Certificatation Market for Developing Renewable Energy Technologies: Conference Article-
Annual Report. ENERBulletin,No25, P.41-47
[7]. Mort horst, P.E; 2003. Wind Power and the Conditions at a Liberalized Power Market. Journal Article- Annual Report, Vol.6,
P.297-308.
[8]. Prandtl, L. and Tietjens, O.G, 1957. Applied Hydro and Aerodynamics, Dover Publications, New York.
[9]. Ragheb, M, 2011. “Wind Power Systems. Harvesting the Wind” .http://netfiles.uiuc.edu/mragheb/www
[10]. Thomas Ackerman, Ed; 2005. “wind power in Power Systems”, John Wiley and Sons, Ltd.UK
[11]. Triton, D.J, 1988. Physical Fluid Dynamics, 2nd
Edition, Oxford University Press
220
200
180
160
140
120
100
80
60
40
20
1 2 3 4 5 Week
Av.Power
2.0m Blade Turbine
1.5m Blade Turbine
1.0m Blade Turbine
220
200
180
160
140
120
100
80
60
40
20
1 2 3 4 5 Week
Av.Power
2.0m Blade Turbine
1.5m Blade Turbine
1.0m Blade Turbine](https://image.slidesharecdn.com/n1304029496-160729084117/85/N1304029496-3-320.jpg)

This document compares the performance of three horizontal axis wind turbines with varying blade sizes (2m, 1.5m, and 1m) suitable for low wind regimes. Data was collected over three months on the power output of the three turbines. The results showed that while larger blades produced more power, the efficiency and percentage of rated power produced increased with decreasing blade size. Specifically, the 1m blade turbine performed at 94.89% of its rated capacity on average, compared to 95.81% for the 1.5m turbine and 83.96% for the 2m turbine. Thus, the smaller turbine was more effective at extracting power from the low wind speeds.


