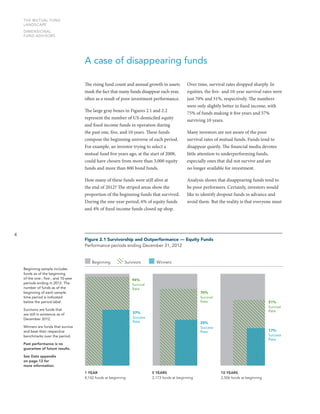
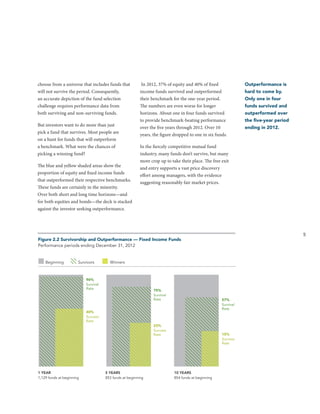
1) The mutual fund landscape comprises thousands of funds competing to identify mispriced securities, making it difficult for most funds to consistently outperform their benchmarks over time.
2) Few funds survive for long periods, with about half of equity funds disappearing within 10 years, largely due to poor performance. Similarly, only about one in six funds delivers benchmark-beating returns over 10 years.
3) Past outperformance is not predictive of future success, as most "winning" funds fail to continue outperforming in subsequent periods. High costs also predict future underperformance, with funds in the lowest cost quartiles more likely to outperform over 5 and 10 year periods.
Investors often endure poor timing and planning as
many chase past performance. They buy into funds
that are performing well and initiate a selling spree
following a decline.
The document provides an overview of the hedge fund industry globally and in China. It discusses the growth of the industry historically and key statistics in 2013. Hedge funds originated in the US but have expanded to other markets like China in recent years. While hedge funds have been recognized in China since 2012, the industry remains less developed there due to regulations and investor preferences. The document also examines the strategies, performance and fees of hedge funds based on various reports.
Active managers have generally not outperformed the market in either bull or bear markets. During the 2008 financial crisis, actively managed funds underperformed the S&P 500 index by an average of 1.67% on average. Studies from 2008-2012 also found that the majority of active managers failed to outperform their benchmarks across various market categories. While markets have historically delivered positive returns, it is typically a small group of top-performing stocks that drive those returns, making it difficult for managers to consistently pick winners. Diversification can help reduce risk and volatility compared to investing only in stocks, as seen during the 1973-1976 and 2007-2011 periods where a diversified portfolio lost less than a pure stock portfolio.
The document discusses value investing strategies in the U.S. and China stock markets. It analyzes data showing that allocating 15% of a portfolio to hedge funds can increase returns by 0.3-0.5% while reducing risk. However, the wide variation in hedge fund performance shows the importance of manager selection. Seasonal patterns are identified, with better performance periods in the U.S. from June-April and in China from September-March. The document recommends a long/short strategy taking long positions in the outperforming market and short positions in the other to reduce correlation and obtain profits.
Lebanon Opportunities - May 2016 - BLC Income Fund IMazen Nasser
A number of domestic and international mutual funds are discussed. Domestically, BOB LBP Growth Fund Class A achieved the highest return in 2015 at 8.61%. Internationally, FFA International Growth Equity Fund achieved the highest 2015 return of 2.34%. Over the lifetime of the funds, FFA International Bond Fund achieved the highest average annual return of 7.38% internationally, while BLC Bank Income Fund I achieved the highest domestic lifetime average return of 5.36%. The article provides details on the investment strategies and performance of these and other mutual funds.
How Wealthy People Use Professional Money Managementfreddysaamy
http://ekinsurance.com/financial/money-management/
Just as surgeons don't operate on themselves, wealthy people usually do not invest their own money. They have investment professionals manage their money for them.
Many aspects of investing are unpredictable and therefore uncontrollable. When and how much markets rise and fall are factors completely out of the hands of investors. However,
investors have the ability to control many aspects of investing which can lead to a better investment experience. The following questions and answers use data and reasoning to shed light on some key principles that may help improve your odds of
investment success in the long run.
This article highlights 15 top-performing mutual funds over the past 5 years. It begins by discussing the difficult market environment for funds since 2005, with the average annual return just 2% compared to inflation. However, some funds delivered much better returns. The top-performing fund highlighted is the Yacktman fund, which returned 40% over 5 years compared to just 4,000% for a market index fund. The article then examines the BlackRock Global Allocation fund in more detail as the top global fund. It achieved an average annual return of 7.7% over 15 years by taking advantage of market downturns to buy stocks and bonds at lower prices. The fund aims to limit risk by diversifying across
This document discusses strategies for asset allocation to meet spending needs given lower expected future returns. It notes that while simpler allocations could previously meet return targets, portfolios have become more complex with the addition of illiquid strategies. Target asset allocations have also changed, with foundations often targeting 7-8% expected returns to meet 5% distribution rates. The document examines strategies like adding alternative investments and taking more active approaches to asset allocation and manager selection to boost returns above what can be achieved through passive exposures.
Saving With Negative Real Interest RatesInvestingTips
As historically low interest rates persist and inflation accelerates, saving with negative real interest rates becomes increasingly futile.
https://youtu.be/d9qhofw8ZVc
Income Matching Using Bonds NorCal 2011Brent Burns
This document presents an alternative investment strategy called income matching using individual bonds. It describes how this strategy can provide predictable income streams through building portfolios of individual bonds that match a client's future cash flow needs. This strategy aims to immunize clients against interest rate risk by constructing bond portfolios with specific durations tailored to the timing of a client's expected expenses. It argues that individual bonds are better suited than bond funds or annuities for delivering reliable income due to risks such as fluctuating dividends, counterparty risk, and losses during periods of rising interest rates.
1) Interest rates around the world are at historic lows and central banks have taken extraordinary measures to stimulate economies and hold down rates since the 2008 financial crisis.
2) Many investors are concerned about what will happen to bond portfolios as central banks eventually raise rates to more normal levels, but it is difficult to predict interest rate movements and bonds can still provide diversification benefits in a portfolio.
3) Studies of past periods of rising interest rates found that in some cases, longer-term bonds actually outperformed shorter-term bonds, and bonds generally had positive returns, contradicting the view that they always lose money when rates rise.
Gaurav Aggarwal is the co-founder and co-portfolio manager of Metis Opportunity Fund (MOF). He has over 15 years of experience in portfolio management and equity analysis. The document provides details on Gaurav's background, experience, and role at MOF. It also includes a brief profile of MOF, including its strategy, performance track record, and portfolio characteristics.
A Study on Factors Influencing Investment Decision Regarding Various Financia...ijtsrd
In the current era of financial inclusion, digitalization and economy driving towards a faster pace, the investors are very much concerned about their savings which can be transferred into investments. The main purpose of investment is to maximize the returns out of it with minimum expenses and risk. There are various factors which affect the investment decision like demographic factors and behavioural biases which decides the type, tenure, amount of the investment. This paper explores that return, advice, tax benefit, liquidity risk appetite of the investors altogether plays a significant part in influencing the investors. Is there any impact of demographic factors like age, gender and income on factors influencing investment decision tried to find out. The results show that factors influencing the investment decision are influenced by income level not by age and gender. Dr. Ankit Jain | Mr Raj Tandel "A Study on Factors Influencing Investment Decision Regarding Various Financial Products" Published in International Journal of Trend in Scientific Research and Development (ijtsrd), ISSN: 2456-6470, Volume-4 | Issue-6 , October 2020, URL: https://www.ijtsrd.com/papers/ijtsrd33678.pdf Paper Url: https://www.ijtsrd.com/management/accounting-and-finance/33678/a-study-on-factors-influencing-investment-decision-regarding-various-financial-products/dr-ankit-jain
The document discusses several key issues in evaluating active manager skill:
1) It is difficult to determine what is due to luck versus skill when evaluating manager performance.
2) Both large and small managers may have advantages, and simple metrics like Sharpe ratio are insufficient.
3) Manager evaluations should consider future performance over long time horizons, as well as inherent incentive structures, rather than just short-term past returns. Aligning investor and manager goals and definitions of risk is important for successful long-term partnerships.
Netwealth portfolio construction series: Investment Moneyball - Taking advant...netwealthInvest
Discover how you can apply the Moneyball theory to potentially discover good investment opportunities at good prices by finding market anomalies to take advantage of. Paul Moore, founder and Chief Investment Officer of PM Capital, discusses.
This document presents the findings of a study on the investment behavior of youth. It analyzes data collected through questionnaires from 50 young investors regarding their preferences, awareness, and decisions around various investment instruments like savings accounts, mutual funds, insurance, real estate etc. The study finds that saving accounts are the most preferred investment followed by mutual funds. It also finds that there is a general lack of knowledge about mutual funds among youth investors. The document makes recommendations to improve transparency and simplify procedures related to mutual fund investments.
Netwealth portfolio construction series - Building investment portfolios for ...netwealthInvest
Discover what markets could look like in the future and some of the strategies investors use in order to continue meeting their retirement goals with Josh Hall from Aberdeen Asset Management.
Asia-Pacific institutional investors are struggling to balance long-term liabilities with the need to secure yield in a world where it is increasingly scarce. They are also in the world’s fastest-growing region that has no shortage of volatility. How are they achieving returns while managing risks?
Compared to equities, bonds at first glance can appear like a throwback to your grandparent's days, but this month we take a look at how bonds may help mitigate risk, and the role they play in a well-diversified portfolio.
Commodities managers may in fact benefit from a distinct advantage over their equity and fixed income peers – that is they seem to have a credible information advantage.
Portico Advisers: Is Emerging Markets Private Equity Dying?PorticoAdvisers
Portico’s first research piece explores several existential challenges besetting the industry, and presents a humble call to action to shore up support for the industry.
The document discusses investment and the factors that affect investment decisions. It defines investment as committing capital to generate returns over time through interest, income, or asset appreciation. Key factors influencing investment choices include risk tolerance, return needs, investment horizon, tax exposure, market trends, investment needs, and dependents. The author conducted a study analyzing these factors and their impact on preferences for different investment avenues like shares, insurance, mutual funds, and more. Graphical analyses showed that returns were the main factor affecting decisions, disproving the hypothesis that market fluctuations were the primary deterrent, while risk tolerance was also important.
This document analyzes balanced mutual funds in India that invest in both equities and debt instruments. It aims to determine if there is a relationship between assets under management (AUM) and returns for selected balanced funds, and if returns differ significantly among the funds. The analysis focuses on HDFC, ICICI, UTI, and DSP balanced funds. It is hypothesized that either a relationship exists between AUM and returns for at least one fund, or returns significantly differ between funds. Secondary data will be used to conduct descriptive and causal analyses to test the hypotheses.
- The document provides an investment outlook and commentary for the 1st quarter of 2010. It discusses various factors impacting the capital markets, including the state of the economy, the equity and bond markets, and risks related to the US dollar and developing economies.
- The author recommends being underweight in equity-like investments, overweight in non-equity correlated investments, underweight real assets favoring deflation, and overweight safety, liquidity, and income assets. Key risks discussed include high government debt levels, potential issues in developing economies, and uncertainty around the US dollar.
The document discusses the benefits of including managed futures/commodities trading advisors (CTAs) in investment portfolios. It notes that CTAs may have an information advantage over equity and fixed income managers in interpreting commodities markets. CTAs also tend to have low or negative correlation with traditional stock and bond holdings, helping to improve risk-adjusted returns and reduce volatility for portfolios. Back-testing shows that including a 10% allocation to CTAs led to increased returns, lower volatility, and a sharper ratio for portfolios over the past 10 years compared to holdings without CTAs.
The last decade has been a challenge for many investors, especially those investing for the long term and retirement. Given declines in global stock markets, many investors have seen little to no real growth in their portfolios over this period. This Wealth Guide explains why investors’ portfolios may underperform in both bear and bull markets and incur substantial costs in the process. It also details the impact this chronic underperformance can have on achieving long-term financial goals.
For more free wealth management guides on portfolio performance and for expert consultation, visit SolidRockWealth.com.
This document identifies 10 trends shaping the investment management industry in a world of low interest rates, high volatility, and high correlations between asset classes. The key trends are the search for yield driving demand for credit and dividend-paying stocks; the debate around whether equities can still outperform with their high volatility; the growth of risk-minimizing multi-asset strategies; the shift to passive index funds and ETFs; and declining performance of hedge funds. Understanding how investor behavior is changing in response to these trends will be important for investment managers and can provide insights into future asset prices.
The document provides 5 investing principles based on a presentation about lessons learned. Principle 1 discusses that every investment has risks, even cash, as investors flocked to cash during volatile periods but it provided little return over the long run after accounting for inflation. Principle 2 notes that while most asset classes declined in 2008, a diversified portfolio still worked over the full market cycle from 2000-2009. Principle 3 explains that not all bonds or bond funds perform the same way. Principle 4 asserts that stocks have generally outperformed over the long run. Principle 5 advocates for including international stocks rather than avoiding foreign markets.
Hilltop decorrelated fund september 2013 factsheetJohn Robertson
The Hilltop Decorrelated Fund enjoyed strong returns in September of 1.3%. Fifteen of the underlying managers were positive and three were negative. Two new strategies were added that demonstrate compelling opportunities and ability to deliver non-correlated returns. The portfolio review is nearly complete and may lead to two or three further changes. The fund targets consistent, low volatility returns with limited drawdowns through a multi-manager approach investing in strategies across global markets.
The document discusses key considerations for long-term investing, focusing on longevity and the importance of making investment decisions that will allow one's money to last a lifetime. It outlines two main investment decisions - whether to take an active or passive approach, and if passive, whether to implement an indexing or asset class strategy. For the first decision, it notes that most active managers underperform the market, while passive investing aims to capture market returns at low cost. For the second decision, it explains that asset class investing seeks to maintain consistent risk exposures and has more flexibility, while indexing aims to replicate market segments.
Pursuing a Better Investment Experience with Capital AssociatesRobUgiansky
This document outlines 10 key principles for improving the odds of investment success:
1) Embrace market pricing and the information incorporated into prices.
2) Don't try to outguess the market through stock picking or market timing as most funds do not outperform their benchmarks.
3) Resist chasing past performance as it does not predict future returns.
4) Let markets work for you through long-term investing as this has rewarded investors over time.
The document provides an overview of various investment avenues available in the current financial year. It discusses key concepts like inflation, risk profiling of investors, and strategies for robust investment and financial planning. The objectives are to understand different asset classes and products, and elicit an in-depth coverage of major investment avenues and their performance over the past couple of years to arrive at an optimal asset allocation keeping in mind risk appetite and investment goals. Key investment avenues discussed include equity, debt, mutual funds, real estate, commodities, and more.
This document provides an analysis of various balanced and liquid funds. It begins with an introduction to mutual funds and their structure. It then discusses company profiles, types of balanced and liquid funds, and analytical tools used to compare fund performance such as Sharp ratio, Treynor ratio, and standard deviation. Several chapters analyze specific mutual funds and present the results of a survey on the industry. The conclusion suggests that balanced and liquid funds are growing in popularity and performance is improving. The mutual fund industry is expanding rapidly in India.
A project report on different schemes of mutual funds and their comparative ...Babasab Patil
The document analyzes the 15-year track records of three mutual fund schemes - Franklin Blue Chip Fund, ICICI Prudential Power Fund, and HDFC Capital Builder Fund - compared to their respective benchmarks. It finds that the HDFC fund had the highest average returns at 3.04% and was the most stable. The Franklin fund had higher risk but potential for higher returns over 4+ years. The ICICI fund also performed well with stable returns of around 2.86%. The document recommends mutual funds for their benefits over bank deposits and direct stock investing.
David Rubenstein posed 10 key questions facing the private equity world. These questions addressed issues like whether leverage for buyouts would return, the potential for major defaults of deals completed during the "golden age" of private equity, what areas private equity firms would pursue to achieve targeted returns, and whether now is the right time for investors to pursue private equity investments. The document also discussed sovereign wealth funds and their potential impact on private equity, as well as ways the industry could work to improve its public image.
Hilltop decorrelated fund october 2013 factsheetJohn Robertson
The Hilltop Decorrelated Fund gained 1.2% in October. After months of offsetting winning and losing positions cancelling each other out in the first half of the year, the fund has seen a return to normality over the past 4 months with more winning than losing positions. The fund employs a multi-manager strategy investing in 12-20 underlying hedge funds pursuing decorrelated returns across asset classes like equities, fixed income, currencies and commodities. The target is an average annual return of 10-12% with low volatility and correlation to markets.
The document discusses strategies for creating an investment portfolio based on Nobel Prize-winning academic research. It recommends structuring portfolios to take advantage of factors like company size, relative price, and profitability that have been shown to increase returns. Specifically, it suggests investing more in small and value stocks, as both have higher returns than large or growth stocks over the long run. The document also provides examples of model portfolios that diversify across global stock and bond index funds targeting these factors.
Wealth advisors LLC pursues a better investment experience for its clients by embracing principles of prudent diversification and avoiding behaviors that often undermine returns, such as market timing, chasing past performance, and overreacting to short-term market movements. The firm recommends low-cost, globally diversified portfolios and advises clients to focus on what they can control - their investment plan, taxes, and expenses - rather than trying to outguess unpredictable markets. By following these disciplined strategies, the firm aims to help clients achieve superior long-term returns.
- The document is an Invesco client guide that provides information about mutual funds and investing.
- It discusses what mutual funds are, the benefits they provide, and the different types including money market, stock, bond, and balanced funds.
- It also outlines strategies for building wealth through dollar-cost averaging and provides an investment profile questionnaire to help clients determine their risk tolerance and preferred investment style.
The document discusses various types of financial instruments and markets. It begins by explaining how companies raise money through financial markets and the packaging of future cash flows. It then defines different financial markets and instruments such as money markets, capital markets, bonds, stocks, and preferred shares. It also discusses how private companies obtain financing and the process for companies going public.
Global funds are Indian mutual funds that invest mainly in global equities. Some schemes invest directly in international markets while others invest in international mutual funds. Global funds provide geographical diversification and access to global companies. However, they also have higher expenses than domestic funds. Global funds are suitable for investors with a minimum 3-year investment horizon who are willing to take on higher risk for diversification. The document then analyzes different subcategories of global funds focusing on their strengths, weaknesses, opportunities and threats. It also provides performance comparisons of global fund categories versus domestic equity benchmarks and indexes.
The Mutual Fund Concept1. LG 12. LG 2Questions of which stoc.docxdennisa15
The Mutual Fund Concept
1. LG 1
2. LG 2
Questions of which stock or bond to select, how best to build a diversified portfolio, and how to manage the costs of building a portfolio have challenged investors for as long as there have been organized securities markets. These concerns lie at the very heart of the mutual fund concept and in large part explain the growth that mutual funds have experienced. Many investors lack the know-how, time, or commitment to manage their own portfolios. Furthermore, many investors do not have sufficient funds to create a well-diversified portfolio, so instead they turn to professional money managers and allow them to decide which securities to buy and sell. More often than not, when investors look for professional help, they look to mutual funds.
Basically, a mutual fund (also called an investment company) is a type of financial services organization that receives money from a group of investors and then uses those funds to purchase a portfolio of securities. When investors send money to a mutual fund, they receive shares in the fund and become part owners of a portfolio of securities. That is, the investment company builds and manages a portfolio of securities and sells ownership interests—shares—in that portfolio through a vehicle known as a mutual fund.
An Advisor’s Perspective
Catherine Censullo Founder, CMC Wealth Management
“Mutual funds are pools of assets.”
MyFinanceLab
Portfolio management deals with both asset allocation and security selection decisions. By investing in mutual funds, investors delegate some, if not all, of the security selection decisions to professional money managers. As a result, investors can concentrate on key asset allocation decisions—which, of course, play a vital role in determining long-term portfolio returns. Indeed, it’s for this reason that many investors consider mutual funds the ultimate asset allocation vehicle. All that investors have to do is decide in which fund they want to invest—and then let the professional money managers at the mutual funds do the rest.
An Overview of Mutual Funds
Mutual funds have been a part of the investment landscape in the United States for 91 years. The first one started in Boston in 1924 and is still in business. By 1940 the number of mutual funds had grown to 68, and by 2015 there were more than 9,300 of them. To put that number in perspective, there are more mutual funds in existence today than there are stocks listed on all the major U.S. stock exchanges combined. As the number of fund offerings has increased, so have the assets managed by these funds, rising from about $135 billion in 1980 to $15.8 trillion by the end of 2014. Compared to less than 6% in 1980, 43% of U.S. households (90 million people) owned mutual funds in 2014. The mutual fund industry has grown so much, in fact, that it is now the largest financial intermediary in this country—even ahead of banks.
Mutual funds are big business in the United States and, indeed, all.
The article discusses an alternative approach to experiencing the costs of index reconstitution, called “Asset Classes,” which allow the fund manager broader leeway as to when to buy or sell, along with a broader range of holdings. This discussion begins in the section called “Decision Two: Indexing or Asset Class Investing?”
The Asset Class approach, also referred to by others as "Factor Investing," is based on what has become to be called “Evidence Based Investing” due to roots discussed in the linked "Factor Investing" article, that come from academic (peer reviewed and repeatable results) foundation that continues to this day.
My blog post discussing this article is scheduled to post 8 Feb 2017 http://wp.me/p2Oizj-Hh
The document discusses three dimensions of expected stock returns:
1) Company size - Small company stocks tend to have higher expected returns than large company stocks over time.
2) Company price - Lower-priced "value" stocks tend to have higher expected returns than higher-priced "growth" stocks over time.
3) Equity market - Stocks tend to have higher expected returns than fixed income investments like bonds over time.
The document discusses diversification across different asset classes and geographic regions. It presents 5 model portfolios with varying allocations to US and international stocks and bonds. The most diversified portfolio (Portfolio 5) allocates 30% to international stocks, 7.5% to several US stock size and style factors, and 40% to bonds. Tables show the annual returns and volatility of returns for each model portfolio from 1998-2012. The most diversified portfolio had the highest annualized return of 7.02% and second highest standard deviation of returns of 13.68%.
This document discusses the concept of error terms in investment returns and strategies. It makes three key points:
1) Even portfolios with identical exposures to risk factors like market, size, and value will experience random variation in returns over time due to residual error from differences in underlying security holdings. This error averages to zero over the long run.
2) Tax-managed investment strategies will differ in returns from benchmarks, but offer higher after-tax returns justifying the tracking error. Maximum annual deviations were 2.3% overperformance and 1.3% underperformance.
3) The Fama-French multifactor model helps investors manage systematic risk factors rather than focus on arbitrary benchmarks or short-term noise in
The document summarizes a five-factor asset pricing model that augments the Fama-French three-factor model by adding profitability and investment factors.
The five-factor model is tested using portfolios sorted on size, book-to-market equity ratio, profitability, and investment to produce spreads in average returns. The results show patterns in average returns related to size, value, profitability, and investment that the five-factor model seeks to capture. Specifically, small stocks and stocks with high book-to-market ratios, profitability, or low investment tend to have higher average returns. However, the model has difficulties explaining the low returns of some small, low-profitability stocks that invest heavily.
The document summarizes factor investing using Norway's sovereign wealth fund as a case study. It finds that 99% of the variation in the fund's returns can be explained by its strategic asset allocation decisions between equities and bonds. This supports the finding that the most important investment decision is the top-down choice of asset allocation. The document also defines factors as classes of securities that have higher long-term returns than the broad market, such as value stocks, momentum stocks, illiquid securities, risky bonds, and options strategies. Adopting a factor investing approach allows investors to access these premiums in a cost-effective manner.
We are all prone to cognitive biases that make it easy to fool ourselves, even more so than others. Confirmation bias and motivated reasoning cause us to only see evidence that supports our existing beliefs and interpretations. The bias blind spot further prevents us from recognizing our own cognitive biases. While the scientific method aims to reduce bias through rigorous testing of hypotheses, even scientists fall prey to these biases and often fail to replicate their own seminal studies. Overcoming cognitive biases requires acknowledging their existence and establishing processes like "adversarial collaboration" that encourage challenging existing ideas without fear of reprisal.
The three-factor model developed by Fama and French provides a framework for investment strategies that identifies sources of risk that compensate investors. It explains stock returns better than the single-factor CAPM model by including factors for firm size and book-to-market ratio in addition to market beta. While book-to-market ratio may not seem to directly describe risk, it serves as a proxy for a company's financial distress - high book-to-market stocks tend to be more risky with higher expected returns. The three-factor model allows advisors to construct portfolios targeting different risk exposures from size and value factors to outperform the market over the long run.
This document provides historical return data for various investment indexes from 1926 to 2012. It discusses Dimensional Fund Advisors' evolution in response to advances in financial research. Key points include:
- Dimensional structures portfolios around dimensions of expected returns identified by research, such as market, size, value, and profitability factors.
- Recent research identified profitability as a new dimension with high profitability firms having higher average returns.
- Dimensional incorporates new research findings by evolving existing strategies and developing new ones.
- Dimensional's approach focuses on expected returns rather than attempting to time markets or capture short-term anomalies.
- Historical return data is provided for indexes spanning US and international equities
Dimensional investors are able to capture the value premium where others fail through an integrated investment process. Their process begins with clear investment principles of efficient markets and targeting dimensions of expected return like value and size. They design strategies for continuous exposure to these premium-generating factors. Their portfolio engineering, management, and trading are dynamically integrated to minimize costs from factors like momentum and provide liquidity. This allows Dimensional to reliably deliver excess returns to investors from targeting premiums.
This research paper discusses enhancing value investment strategies by incorporating expected profitability.
For small cap value strategies, the paper proposes excluding stocks in each country with the lowest direct profitability, with the percentage excluded depending on the stock's price-to-book ratio.
For large cap value strategies, the paper suggests selecting stocks based on both low price-to-book ratios and high direct profitability. It also proposes overweighting stocks that have higher profitability, lower market capitalization, and lower relative price.
The goal is to structure portfolios to better capture the dimensions of expected returns related to company size, relative price, and expected profitability, while maintaining appropriate diversification and managing costs.
This document discusses innovations in finance from the 1950s to today. It begins by outlining conventional wisdom from the 1930s that focused on picking individual winners and holding concentrated portfolios. It then summarizes several seminal works and developments that helped shift the field: James Tobin's separation theorem emphasized diversification; William Sharpe developed the single-factor capital asset pricing model relating risk and return; Eugene Fama developed the efficient market hypothesis asserting that markets accurately reflect information. This led to the development of index funds by John Bogle, providing low-cost, passive investment options. Overall, the document outlines major theoretical and practical innovations that professionalized the field of finance and emphasized diversification, risk-adjusted returns, and passive investing.
This document describes the services of a part-time CFO service for small businesses. They help business owners understand their financial metrics through analysis of profitability, cash flow, ratios, and forecasting. They analyze key metrics, identify trends, and grade performance in areas like capital structure and profitability. They also help solve strategic problems by determining how to reach goals through actions like increasing prices or reducing expenses. The service aims to provide actionable financial insights and advice to small businesses without needing a full-time CFO.
4 active vs passive advisor insert funds flows dfa (advisor present) p. 1-3, ...Weydert Wealth Management
This excellent article contains three key graphics illustrating how average investors flow into and out of investments at the wrong times and contrasts this with the average DFA investor who remains much more consistent and disciplined.
This document provides a summary of Dimensional Fund Advisors' 30 year history from 1981 to 2010. It discusses how Dimensional was founded on empirical financial research and introduced novel investment strategies like microcap investing. Over the decades, Dimensional expanded its offerings globally while maintaining its focus on translating academic theories into practical investment solutions. Key events include expanding client base, growing assets under management, moving headquarters, and continuing to work closely with leading financial academics.
The document discusses the performance of various model investment portfolios from 1973-2010. It provides the annualized compound returns and annualized standard deviations for 5 model portfolios over this period. The model portfolios had varying allocations to US and international stocks, bonds, and emerging markets. Model portfolio 5, which had the most diversified allocation, achieved the highest annualized return of 11.65% and relatively low standard deviation of 11.26% compared to the other portfolios.
Dimensional Fund Advisors' powerful slides on the small cap and value effect detail how small stocks and value stocks enhance portfolio returns and explain portfolio performance.
"Does Foreign Direct Investment Negatively Affect Preservation of Culture in the Global South? Case Studies in Thailand and Cambodia."
Do elements of globalization, such as Foreign Direct Investment (FDI), negatively affect the ability of countries in the Global South to preserve their culture? This research aims to answer this question by employing a cross-sectional comparative case study analysis utilizing methods of difference. Thailand and Cambodia are compared as they are in the same region and have a similar culture. The metric of difference between Thailand and Cambodia is their ability to preserve their culture. This ability is operationalized by their respective attitudes towards FDI; Thailand imposes stringent regulations and limitations on FDI while Cambodia does not hesitate to accept most FDI and imposes fewer limitations. The evidence from this study suggests that FDI from globally influential countries with high gross domestic products (GDPs) (e.g. China, U.S.) challenges the ability of countries with lower GDPs (e.g. Cambodia) to protect their culture. Furthermore, the ability, or lack thereof, of the receiving countries to protect their culture is amplified by the existence and implementation of restrictive FDI policies imposed by their governments.
My study abroad in Bali, Indonesia, inspired this research topic as I noticed how globalization is changing the culture of its people. I learned their language and way of life which helped me understand the beauty and importance of cultural preservation. I believe we could all benefit from learning new perspectives as they could help us ideate solutions to contemporary issues and empathize with others.
Vicinity Jobs’ data includes more than three million 2023 OJPs and thousands of skills. Most skills appear in less than 0.02% of job postings, so most postings rely on a small subset of commonly used terms, like teamwork.
Laura Adkins-Hackett, Economist, LMIC, and Sukriti Trehan, Data Scientist, LMIC, presented their research exploring trends in the skills listed in OJPs to develop a deeper understanding of in-demand skills. This research project uses pointwise mutual information and other methods to extract more information about common skills from the relationships between skills, occupations and regions.
Falcon stands out as a top-tier P2P Invoice Discounting platform in India, bridging esteemed blue-chip companies and eager investors. Our goal is to transform the investment landscape in India by establishing a comprehensive destination for borrowers and investors with diverse profiles and needs, all while minimizing risk. What sets Falcon apart is the elimination of intermediaries such as commercial banks and depository institutions, allowing investors to enjoy higher yields.
BONKMILLON Unleashes Its Bonkers Potential on Solana.pdfcoingabbar
Introducing BONKMILLON - The Most Bonkers Meme Coin Yet
Let's be real for a second – the world of meme coins can feel like a bit of a circus at times. Every other day, there's a new token promising to take you "to the moon" or offering some groundbreaking utility that'll change the game forever. But how many of them actually deliver on that hype?
2. Elemental Economics - Mineral demand.pdfNeal Brewster
After this second you should be able to: Explain the main determinants of demand for any mineral product, and their relative importance; recognise and explain how demand for any product is likely to change with economic activity; recognise and explain the roles of technology and relative prices in influencing demand; be able to explain the differences between the rates of growth of demand for different products.
Abhay Bhutada, the Managing Director of Poonawalla Fincorp Limited, is an accomplished leader with over 15 years of experience in commercial and retail lending. A Qualified Chartered Accountant, he has been pivotal in leveraging technology to enhance financial services. Starting his career at Bank of India, he later founded TAB Capital Limited and co-founded Poonawalla Finance Private Limited, emphasizing digital lending. Under his leadership, Poonawalla Fincorp achieved a 'AAA' credit rating, integrating acquisitions and emphasizing corporate governance. Actively involved in industry forums and CSR initiatives, Abhay has been recognized with awards like "Young Entrepreneur of India 2017" and "40 under 40 Most Influential Leader for 2020-21." Personally, he values mindfulness, enjoys gardening, yoga, and sees every day as an opportunity for growth and improvement.
Independent Study - College of Wooster Research (2023-2024) FDI, Culture, Glo...AntoniaOwensDetwiler
"Does Foreign Direct Investment Negatively Affect Preservation of Culture in the Global South? Case Studies in Thailand and Cambodia."
Do elements of globalization, such as Foreign Direct Investment (FDI), negatively affect the ability of countries in the Global South to preserve their culture? This research aims to answer this question by employing a cross-sectional comparative case study analysis utilizing methods of difference. Thailand and Cambodia are compared as they are in the same region and have a similar culture. The metric of difference between Thailand and Cambodia is their ability to preserve their culture. This ability is operationalized by their respective attitudes towards FDI; Thailand imposes stringent regulations and limitations on FDI while Cambodia does not hesitate to accept most FDI and imposes fewer limitations. The evidence from this study suggests that FDI from globally influential countries with high gross domestic products (GDPs) (e.g. China, U.S.) challenges the ability of countries with lower GDPs (e.g. Cambodia) to protect their culture. Furthermore, the ability, or lack thereof, of the receiving countries to protect their culture is amplified by the existence and implementation of restrictive FDI policies imposed by their governments.
My study abroad in Bali, Indonesia, inspired this research topic as I noticed how globalization is changing the culture of its people. I learned their language and way of life which helped me understand the beauty and importance of cultural preservation. I believe we could all benefit from learning new perspectives as they could help us ideate solutions to contemporary issues and empathize with others.
How Does CRISIL Evaluate Lenders in India for Credit RatingsShaheen Kumar
CRISIL evaluates lenders in India by analyzing financial performance, loan portfolio quality, risk management practices, capital adequacy, market position, and adherence to regulatory requirements. This comprehensive assessment ensures a thorough evaluation of creditworthiness and financial strength. Each criterion is meticulously examined to provide credible and reliable ratings.
Seminar: Gender Board Diversity through Ownership NetworksGRAPE
Seminar on gender diversity spillovers through ownership networks at FAME|GRAPE. Presenting novel research. Studies in economics and management using econometrics methods.
2. MANY MUTUAL FUND MANAGERS SPEND
THEIR TIME AND RESOURCES IN A RACE
WITH OTHER MARKET PARTICIPANTS TO
IDENTIFY MISPRICING AND TRADE ON IT.
HOW DO MOST OF THEM PERFORM?
DO THEIR EFFORTS ADD INVESTMENT
VALUE? RESEARCH OFFERS INSIGHT
INTO THESE QUESTIONS.
3. THE MUTUAL FUND
LANDSCAPE
DIMENSIONAL
FUND ADVISORS
Surveying the landscape
Some people think that successful mutual fund
investing is simply a matter of choosing a fund
that has a winning track record. The financial
media advance this view with features about
top-performing funds and their star managers.
With such a large mutual fund universe in the
US, investors can review historical returns and
easily find a few mutual funds with impressive
track records of outperformance. In hindsight,
investors may feel that they should have recognized the winners in advance—and some people
may decide to start choosing mutual funds based
on their past returns.
2
But selecting a future winner is harder
than it appears. The main reason is market
competition. Many professional fund managers,
along with millions of other market participants
around the world, strive daily to identify
mispriced securities and convert that knowledge
into higher returns.
This intense market competition drives
prices toward fair value, which heightens a
fund manager’s challenge to gain a persistent
informational advantage over other market
participants. In this fiercely competitive
environment, mutual funds that search for
mispriced securities face a steep uphill climb.
Figure 1.1 The US Mutual Fund Industry
Number of equity and fixed income funds, 2012
Number of funds as of
December 2012. Assets
under management as of
the end of each December
from 2003 to 2012.
International equities
include all non-US
developed funds.
3,705
Global fixed includes
all non-US funds,
both developed and
emerging markets.
See Data appendix
on page 12 for
more information.
815
357
1,289
204
US Equities
International Equities
Emerging Equities
US Fixed Income
Global Fixed Income
4. Studying the performance of the US mutual
fund industry offers insight into a fund
manager’s struggle to add value consistently.
The performance data reveals that few funds
have delivered benchmark-beating returns
over time, and it quantifies the difficulty of
identifying winning fund managers in advance.
Let’s consider the data in more detail.
The US mutual fund industry comprises a large
universe of funds covering securities markets
around the world. These funds reflect diverse
investment philosophies and approaches.
Figure 1.1 offers a snapshot of the industry in
2012, showing the number of US-domiciled
equity and fixed income funds in operation at
year-end. Figure 1.2 graphs the total value of
assets under management in each of the past
10 years.
Weighing in at over
$11 trillion, the US
mutual fund industry
is large—and intensely
competitive.
Combined, the figures describe a large and
growing industry. The number of funds has
increased almost 50% over the past decade,
with assets exceeding $11 trillion as of 2012.
The sheer size of the mutual fund universe
highlights its importance as a conduit between
investors and markets, but also illustrates the
intense competition among managers for
investor capital.
3
Figure 1.2 The US Mutual Fund Industry
Assets under management (in USD billions)
$11,051 Total
$5,561
US Equities
$1,239
International Equities
$755
Emerging Equities
$3,188
US Fixed Income
$308
Global Fixed Income
2003 2004 2005 2006 2007 2008 2009 2010 2011
2012
5. THE MUTUAL FUND
LANDSCAPE
DIMENSIONAL
FUND ADVISORS
A case of disappearing funds
The rising fund count and annual growth in assets
mask the fact that many funds disappear each year,
often as a result of poor investment performance.
The large gray boxes in Figures 2.1 and 2.2
represent the number of US-domiciled equity
and fixed income funds in operation during
the past one, five, and 10 years. These funds
compose the beginning universe of each period.
For example, an investor trying to select a
mutual fund five years ago, at the start of 2008,
could have chosen from more than 3,000 equity
funds and more than 800 bond funds.
How many of these funds were still alive at
the end of 2012? The striped areas show the
proportion of the beginning funds that survived.
During the one-year period, 6% of equity funds
and 4% of fixed income funds closed up shop.
4
Over time, survival rates dropped sharply. In
equities, the five- and 10-year survival rates were
just 70% and 51%, respectively. The numbers
were only slightly better in fixed income, with
75% of funds making it five years and 57%
surviving 10 years.
Many investors are not aware of the poor
survival rates of mutual funds. Funds tend to
disappear quietly. The financial media devotes
little attention to underperforming funds,
especially ones that did not survive and are
no longer available for investment.
Analysis shows that disappearing funds tend to
be poor performers. Certainly, investors would
like to identify dropout funds in advance and
avoid them. But the reality is that everyone must
Figure 2.1 Survivorship and Outperformance — Equity Funds
Performance periods ending December 31, 2012
Beginning
Survivors
Beginning sample includes
funds as of the beginning
of the one-, five-, and 10-year
periods ending in 2012. The
number of funds as of the
beginning of each sample
time period is indicated
below the period label.
Winners
94%
Survival
Rate
Survivors are funds that
are still in existence as of
December 2012.
70%
Survival
Rate
37%
Success
Rate
51%
Survival
Rate
25%
Success
Rate
Winners are funds that survive
and beat their respective
benchmarks over the period.
17%
Success
Rate
Past performance is no
guarantee of future results.
See Data appendix
on page 12 for
more information.
1 YEAR
1 YEAR
4,142 funds at beginning
5 YEARS
5 YEARS
3,173 funds at beginning
10 YEARS
10 YEARS
2,506 funds at beginning
6. Beginning
Survivors
Winners
choose from a universe that includes funds that
will not survive the period. Consequently,
an accurate depiction of the fund selection
challenge requires performance data from
both surviving and non-surviving funds.
But investors want to do more than just
pick a fund that survives. Most people are
on a hunt for funds that will outperform
a benchmark. What were the chances of
picking a winning fund?
The blue and yellow shaded areas show the
proportion of equity and fixed income funds
that outperformed their respective benchmarks.
These funds are certainly in the minority.
1 YEAR
5 YEARS
Over both short and long time horizons—and
for both equities and bonds—the deck is stacked
against the investor seeking outperformance.
In 2012, 37% of equity and 40% of fixed
income funds survived and outperformed
their benchmark for the one-year period.
The numbers are even worse for longer
horizons. About one in four funds survived
to provide benchmark-beating performance
over the five years through 2012. Over 10
years, the figure dropped to one in six funds.
Survivors
Only one in four
funds survived and
outperformed over
the five-year period
ending in 2012.
10 YEARS
5
Winners
96%
Survival
Rate
75%
Survival
Rate
57%
Survival
Rate
40%
Success
Rate
23%
Success
Rate
1 YEAR
1 YEAR
1,129 funds at beginning
hard to come by.
In the fiercely competitive mutual fund
industry, many funds don’t survive, but many
more crop up to take their place. The free exit
and entry supports a vast price discovery
effort among managers, with the evidence
suggesting reasonably fair market prices.
Figure 2.2 Survivorship and Outperformance — Fixed Income Funds
Performance periods ending December 31, 2012
Beginning
Outperformance is
5 YEARS
5 YEARS
853 funds at beginning
15%
Success
Rate
10 YEARS
10 YEARS
854 funds at beginning
7. THE MUTUAL FUND
LANDSCAPE
DIMENSIONAL
FUND ADVISORS
The search for winners
The competitive landscape makes the search
for future winners a formidable challenge.
Confronted with so many fund choices—and
lacking an investment philosophy to guide their
search—some investors resort to picking funds
that have strong track records, reasoning that
past outperformers will continue to outpace
their benchmarks.
Does this assumption pay off? The research
offers strong evidence to the contrary.
Figures 3.1 and 3.2 illustrate the lack of
persistence in outperformance. Three-, five-,
and seven-year mutual fund track records
are evaluated as of December 2009.
6
Funds that beat their respective benchmarks are
reevaluated in the subsequent three-year period
ending December 2012.
Only about a quarter of the equity funds
with past outperformance during the initial
three-year period (2007–2009) continued to beat
their benchmarks in the subsequent three-year
period (2010–2012).
Longer track records do little to help investors
identify future outperforming funds. The results
for funds with good five- and seven-year track
records were similar—only about a quarter beat
their benchmarks in the subsequent period.
Figure 3.1 Do Winners Keep Winning? — Equity Funds
Past performance vs. subsequent performance
Winners
Losers
2010-2012
26%
of the 1,189
winning funds
continue to win.
The sample includes funds at
the beginning of the three-,
five-, and seven-year periods,
ending in December 2009.
The graph shows the
proportion of funds that
outperform and underperform
their respective benchmarks.
2007-2009
26%
of the 918
winning funds
continue to win.
Winner funds are reevaluated
in the subsequent period from
2010 to 2012, with the graph
showing the proportion of
outperformance and underperformance among past winners.
2005-2009
Past performance is no
guarantee of future results.
24%
of the 597
winning funds
continue to win.
See Data appendix
on page 12 for
more information.
2003-2009
8. Track records for fixed income funds do not
provide insight into future outperformance,
either. The number of bond funds with good
track records is sparse, with only about 100
funds showing benchmark-beating returns
during the initial three-, five-, and seven-year
performance periods. Only about half of these
past winners continued to outperform in the
subsequent three years.
The results for both winning equity and fixed
income funds show that past outperformance
is no guarantee of future outperformance.
Many equity and bond funds, even those with
good track records, are likely to underperform
their benchmarks.
This lack of persistence among winners suggests
that gaining a consistent informational advantage
is very difficult. Many smart professionals are
striving to gather morsels of information to
help them identify pricing mistakes. But this
competition means that public information is
reflected in market prices quickly, leaving few
opportunities to exploit the knowledge for profit.
Losers
those with good
track records, are
likely to underperform
their benchmarks.
7
2010-2012
43%
of the 118
winning funds
continue to win.
2007-2009
46%
of the 105
winning funds
continue to win.
2005-2009
52%
of the 94
winning funds
continue to win.
2003-2009
bond funds, even
Some fund managers might be better than
others, but they are hard to identify in advance.
Stock and bond returns contain a lot of noise,
and impressive track records often result from
good luck. The assumption that past outperformance will continue often proves faulty, leading
many investors to disappointment.
Figure 3.2 Do Winners Keep Winning? — Fixed Income Funds
Past performance vs. subsequent performance
Winners
Many equity and
9. THE MUTUAL FUND
LANDSCAPE
DIMENSIONAL
FUND ADVISORS
The impact of costs
If competition drives prices to fair value, one
might wonder why underperformance is so
common. A major factor is mutual fund costs.
Costs reduce an investor’s net return and
represent a hurdle for a fund. Before a fund
can outperform, it must first add enough value
to cover its costs.
for the higher costs incurred. Let’s consider how
one type of explicit cost—expense ratios—can
impact fund performance.
In Figures 4.1 and 4.2, equity and fixed
income funds in existence at the beginning
of the one-, five-, and 10-year periods are
ranked into quartiles based on their average
expense ratio. Fund expense ratios range
broadly. For the one-year period (2012), the
median expense ratio was 1.1% for equities
and 0.7% for fixed income.
All mutual funds incur costs. Some costs, such as
expense ratios, are easily observed, while others
are more difficult to measure. The question is
not whether investors must bear some costs, but
whether the costs are reasonable and indicative
of the value added by a fund manager’s decisions.
The data shows that many mutual funds are
expensive to own and do not offer higher value
8
Figure 4.1 High Costs Make Outperformance Difficult — Equity Funds
Winners and losers based on expense ratios (%)
Winners
Losers
1 Year
The sample includes funds
at the beginning of the one-,
five-, and 10-year periods
ending in 2012.
39
5 Years
40
38
33
10 Years
31
24
Funds are ranked into quartiles
based on average expense
ratio over the sample period,
and performance is compared
to their respective benchmarks.
27
17
21
20
16
10
The chart shows the
proportion of winner and
loser funds within each
expense ratio quartile.
Past performance is no
guarantee of future results.
61
60
62
67
69
76
See Data appendix
on page 12 for
more information.
73
83
Average
Expense
Ratio (%)
79
80
84
90
0.48
0.97
1.22
1.66
0.56
1.04
1.30
1.76
0.65
1.13
1.42
2.00
Low
Med.
Low
Med.
High
High
Low
Med.
Low
Med.
High
High
Low
Med.
Low
Med.
High
High
10. In 2012, funds in the lowest quartile cost
equity investors an average of 0.48%. The most
expensive quartile, at 1.66%, had an average
cost that was three times higher. The range is
just as wide in fixed income, with the lowest
quartile charging 0.30% vs. 1.16% for the
highest quartile.
The fixed income experience was similar.
For the five-year period, 30% of the low-cost
bond funds outperformed, vs. 15% of the
high-cost funds. The pattern was even
stronger in the 10-year numbers.
High fees have a draining effect on performance, and the data suggests that high fees
help predict underperformance. The higher
a fund’s costs, the higher its return must be
to stay competitive. Investors may be able to
reduce the odds of picking a persistent loser
by avoiding funds with high expense ratios.
Are investors receiving a better experience from
higher-cost funds? The charts suggest otherwise.
Especially over longer horizons, the cost
hurdle becomes too high for most funds to
overcome. Over the five-year period, 31% of
the low-cost equity funds outperformed, vs.
17% of the high-cost funds. For 10 years, 21%
of the low-cost funds outperformed, vs. only
10% of the high-cost funds.
Losers
1 Year
5 Years
42
45
35
10 Years
40
30
29
23
16
58
55
65
18
11
7
60
70
71
77
84
Average
Expense
Ratio (%)
15
85
costs, the higher its
return must be to
stay competitive.
Investors may be
able to reduce the
odds of picking a
persistent loser by
avoiding funds with
high expense ratios.
9
Figure 4.2 High Costs Make Outperformance Difficult — Fixed Income Funds
Winners and losers based on expense ratios (%)
Winners
The higher a fund’s
82
89
93
0.30
0.61
0.80
1.16
0.37
0.67
0.85
1.25
0.45
0.71
0.93
1.33
Low
Med.
Low
Med.
High
High
Low
Med.
Low
Med.
High
High
Low
Med.
Low
Med.
High
High
11. THE MUTUAL FUND
LANDSCAPE
DIMENSIONAL
FUND ADVISORS
The impact of costly turnover
Pay attention to
trading costs—
they can detract
significantly
from returns.
Other activities can add substantially to a
mutual fund’s overall cost burden. Equity
trading costs, such as brokerage fees, bid-ask
spreads,1 and price impact, can be just as
large as a fund’s expense ratio. Trading costs
are difficult to observe and measure, but
they impact a fund’s return nonetheless—
and the higher these costs, the higher the
outperformance hurdle.
In Figure 5, equity funds existing at the
beginning of the one-, five-, and 10-year
periods are placed in quartiles based on their
average turnover. Turnover varies dramatically
across equity funds, reflecting many different
management styles. For the most recent
one-year period (2012), funds in the lowest
quartile averaged 14.6% turnover. The
average turnover for the highest quartile
was 167.5%, more than 10 times higher.
In equity funds, portfolio turnover can offer
a rough proxy for trading costs. Managers who
trade frequently in their attempts to add value
typically incur greater turnover and higher
trading costs. Although turnover is just one way
to approximate trading costs, the data shows
that funds with higher turnover are more likely
to underperform their benchmarks.
10
The data shows that higher turnover is a drag
on performance: Funds with more turnover
have much lower rates of outperformance over
longer investment horizons. For the lowest
turnover group, 36% of funds managed to beat
their benchmarks over the five-year period.
This fraction dropped to just 12% for the
funds with the highest turnover.
Figure 5 High Trading Costs Make Outperformance Difficult — Equity Funds
Winners and losers based on turnover (%)
Winners
Losers
1 Year
The sample includes equity
funds at the beginning of the
one-, five, and 10-year periods
ending in 2012.
37
5 Years
40
40
34
36
10 Years
32
Funds are ranked into quartiles
based on average turnover
during the sample period,
and performance is compared
to their respective benchmarks.
24
19
12
19
14
10
The chart shows the
proportion of winner and
loser funds within each
turnover quartile.
Fixed income funds are
excluded from the analysis
because turnover is not a
good proxy for fixed income
trading costs.
Past performance is no
guarantee of future results.
See Data appendix
on page 12 for
more information.
63
60
60
66
64
68
76
81
81
88
Average
Turnover
(%)
86
90
14.6
38.0
69.7
167.5
19.4
50.4
84.5
205.1
20.8
54.3
91.4
211.6
Low
Med.
Low
Med.
High
High
Low
Med.
Low
Med.
High
High
Low
Med.
Low
Med.
High
High
12. INVESTMENT LESSONS
This analysis of US mutual fund industry performance casts doubt on the ability
of investors to form a winning long-term strategy by picking outperforming funds
based on past returns. It also raises questions about the effectiveness of investment
strategies that attempt to add value by identifying mispriced securities.
For the periods examined, mutual funds failed to deliver on most
investors’ expectations.
Outperforming funds were in the minority.
Strong track records failed to persist.
High costs and excessive turnover may have contributed to underperformance.
Despite this evidence, many investors continue searching for winning mutual funds
and look to past performance as the main criterion for evaluating a manager’s future
potential. In their pursuit of returns, many investors surrender value to the high costs
of owning the mutual funds.
These results are consistent with a market equilibrium view of investing. Intense
market competition drives securities prices to fair value, making it difficult to
persistently add value by identifying mispriced securities. Despite the best efforts
of many professionals working in the industry, the vast majority of funds fail to
deliver on the promise of outperformance.
The strong evidence of underperformance among US mutual funds points to an
important guiding investment principle: The capital markets do a good job of
pricing securities, which makes beating benchmarks (and other investors) quite
difficult. Moreover, fund managers face additional barriers as they try to outperform
the market.
Choosing a long-term winner involves more than seeking out funds with a successful
track record, as past performance offers no guarantee of a successful investment
outcome in the future. Investors should consider other variables, including a mutual
fund’s underlying market philosophy, investment objectives, and strategy. Also
consider a mutual fund’s total costs, including trading costs, which may be impacted
by the manager’s approach.