Dimensional Fund Advisors' powerful slides on the small cap and value effect detail how small stocks and value stocks enhance portfolio returns and explain portfolio performance.
Pillar Capital provides investment management services focused on dimensions of returns, diversification, and investor discipline. Dimensions of returns refers to systematic differences in expected returns based on factors like company size, relative price, and profitability. Historical data shows that investing based on these dimensions has rewarded long-term investors. Portfolios can be structured to target dimensions shown to produce premiums, like favoring small cap, value, and high-profitability companies.
This document discusses innovations in finance from the 1950s to today. It begins by outlining conventional wisdom from the 1930s that focused on picking individual winners and holding concentrated portfolios. It then summarizes several seminal works and developments that helped shift the field: James Tobin's separation theorem emphasized diversification; William Sharpe developed the single-factor capital asset pricing model relating risk and return; Eugene Fama developed the efficient market hypothesis asserting that markets accurately reflect information. This led to the development of index funds by John Bogle, providing low-cost, passive investment options. Overall, the document outlines major theoretical and practical innovations that professionalized the field of finance and emphasized diversification, risk-adjusted returns, and passive investing.
Structured Investing In An Unstructured WorldRobert Davis
Structured Investing is based on 80+ years of financial market data, Nobel Prize-winning economic research, and in-depth studies of investor psychology and behavior.
The document discusses the performance of various model investment portfolios from 1973-2010. It provides the annualized compound returns and annualized standard deviations for 5 model portfolios over this period. The model portfolios had varying allocations to US and international stocks, bonds, and emerging markets. Model portfolio 5, which had the most diversified allocation, achieved the highest annualized return of 11.65% and relatively low standard deviation of 11.26% compared to the other portfolios.
The document discusses structured investing based on decades of financial market data and economic research. It describes a structured investing approach that seeks to capture market returns by investing in large numbers of stocks across asset classes while minimizing costs. It emphasizes investing in stocks, small companies, and value stocks based on academic research identifying these risks as worth taking over the long term. The approach also advocates diversifying globally and across multiple asset classes.
An index reflects movements in the underlying market and expresses price changes over time. Indices are used by institutional investors to analyze strategies and measure performance. The most important type is the market-value weighted index, where components are weighted by their total market capitalization. This includes major indices like the S&P 500. Investors can purchase index funds to obtain returns matching the performance of indices like the ALSI at low cost.
Pursuing a Better Investment Experience with Capital AssociatesRobUgiansky
This document outlines 10 key principles for improving the odds of investment success:
1) Embrace market pricing and the information incorporated into prices.
2) Don't try to outguess the market through stock picking or market timing as most funds do not outperform their benchmarks.
3) Resist chasing past performance as it does not predict future returns.
4) Let markets work for you through long-term investing as this has rewarded investors over time.
The document discusses strategies for creating an investment portfolio based on Nobel Prize-winning academic research. It recommends structuring portfolios to take advantage of factors like company size, relative price, and profitability that have been shown to increase returns. Specifically, it suggests investing more in small and value stocks, as both have higher returns than large or growth stocks over the long run. The document also provides examples of model portfolios that diversify across global stock and bond index funds targeting these factors.
Parametric provides strategies for exploiting increased market volatility, including rebalancing portfolios and using options strategies. Rebalancing reduces concentration risks and volatility over time by selling assets that have increased in value and buying those that have decreased, capturing returns from volatility. Options strategies can also provide downside protection for portfolios while retaining upside potential. Parametric implemented an options overlay for a client in 2008 that protected against a 5-20% market decline while retaining upside to 30%, balancing protection and participation in gains.
This document provides guidance on pursuing a better investment experience. It recommends embracing market pricing, not trying to outguess the market, resisting chasing past performance, letting markets work for you long-term, considering drivers of returns like company size and profitability, practicing smart diversification globally, avoiding market timing, managing emotions, focusing on long-term advice over entertainment, and controlling what you can like having a tailored plan.
The document discusses the stock market boom of the late 1990s and its impact on the US economy. It finds that the stock market boom between 1995 and 2000 added significantly to economic growth during that period, with estimates that GDP growth was 1.5% higher each year due to the wealth effects of rising stock prices. However, it also led to issues like a lower personal saving rate, a higher trade deficit, and made the economy more vulnerable when the bubble burst in 2001-2002. The document concludes that without the stock boom, the 1990s expansion would not have looked as strong and the 2001 recession may not have occurred.
This document provides an overview and summary of Putnam Absolute Return Funds. It discusses how increased stock market volatility and low bond yields argue for alternative investment strategies. The Putnam Absolute Return Funds aim to generate positive returns regardless of market conditions with less volatility than traditional markets. Each fund seeks a different return target above inflation over a 3-year period using flexible portfolio management across global fixed income, stocks, and alternative assets.
This document provides guidance on pursuing a better investment experience. It recommends embracing market pricing, not trying to outguess the market, resisting chasing past performance, letting markets work for you long-term, considering drivers of returns like value and profitability, practicing smart diversification globally, avoiding market timing, managing emotions, ignoring entertainment over advice, and focusing on controllable factors like a personalized financial plan.
The document discusses three dimensions of expected stock returns:
1) Company size - Small company stocks tend to have higher expected returns than large company stocks over time.
2) Company price - Lower-priced "value" stocks tend to have higher expected returns than higher-priced "growth" stocks over time.
3) Equity market - Stocks tend to have higher expected returns than fixed income investments like bonds over time.
An index is constructed to measure movements in financial markets like stocks and bonds. The SENSEX is India's oldest stock market index, first compiled in 1986 based on 30 large, established companies. It uses a free-float methodology, where the index level reflects the free-float market value of component stocks relative to a base period. Stocks are selected based on criteria like market capitalization, liquidity, and representation of key industries.
The document discusses diversification across different asset classes and geographic regions. It presents 5 model portfolios with varying allocations to US and international stocks and bonds. The most diversified portfolio (Portfolio 5) allocates 30% to international stocks, 7.5% to several US stock size and style factors, and 40% to bonds. Tables show the annual returns and volatility of returns for each model portfolio from 1998-2012. The most diversified portfolio had the highest annualized return of 7.02% and second highest standard deviation of returns of 13.68%.
Understand what and how impacts the market and influences the stock price of several companies. To know more or invest in stocks visit: www.karvyonline.com or call us on 18004198283.
This document provides guidance on building an effective investment portfolio through diversification and managing risk. It recommends creating an asset allocation policy based on your risk tolerance that diversifies across asset classes like stocks and bonds. Specific funds should then be selected within each asset class and regularly monitored to ensure the portfolio still matches your goals and risk profile as markets change over time. The focus should be on long-term growth while minimizing downside risk through this diversified, balanced approach.
- Global bond markets were disrupted in the quarter as bond yields rose sharply due to expectations that the Federal Reserve would scale back its bond-buying program sooner than anticipated.
- Within fixed income, mortgage prepayment strategies detracted from performance but rebounded later in the quarter, while term-structure positioning and commercial mortgage-backed securities contributed to results.
- In stocks, selection strategies and some currency positions in non-directional strategies hurt returns in the 500 and 700 funds.
The document discusses different methods for calculating rates of return on investments. It provides details on simple rates of return, adjusted rates of return, and holding period returns. Historical data on rates of return for various asset classes like stocks, bonds, and bills from 1926-1999 is presented, showing average annual returns and standard deviations. The risk-return relationship and concept of risk premiums are also covered.
This document discusses the Legg Mason Permal Tactical Allocation Fund, a fund-of-funds that invests across global markets and asset classes. It has four dimensions of flexibility: geography, asset class, investment vehicles, and asset allocation. This allows it to adjust its allocation across equities, fixed income, alternatives and cash as market conditions change. Recently it has shifted more to stocks and alternatives from bonds. The fund aims to generate equity-like returns with lower volatility by diversifying across multiple asset classes. It is managed by Permal, a global pioneer in multi-manager funds with over 35 years of experience.
This document discusses three investors who achieved billion-dollar fortunes through successful investing strategies:
- Warren Buffett achieved annual returns of 28% by investing in "great businesses with wide moats" and holding them for the long term.
- George Soros made $1.8 billion in 1992 by shorting the British pound and investing in German marks, epitomizing a willingness to take huge risks.
- John Paulson made $20 billion for his firm during the financial crisis by correctly betting against the US housing market and financial stocks.
This document provides an overview and analysis of the economic situation and stock market in 2008 during the financial crisis. It discusses the major events that occurred, including bank failures and government interventions. It also looks at where the economy and markets currently stand, and offers recommendations to long-term investors to remain invested and not overreact to short-term volatility.
The Need for Diversification (“Skittles Chart”) Asset Class Index Performance
The “Skittles Chart” is a great way to show investors the randomness of investment returns from one year to the next, reinforcing the potential benefits of Asset Class Investing as an alternative to active management.
Stock market and the economy ppt slidesRafik Algeria
The document discusses the relationship between the stock market and economic activity. It begins by introducing the topic and explaining how firms raise funds through debt and equity financing. It then defines what a stock market is, how stocks are traded, and how stock prices are determined by supply and demand. Several factors that can influence stock prices are explained, including economic conditions, firm-specific factors, and market factors. The relationship between the stock market and broader economy is explored, specifically how changes in the stock market can impact aggregate demand and economic growth through wealth and investment effects, and how economic conditions can in turn impact stock prices and investor sentiment. The role of the Federal Reserve in responding to stock market fluctuations is also summarized.
Strenghs and weaknesses of CAC 40 materiality assessmentsMarionMartorell
The document discusses materiality assessments conducted by CAC 40 companies. It finds that while transparency around materiality assessments has increased, with most companies publishing materiality matrices, many assessments still lack strategic perspective, representativeness of stakeholders consulted, and follow up. It recommends that companies take a more robust analytical approach to link material issues to risks, opportunities and performance, and engage a wider range of internal and external stakeholders. A strategic, long-term approach integrating materiality more fully into reporting and management would help companies better address sustainability challenges.
This document discusses funding options for growing SaaS companies. It provides an overview of BJ Lackland and his experience financing early stage tech companies. It then summarizes Lighter Capital's financing model of revenue-based financing, which provides capital to companies in exchange for a percentage of monthly revenue over time. The presentation outlines various funding paths like venture capital, debt, and blended models. It compares features of different funding sources and provides tips for selecting a funding path and preparing for funding.
Pulse of the OIC Islamic Capital Markets reportDinarStandard
The document summarizes the current state of Islamic capital markets within Organization of Islamic Cooperation (OIC) member countries. It finds that while the markets have grown significantly in recent years, they remain fragmented and inefficient compared to global markets. The largest Islamic capital markets are in Malaysia and Saudi Arabia. Equity markets in Indonesia and Dhaka Stock Exchange have grown the most recently. Sukuk issuance has slowed due to transparency issues but demand remains high. Most Islamic funds are small, under $50 million, indicating opportunities for growth. Overall, Islamic capital markets have potential but face challenges in becoming more coordinated and developed.
English rules
- Finance
- Science and technology
- Universities
- Advertising
- Computing
- Publishing industry
- Entertainment
- International organisations
- International transportation
- Interpreting and translation
France is an attractive location for foreign investment for several reasons:
1. It has a highly skilled workforce, particularly in research and development.
2. It has well-developed infrastructure and is centrally located within Europe, providing access to the large European market.
3. Several industries such as aerospace, automotive, and agriculture are growing and have seen foreign companies establish production facilities in France.
The document provides information about the S&P CNX Nifty and NASDAQ-100 stock indices.
The S&P CNX Nifty tracks the performance of the 50 largest Indian companies listed on the National Stock Exchange of India based on market capitalization. It covers 23 sectors of the Indian economy. The NASDAQ-100 tracks the performance of 100 of the largest domestic and international non-financial companies listed on the Nasdaq Stock Market based on market capitalization. Both indices have eligibility criteria for initial and continued inclusion and use formulae to calculate index values based on the market values and weights of constituent securities.
This document provides a summary of the French financial system and corporate social responsibility practices in France. It was presented by four students and covers several topics: the structure of the French financial system including regulatory institutions, banking and non-banking institutions, the mutual fund and insurance industries, and supervising institutions. It also discusses corporate social responsibility initiatives in France and provides case studies of CSR practices at several French companies. Finally, it examines business opportunities and trade relations between India and France.
Strategy&’s 15th annual study of CEOs, Governance, and Success highlights the value lost by poor CEO succession planning and what companies can gain by better planning.
EY French Venture Capital Barometer - Annual results 2015EY
The EY French Venture Capital Barometer identifies financing operations in equity of companies in their creation phase or during their first years after creation, from 1st of January to 31st of December 2015, published before the 14th of January 2016.
Business valuation fundamentals & the maximization of entity valueAzran Financial APC
In the complex world of business valuation, understanding the valuations process can be of key importance to receiving the highest and best value for your company.
Through a basic understanding of the principles of business valuation (both public and private, closely held) one can learn to navigate the process that touches everything from transactions to taxation.
Characteristics of fortune 500 companiessimplyabhay
The document summarizes characteristics of companies on the Fortune 500 list. It discusses 12 key characteristics including having a clear vision, treating employees well through empowerment and training, focusing on performance and profitability, prioritizing customer service and quality, effective communication, strong ethics, acceptance of change and innovation. The top industries represented are petroleum and retail. The US, Japan and China have the most companies, though the number from some countries like South Korea is decreasing.
File provided by AATF at https://frenchadvocacy.wikispaces.com/ for use by French teachers for advocacy. Uploaded here to allow for embedding on my school wiki.
The document provides information about the Karachi Stock Exchange (KSE) in Pakistan. It discusses that KSE is the largest stock exchange in Pakistan, established in 1949. It facilitates capital formation and provides a liquid marketplace for investors. KSE has over 500 listed companies and introduced electronic trading systems like KATS. It remains committed to upgrading technology and assessing customer needs. The document outlines the history, vision, mission, products, sectors, indexes and regulations of the KSE.
The document discusses equity trading in India and the future of online trading and demat accounts. It provides an overview of Sharekhan Ltd, a stock brokerage firm that offers online trading and depository services. The document analyzes Sharekhan's products, services, competitors and discusses factors like increasing online trading that positively impact the company's future growth prospects. Customer surveys found that awareness of equity trading is high but people prefer less risky investments. The document recommends that Sharekhan expand its branch network and reduce account opening times to better serve more customers.
OTCQX: The Clear Advantage -- Research StudySaskianna
OTC Markets Group commissioned strategic advisory firm Oxford Metrica to conduct an independent study examining the impact of trading on OTCQX, the top U.S. over-the-counter (“OTC”) market, in terms of share liquidity, bid-ask spreads, broker-dealer coverage, and investor perception.
The study evaluated all securities that traded on OTCQX for at least three months during the three years prior to October 31, 2015, a total of 397 primary securities with $1 trillion in combined market capitalization. Liquidity was analyzed for the six months prior to joining OTCQX compared with the subsequent six months.
The document discusses the NIFTY and SENSEX stock market indices of India. It provides details on:
1) How the SENSEX and NIFTY indices are calculated based on the free-floating market capitalization of their constituent stocks. The SENSEX includes 30 stocks and uses 1978-79 as the base year, while NIFTY includes 50 stocks and uses 1995 as the base year.
2) The major companies that make up the SENSEX (e.g. Reliance, TCS, HDFC Bank) and NIFTY (same top companies).
3) A brief history of the National Stock Exchange and the objectives and products it offers.
Building the Billion Dollar SaaS Unicorn: CEO GuideKelly Schwedland
In a Venture Capital world that is obsessed with growth, recurring revenue and software as a service, after you validate that you have a solution that people are willing to pay for, there is an entire new world ahead of you in scaling that venture. For many, this involves an entirely new language and set of metrics to manage the business. For the startup that wants to make the leap to scale up and fast growth this should serve as a starting point for key insights and metrics for that journey.
The document discusses the benefits of strategic human capital management including increasing revenue, improving customer satisfaction, improving quality, increasing productivity, reducing costs and cycle times, and increasing market capitalization. It provides studies and research that show correlations between talent management practices and these benefits. It also discusses processes that organizations can use to drive performance, appraise talent, manage learning and succession, and ensure they have the right people with the right skills deployed.
Design, build, protect with Capital AssociatesMitch Katz
This document discusses Loring Ward's approach to financial planning and investment management. It outlines their three-step process of designing a tailored plan to meet clients' goals, building portfolios using academic research, and protecting plans by providing guidance. It promotes diversifying globally and incorporating small and value stocks. Charts show long-term stock market growth and benefits of rebalancing. The goal is helping clients achieve financial security and stay on track to reach their "someday."
Loring Ward is an investment advisor registered with the SEC. The strategies discussed may not achieve their objectives and involve risks, including loss of principal. Securities are offered through Loring Ward Securities.
New perspectives on asset class investingRobUgiansky
This document discusses various investment strategies including active and passive investing. It notes that most active managers underperform their benchmarks over time. It also discusses the benefits of asset class investing over index investing, including lower costs, improved tax efficiency, increased diversification, better risk exposure, and potentially better long-term performance. Charts show that a diversified portfolio following an asset class approach outperformed the S&P 500 since 2000 and was less volatile, and held up better in the face of withdrawals.
Wealth advisors LLC pursues a better investment experience for its clients by embracing principles of prudent diversification and avoiding behaviors that often undermine returns, such as market timing, chasing past performance, and overreacting to short-term market movements. The firm recommends low-cost, globally diversified portfolios and advises clients to focus on what they can control - their investment plan, taxes, and expenses - rather than trying to outguess unpredictable markets. By following these disciplined strategies, the firm aims to help clients achieve superior long-term returns.
This document discusses pursuing a better investment experience by embracing principles such as embracing market pricing, not trying to outguess the market, resisting chasing past performance, letting markets work for investors, considering drivers of returns, practicing smart diversification, avoiding market timing, managing emotions, not confusing entertainment with advice, and focusing on what can be controlled. The key ideas are that following basic principles of prudent investing over long periods can help investors achieve better results than trying to beat the market through tactics like stock picking, market timing, or chasing past performance.
Active managers have generally not outperformed the market in either bull or bear markets. During the 2008 financial crisis, actively managed funds underperformed the S&P 500 index by an average of 1.67% on average. Studies from 2008-2012 also found that the majority of active managers failed to outperform their benchmarks across various market categories. While markets have historically delivered positive returns, it is typically a small group of top-performing stocks that drive those returns, making it difficult for managers to consistently pick winners. Diversification can help reduce risk and volatility compared to investing only in stocks, as seen during the 1973-1976 and 2007-2011 periods where a diversified portfolio lost less than a pure stock portfolio.
The document provides a 10-year snapshot of annual total returns for various asset classes from 2006 to 2015. It shows that diversification across asset classes can help manage volatility in changing markets, as the best and worst performing asset classes varied significantly from year to year. Past performance is not a guarantee of future results, and diversification does not ensure profits or prevent losses.
Pursuing a Better Investment Experience Brochure BrandedTheresa M. Mahoney
The Bridgeway Group is a financial services firm with offices in Pasadena and Covina, California. It offers securities and advisory services through Commonwealth Financial Network. The document includes various exhibits with disclosures related to mutual fund performance, dimensions of expected returns, benefits of diversification, and avoiding reactions to short-term market movements. It emphasizes focusing on factors within an investor's control and maintaining a long-term perspective.
The investment philosophy focuses on efficient market investing through portfolio design and implementation that targets dimensions of higher expected returns like value, size, and profitability. It believes prices reflect all available information and aims to add value not by forecasting but by pursuing risk premia in a low-cost, diversified portfolio. Traditional active management often relies on forecasting and generates higher costs without consistent outperformance, while index funds provide little flexibility.
Actions You Can Take After Great Recessionbruce_gillen
This document provides lessons learned from the Great Recession and actions investors can take. It recommends diversifying investments across different asset classes, rebalancing portfolios as needed, using dollar cost averaging to invest consistently, and avoiding emotional reactions to market volatility. Developing a long-term financial plan that considers goals, risk tolerance and taxes can help investors feel more confident during periods of market turmoil. The key is maintaining a disciplined, balanced approach rather than trying to time the market.
Actions You Can Take After Great Recessionbruce_gillen
This document provides lessons learned from the Great Recession and actions investors can take. It recommends diversifying investments across different asset classes, rebalancing portfolios as needed, using dollar cost averaging to invest consistently, and avoiding emotional reactions to market volatility. Developing a long-term financial plan that considers goals, risk tolerance and taxes can help investors feel more confident during periods of market turmoil. The key is disciplined investing with a strategy, rather than trying to time the market based on emotions.
Stop Wasting Your Money & Start Having a Better Investment ExperienceAndreas Scott, CFP®
This document provides a summary of strategies for pursuing a better investment experience. It recommends embracing market pricing, not trying to outguess the market by stock picking, resisting chasing past performance, letting markets work for long-term investors, considering dimensions of expected returns like value and size, practicing smart diversification globally, avoiding market timing, managing emotions during market cycles, looking beyond headlines, and focusing on what can be controlled like working with a financial advisor.
The document provides an overview of market volatility and downturns. It discusses how declines are normal aspects of the market cycle and outlines historical data on the average length and frequency of different types of declines. It also notes that expansions have typically lasted longer than recessions throughout history.
The document provides disclosures and sources for several exhibits. Exhibit 1 discloses trading data sources for world equity trading volumes. Exhibit 2 describes the mutual fund sample and methodology used to determine "winner" funds that outperformed benchmarks. Exhibit 3 explains how the analysis was conducted to determine the percentage of top-ranked funds that maintained their ranking in subsequent years. The source for Exhibits 2 and 3 is also provided.
1. The document discusses key principles for improving the odds of investment success, including embracing market pricing, not trying to outguess the market through timing, and resisting chasing past performance.
2. It notes that most mutual funds do not maintain top performance over time and that past returns are not predictive of future returns. Investors are advised to consider the drivers of returns like market risk premia.
3. The principles also emphasize smart diversification across market segments, avoiding reactive investing to headlines, and focusing on controlling what you can, like expenses and discipline, rather than market movements.
The document provides an overview and analysis of financial markets in 2009. It discusses the economic turmoil affecting markets, outlines different types of market declines, and analyzes stock and bond returns over time. The document emphasizes maintaining realistic expectations, the benefits of long-term investing, and risks of trying to time the market.
1) Asset allocation involves dividing investments among different asset classes like stocks, bonds, and cash equivalents to gain exposure to rotating market leaders and help reduce volatility.
2) Maintaining a balanced mix of assets tailored to an individual's goals, time horizon, and risk tolerance can potentially increase returns compared to holding single assets.
3) Asset allocation strategies need periodic rebalancing to maintain the intended risk level as market conditions and individual circumstances change over time.
Why Global Diversification Matters By Anthony Davidow Ap.docxgauthierleppington
Why Global Diversification Matters
By Anthony Davidow
April 02, 2018
Over the past few years, some investors have begun to question the merits of global asset
allocation. They wonder whether the risks abroad justify investing money outside the United
States—and whether there truly are diversification benefits to doing so. Some have even
challenged Modern Portfolio Theory itself, which emphasizes the long-term benefits of a
diversified portfolio.
In some ways it’s natural. It’s an unpredictable world, and investors worry about market
volatility both at home and abroad. Everything from political questions in the wake of the U.K.’s
“Brexit” vote in the summer of 2016 to the recent U.S. elections to anticipation of the Federal
Reserve raising rates have indeed contributed to market swings.
Moreover, in investing—as in sports and other areas of life—people often exhibit familiarity bias
(“home-country bias” in this case). We’re inclined to believe in and root for the things that we
know best. While this may be human nature, home-country bias limits an investor’s universe of
available opportunities. Worse, it may not be prudent given the nature of today’s global markets:
According to MSCI data, roughly half of all global companies are based outside the United
States, which corresponds to global gross domestic product (GDP) ratios.
Do you really want to limit your investment opportunities by half? How can you overcome
home-country bias?
As the saying goes…
Times like these show why the adage “don’t put all your eggs in one basket” is so vital for
investors. An investment sector that performs well one month or year might be a poor performer
the next. For example, as the chart below shows, emerging market stocks were the worst
performer in 2008—only to rebound back to the top in 2009 and also 2017. More recently,
international developed stocks were among the top performers in 2017, after placing near the
bottom in 2016.
Over the long run, there’s no discernible pattern to the rotation among the top performers, so it
doesn’t make much sense to concentrate all your investments in a particular region or asset class.
A globally diversified portfolio—one that puts its eggs in many baskets, so to speak—tends to be
better positioned to weather large year-over-year market gyrations and provide a more stable set
of returns over time.
How key asset classes compare to a diversified portfolio
Source: Morningstar Direct and the Schwab Center for Financial Research. Data is from January 1, 2008, to December 31, 2017. Asset class
performance represented by annual total returns for the following indexes: S&P 500® Index (U.S. Lg Cap), Russell 2000® Index (U.S. Sm Cap),
MSCI EAFE® net of taxes (Int’l Dev), MSCI Emerging Markets IndexSM (EM), S&P United States REIT Index and S&P Global Ex-U.S. REIT
Index (REITs), S&P GSCI® (Commodities), Bloomberg Barclays U.S. Treasury Inflation-Protection Securities (TIPS) Index, Bloo.
The document discusses market volatility and strategies for dealing with it. It defines volatility, looks at historical volatility levels, and discusses how volatility affects investors. It then outlines the wealth management group's strategies, which include repositioning portfolios to focus on quality income assets, employing strategies to dampen volatility, and ensuring portfolios align with clients' goals and risk tolerance.
Similar to Size and value effects for stocks thru 2009 (20)
This document discusses the concept of error terms in investment returns and strategies. It makes three key points:
1) Even portfolios with identical exposures to risk factors like market, size, and value will experience random variation in returns over time due to residual error from differences in underlying security holdings. This error averages to zero over the long run.
2) Tax-managed investment strategies will differ in returns from benchmarks, but offer higher after-tax returns justifying the tracking error. Maximum annual deviations were 2.3% overperformance and 1.3% underperformance.
3) The Fama-French multifactor model helps investors manage systematic risk factors rather than focus on arbitrary benchmarks or short-term noise in
The document summarizes a five-factor asset pricing model that augments the Fama-French three-factor model by adding profitability and investment factors.
The five-factor model is tested using portfolios sorted on size, book-to-market equity ratio, profitability, and investment to produce spreads in average returns. The results show patterns in average returns related to size, value, profitability, and investment that the five-factor model seeks to capture. Specifically, small stocks and stocks with high book-to-market ratios, profitability, or low investment tend to have higher average returns. However, the model has difficulties explaining the low returns of some small, low-profitability stocks that invest heavily.
The document summarizes factor investing using Norway's sovereign wealth fund as a case study. It finds that 99% of the variation in the fund's returns can be explained by its strategic asset allocation decisions between equities and bonds. This supports the finding that the most important investment decision is the top-down choice of asset allocation. The document also defines factors as classes of securities that have higher long-term returns than the broad market, such as value stocks, momentum stocks, illiquid securities, risky bonds, and options strategies. Adopting a factor investing approach allows investors to access these premiums in a cost-effective manner.
We are all prone to cognitive biases that make it easy to fool ourselves, even more so than others. Confirmation bias and motivated reasoning cause us to only see evidence that supports our existing beliefs and interpretations. The bias blind spot further prevents us from recognizing our own cognitive biases. While the scientific method aims to reduce bias through rigorous testing of hypotheses, even scientists fall prey to these biases and often fail to replicate their own seminal studies. Overcoming cognitive biases requires acknowledging their existence and establishing processes like "adversarial collaboration" that encourage challenging existing ideas without fear of reprisal.
1) The mutual fund landscape comprises thousands of funds competing to identify mispriced securities, making it difficult for most funds to consistently outperform their benchmarks over time.
2) Few funds survive for long periods, with about half of equity funds disappearing within 10 years, largely due to poor performance. Similarly, only about one in six funds delivers benchmark-beating returns over 10 years.
3) Past outperformance is not predictive of future success, as most "winning" funds fail to continue outperforming in subsequent periods. High costs also predict future underperformance, with funds in the lowest cost quartiles more likely to outperform over 5 and 10 year periods.
The three-factor model developed by Fama and French provides a framework for investment strategies that identifies sources of risk that compensate investors. It explains stock returns better than the single-factor CAPM model by including factors for firm size and book-to-market ratio in addition to market beta. While book-to-market ratio may not seem to directly describe risk, it serves as a proxy for a company's financial distress - high book-to-market stocks tend to be more risky with higher expected returns. The three-factor model allows advisors to construct portfolios targeting different risk exposures from size and value factors to outperform the market over the long run.
This document provides historical return data for various investment indexes from 1926 to 2012. It discusses Dimensional Fund Advisors' evolution in response to advances in financial research. Key points include:
- Dimensional structures portfolios around dimensions of expected returns identified by research, such as market, size, value, and profitability factors.
- Recent research identified profitability as a new dimension with high profitability firms having higher average returns.
- Dimensional incorporates new research findings by evolving existing strategies and developing new ones.
- Dimensional's approach focuses on expected returns rather than attempting to time markets or capture short-term anomalies.
- Historical return data is provided for indexes spanning US and international equities
Dimensional investors are able to capture the value premium where others fail through an integrated investment process. Their process begins with clear investment principles of efficient markets and targeting dimensions of expected return like value and size. They design strategies for continuous exposure to these premium-generating factors. Their portfolio engineering, management, and trading are dynamically integrated to minimize costs from factors like momentum and provide liquidity. This allows Dimensional to reliably deliver excess returns to investors from targeting premiums.
This research paper discusses enhancing value investment strategies by incorporating expected profitability.
For small cap value strategies, the paper proposes excluding stocks in each country with the lowest direct profitability, with the percentage excluded depending on the stock's price-to-book ratio.
For large cap value strategies, the paper suggests selecting stocks based on both low price-to-book ratios and high direct profitability. It also proposes overweighting stocks that have higher profitability, lower market capitalization, and lower relative price.
The goal is to structure portfolios to better capture the dimensions of expected returns related to company size, relative price, and expected profitability, while maintaining appropriate diversification and managing costs.
This document describes the services of a part-time CFO service for small businesses. They help business owners understand their financial metrics through analysis of profitability, cash flow, ratios, and forecasting. They analyze key metrics, identify trends, and grade performance in areas like capital structure and profitability. They also help solve strategic problems by determining how to reach goals through actions like increasing prices or reducing expenses. The service aims to provide actionable financial insights and advice to small businesses without needing a full-time CFO.
4 active vs passive advisor insert funds flows dfa (advisor present) p. 1-3, ...Weydert Wealth Management
This excellent article contains three key graphics illustrating how average investors flow into and out of investments at the wrong times and contrasts this with the average DFA investor who remains much more consistent and disciplined.
This document provides a summary of Dimensional Fund Advisors' 30 year history from 1981 to 2010. It discusses how Dimensional was founded on empirical financial research and introduced novel investment strategies like microcap investing. Over the decades, Dimensional expanded its offerings globally while maintaining its focus on translating academic theories into practical investment solutions. Key events include expanding client base, growing assets under management, moving headquarters, and continuing to work closely with leading financial academics.
"Does Foreign Direct Investment Negatively Affect Preservation of Culture in the Global South? Case Studies in Thailand and Cambodia."
Do elements of globalization, such as Foreign Direct Investment (FDI), negatively affect the ability of countries in the Global South to preserve their culture? This research aims to answer this question by employing a cross-sectional comparative case study analysis utilizing methods of difference. Thailand and Cambodia are compared as they are in the same region and have a similar culture. The metric of difference between Thailand and Cambodia is their ability to preserve their culture. This ability is operationalized by their respective attitudes towards FDI; Thailand imposes stringent regulations and limitations on FDI while Cambodia does not hesitate to accept most FDI and imposes fewer limitations. The evidence from this study suggests that FDI from globally influential countries with high gross domestic products (GDPs) (e.g. China, U.S.) challenges the ability of countries with lower GDPs (e.g. Cambodia) to protect their culture. Furthermore, the ability, or lack thereof, of the receiving countries to protect their culture is amplified by the existence and implementation of restrictive FDI policies imposed by their governments.
My study abroad in Bali, Indonesia, inspired this research topic as I noticed how globalization is changing the culture of its people. I learned their language and way of life which helped me understand the beauty and importance of cultural preservation. I believe we could all benefit from learning new perspectives as they could help us ideate solutions to contemporary issues and empathize with others.
Solution Manual For Financial Accounting, 8th Canadian Edition 2024, by Libby...Donc Test
Solution Manual For Financial Accounting, 8th Canadian Edition 2024, by Libby, Hodge, Verified Chapters 1 - 13, Complete Newest Version Solution Manual For Financial Accounting, 8th Canadian Edition by Libby, Hodge, Verified Chapters 1 - 13, Complete Newest Version Solution Manual For Financial Accounting 8th Canadian Edition Pdf Chapters Download Stuvia Solution Manual For Financial Accounting 8th Canadian Edition Ebook Download Stuvia Solution Manual For Financial Accounting 8th Canadian Edition Pdf Solution Manual For Financial Accounting 8th Canadian Edition Pdf Download Stuvia Financial Accounting 8th Canadian Edition Pdf Chapters Download Stuvia Financial Accounting 8th Canadian Edition Ebook Download Stuvia Financial Accounting 8th Canadian Edition Pdf Financial Accounting 8th Canadian Edition Pdf Download Stuvia
^%$Zone1:+971)581248768’][* Legit & Safe #Abortion #Pills #For #Sale In #Duba...mayaclinic18
Whatsapp (+971581248768) Buy Abortion Pills In Dubai/ Qatar/Kuwait/Doha/Abu Dhabi/Alain/RAK City/Satwa/Al Ain/Abortion Pills For Sale In Qatar, Doha. Abu az Zuluf. Abu Thaylah. Ad Dawhah al Jadidah. Al Arish, Al Bida ash Sharqiyah, Al Ghanim, Al Ghuwariyah, Qatari, Abu Dhabi, Dubai.. WHATSAPP +971)581248768 Abortion Pills / Cytotec Tablets Available in Dubai, Sharjah, Abudhabi, Ajman, Alain, Fujeira, Ras Al Khaima, Umm Al Quwain., UAE, buy cytotec in Dubai– Where I can buy abortion pills in Dubai,+971582071918where I can buy abortion pills in Abudhabi +971)581248768 , where I can buy abortion pills in Sharjah,+97158207191 8where I can buy abortion pills in Ajman, +971)581248768 where I can buy abortion pills in Umm al Quwain +971)581248768 , where I can buy abortion pills in Fujairah +971)581248768 , where I can buy abortion pills in Ras al Khaimah +971)581248768 , where I can buy abortion pills in Alain+971)581248768 , where I can buy abortion pills in UAE +971)581248768 we are providing cytotec 200mg abortion pill in dubai, uae.Medication abortion offers an alternative to Surgical Abortion for women in the early weeks of pregnancy. Zone1:+971)581248768’][* Legit & Safe #Abortion #Pills #For #Sale In #Dubai Abu Dhabi Sharjah Deira Ajman Fujairah Ras Al Khaimah%^^%$Zone1:+971)581248768’][* Legit & Safe #Abortion #Pills #For #Sale In #Dubai Abu Dhabi Sharjah Deira Ajman Fujairah Ras Al Khaimah%^^%$Zone1:+971)581248768’][* Legit & Safe #Abortion #Pills #For #Sale In #Dubai Abu Dhabi Sharjah Deira Ajman Fujairah Ras Al Khaimah%^^%$Zone1:+971)581248768’][* Legit & Safe #Abortion #Pills #For #Sale In #Dubai Abu Dhabi Sharjah Deira Ajman Fujairah Ras Al Khaimah%^^%$Zone1:+971)581248768’][* Legit & Safe #Abortion #Pills #For #Sale In #Dubai Abu Dhabi Sharjah Deira Ajman Fujairah Ras Al Khaimah%^^%$Zone1:+971)581248768’][* Legit & Safe #Abortion #Pills #For #Sale In #Dubai Abu Dhabi Sharjah Deira Ajman Fujairah Ras Al Khaimah%^^%$Zone1:+971)581248768’][* Legit & Safe #Abortion #Pills #For #Sale In #Dubai Abu Dhabi Sharjah Deira Ajman Fujairah Ras Al Khaimah%^^%$Zone1:+971)581248768’][* Legit & Safe #Abortion #Pills #For #Sale In #Dubai Abu Dhabi Sharjah Deira Ajman Fujairah Ras Al Khaimah%^^%$Zone1:+971)581248768’][* Legit & Safe #Abortion #Pills #For #Sale In #Dubai Abu Dhabi Sharjah Deira Ajman Fujairah Ras Al Khaimah%^^%$Zone1:+971)581248768’][* Legit & Safe #Abortion #Pills #For #Sale In #Dubai Abu Dhabi Sharjah Deira Ajman Fujairah Ras Al Khaimah%^^%$Zone1:+971)581248768’][* Legit & Safe #Abortion #Pills #For #Sale In #Dubai Abu Dhabi Sharjah Deira Ajman Fujairah Ras Al Khaimah%^^%$Zone1:+971)581248768’][* Legit & Safe #Abortion #Pills #For #Sale In #Dubai Abu Dhabi Sharjah Deira Ajman Fujairah Ras Al Khaimah%^^%$Zone1:+971)581248768’][* Legit & Safe #Abortion #Pills #For #Sale In #Dubai Abu Dhabi Sharjah Deira Ajman Fujairah Ras Al Khaimah%^^%$Zone1:+971)581248768’][* Legit & Safe #Abortion #Pills #For #Sale In #Dubai Abu Dhabi Sharjah Deira Ajman
Falcon stands out as a top-tier P2P Invoice Discounting platform in India, bridging esteemed blue-chip companies and eager investors. Our goal is to transform the investment landscape in India by establishing a comprehensive destination for borrowers and investors with diverse profiles and needs, all while minimizing risk. What sets Falcon apart is the elimination of intermediaries such as commercial banks and depository institutions, allowing investors to enjoy higher yields.
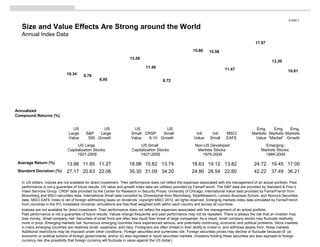
1. In US dollars. Indices are not available for direct investment. Their performance does not reflect the expenses associated with the management of an actual portfolio. Past
performance is not a guarantee of future results. US value and growth index data (ex utilities) provided by Fama/French. The S&P data are provided by Standard & Poor’s
Index Services Group. CRSP data provided by the Center for Research in Security Prices, University of Chicago. International Value data provided by Fama/French from
Bloomberg and MSCI securities data. International Small data compiled by Dimensional from Bloomberg, StyleResearch, London Business School, and Nomura Securities
data. MSCI EAFE Index is net of foreign withholding taxes on dividends; copyright MSCI 2010, all rights reserved. Emerging markets index data simulated by Fama/French
from countries in the IFC Investable Universe; simulations are free-float weighted both within each country and across all countries.
Indexes are not available for direct investment. Their performance does not reflect the expenses associated with the management of an actual portfolio.
Past performance is not a guarantee of future results. Values change frequently and past performance may not be repeated. There is always the risk that an investor may
lose money. Small company risk: Securities of small firms are often less liquid than those of large companies. As a result, small company stocks may fluctuate relatively
more in price. Emerging markets risk: Numerous emerging countries have experienced serious, and potentially continuing, economic and political problems. Stock markets
in many emerging countries are relatively small, expensive, and risky. Foreigners are often limited in their ability to invest in, and withdraw assets from, these markets.
Additional restrictions may be imposed under other conditions. Foreign securities and currencies risk: Foreign securities prices may decline or fluctuate because of: (a)
economic or political actions of foreign governments, and/or (b) less regulated or liquid securities markets. Investors holding these securities are also exposed to foreign
currency risk (the possibility that foreign currency will fluctuate in value against the US dollar).
Size and Value Effects Are Strong around the World
Annual Index Data
S1220.7
US
Large
Value
S&P
500
US
Large
Growth
US
Small
Value
CRSP
6-10
US
Small
Growth
Intl.
Value
Intl.
Small
MSCI
EAFE
Emg.
Markets
Value
Emg.
Markets
“Market”
Emg.
Markets
Growth
US Large
Capitalization Stocks
1927-2009
US Small
Capitalization Stocks
1927-2009
Non-US Developed
Markets Stocks
1975-2009
Emerging
Markets Stocks
1989-2009
13.96 11.85 11.27 18.98 15.82 13.74 18.63 19.12 13.82 24.72 19.45 17.00
27.17 20.63 22.06 35.30 31.09 34.20 24.90 28.54 22.60 42.22 37.49 36.21
Annualized
Compound Returns (%)
Average Return (%)
Standard Deviation (%)
10.34 9.79
8.95
13.59
11.49
8.72
15.86 15.58
11.47
17.97
13.30
10.81
2. Periods based on rolling annualized returns. 703 total 25-year periods. 763 total 20-year periods.
823 total 15-year periods. 883 total 10-year periods. 943 total 5-year periods.
Performance based on Fama/French Research Factors. Securities of small companies are often less liquid than those of large companies.
As a result, small company stocks may fluctuate relatively more in price. Mutual funds distributed by DFA Securities LLC.
The Risk Dimensions Delivered
July1926-December 2009
In 5-Year Periods
In 10-Year Periods
In 15-Year Periods
In 20-Year Periods
In 25-Year Periods Value beat growth 100% of the time.
Value beat growth 100% of the time.
Value beat growth 99% of the time.
Value beat growth 96% of the time.
Value beat growth 86% of the time.
Small beat large 96% of the time.
Small beat large 83% of the time.
Small beat large 78% of the time.
Small beat large 68% of the time.
Small beat large 60% of the time.
US Value vs. US Growth US Small vs. US Large
S1271.3
3. S1260.2
Structure Determines Performance
• Over 96% of the variation in returns is due to
risk factor exposure.
• After fees, traditional management typically
reduces returns.
The Model Tells the Difference between Investing and Speculating
average
expected
return
(minus T-bills)
=
average
excess
return
+
sensitivity
to market
[market return
minus T-bills]
+
sensitivity
to size
[small stocks
minus big stocks]
+
random
error
e(t)
Priced Risk
• Positive expected return.
• Systematic.
• Economic.
• Long-term.
• Investing.
Unpriced Risk
• Noise.
• Random.
• Short-term.
• Speculating.
96% Structured
Exposure to Factors
• Market.
• Size.
• Value/growth.
sensitivity
to BtM
[value stocks
minus growth stocks]
Source: Dimensional Fund Advisors study (2002) of 44 institutional equity pension plans with $452 billion total assets.
Factor analysis run over various time periods, averaging nine years. Total assets based on total plan dollar amounts as of year end 2001.
Average explanatory power (R2
) is for the Fama/French equity benchmark universe.
+
4% Unexplained Variation
Editor's Notes
Talking Points:
The size and BtM effects appear in both US and international markets—strong evidence that the risk factors are systematic across the globe.
This graph demonstrates the higher expected returns offered by small cap stocks and value (high-BtM) stocks in the US, non-US developed, and emerging markets. Note that the international and emerging markets data is for a shorter time frame.
Small cap stocks are considered riskier than large cap stocks, and value stocks (as defined by a higher book-to-market ratio) are deemed riskier than growth stocks. These higher returns reflect compensation for bearing higher risk.
A multifactor approach incorporates both size and value measures—and exposure to non-US markets—in an effort to increase expected returns and reduce portfolio volatility. An effective way to capture these effects is through portfolio structure.
This slide documents the frequency with which the value and size premiums have been positive over various time periods in the US stock market from 1926 to 2009.
As the results illustrate, US value stocks have outperformed US growth stocks—and US small cap stocks have outperformed US large cap stocks—in a majority of all the rolling return periods measured. The US value premium has been positive more often than the size premium.
The time periods, which range from five to twenty-five years, are based on annualized returns for rolling 12-month periods (e.g., January-December, February-January, March-February, etc.). The total number of 12-month periods for each time frame is indicated in the footnotes.
Talking Points:
Research shows that most of the variation in returns among equity portfolios can be explained by the portfolios’ relative exposure to three compensated risk factors:
• Market factor—Stocks have higher expected returns than fixed income securities.
• Size factor—Small cap stocks have higher expected returns than large cap stocks.
• Book-to-Market (BtM) factor—Lower-priced “value” (high BtM) stocks have higher expected returns than higher-priced “growth” stocks (low BtM).
Structuring a portfolio around compensated risk factors can change priorities in the investment process. The focus shifts from returns chasing (through stock picking or market timing) to diversification across multiple asset classes in a portfolio.
The model in this slide illustrates this multifactor approach. Investors receive an average expected return (above T-bills) according to the relative risks they assume in their portfolios. The main factors driving expected returns are sensitivity to the market, sensitivity to small cap stocks (size factor), and sensitivity to value stocks (as measured by book-to-market ratio). Any additional average expected return in the portfolio may be attributed to unpriced risk.
Average explanatory power (R2) is for the Fama/French equity benchmark universe. R2 describes the goodness of fit of a regression model by indicating the proportion of the total variance of the dependent variable explained by the model.