Risk and Return Factors Drive Long-Term Stock Returns
•Download as PPTX, PDF•
1 like•1,644 views

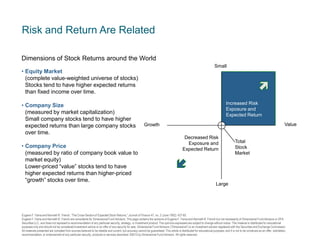
The document discusses three dimensions of expected stock returns: 1) Company size - Small company stocks tend to have higher expected returns than large company stocks over time. 2) Company price - Lower-priced "value" stocks tend to have higher expected returns than higher-priced "growth" stocks over time. 3) Equity market - Stocks tend to have higher expected returns than fixed income investments like bonds over time.

Recommended
More Related Content
What's hot
What's hot (17)
Viewers also liked
Similar to Risk and Return Factors Drive Long-Term Stock Returns
Similar to Risk and Return Factors Drive Long-Term Stock Returns (20)
More from Weydert Wealth Management
More from Weydert Wealth Management (15)
Recently uploaded
Recently uploaded (20)
Risk and Return Factors Drive Long-Term Stock Returns
- 1. Risk and Return Are Related Dimensions of Stock Returns around the World Small • Equity Market (complete value-weighted universe of stocks) Stocks tend to have higher expected returns than fixed income over time. • Company Size (measured by market capitalization) Small company stocks tend to have higher expected returns than large company stocks over time. • Company Price (measured by ratio of company book value to market equity) Lower-priced ―value‖ stocks tend to have higher expected returns than higher-priced ―growth‖ stocks over time. Increased Risk Exposure and Expected Return Value Growth Decreased Risk Exposure and Expected Return Total Stock Market Large Eugene F. Fama and Kenneth R. French, “The Cross-Section of Expected Stock Returns,” Journal of Finance 47, no. 2 (June 1992): 427-65. Eugene F. Fama and Kenneth R. French are consultants for Dimensional Fund Advisors. This page contains the opinions of Eugene F. Fama and Kenneth R. French but not necessarily of Dimensional Fund Advisors or DFA Securities LLC, and does not represent a recommendation of any particular security, strategy, or investment product. The opinions expressed are subject to change without notice. This material is distributed for educational purposes only and should not be considered investment advice or an offer of any security for sale. Dimensional Fund Advisors (“Dimensional”) is an investment advisor registered with the Securities and Exchange Commission. All materials presented are compiled from sources believed to be reliable and current, but accuracy cannot be guaranteed. This article is distributed for educational purposes, and it is not to be construed as an offer, solicitation, recommendation, or endorsement of any particular security, products or services described. ©2012 by Dimensional Fund Advisors. All rights reserved.
- 2. RR1250.2 Precision in Portfolios Traditional Consulting Style Box Three-Factor Model Small Large Mid Growth Value Small Value Blend Growth • Traditionally, ―products‖ have been classified into rigid and sometimes arbitrary categories. • Style boxes force crude strategic allocation. Large • Using the three-factor model, the total portfolio is measured by factors that determine risk and expected return. • Freedom from brittle definitions allows precisely tuned portfolios. 2
- 3. IC1450.7 Integrated Solutions Reduce Turnover • In effect, a component portfolio buys and sells from itself, generating needless costs and taxable events. Russell 3000 Russell 3000 via Components Buys and Sells in Excess of Russell 3000 R1000 3.4% R2000 R1000G R1000V R3000 27.1% R2000G R2000V R200G R200V RMCG RMCV R2000G R2000V Annual: January 1989–December 2012. Russell components are Russell indices weighted according to Russell 3000 market value weights (buys and sells measured by the weight of each component). Estimated annual cost assumes transaction costs of 50 bps. Russell data copyright ©Russell Investment Group 1995-2013, all rights reserved. For illustrative purposes only. 33.5% 3
- 4. RR1255.1 Advancements in Research Single-Factor Model (1963) Market Size Effect (1981) Size Large Small Value Effect (1991) Expected Profitability (2012) Size Large Low Large High Small Low Small Size Direct Profitability High Large Small Low High Relative Price Low High Relative Price 4
- 5. LI1770.5 Annual Index Reconstitution Effects Consistency of Asset Class Exposure Percentage of Assets in Bottom 10% of Market Russell 2000 Index CRSP 6-10 Index June 30 Averages (reconstitution month) 96.30 96.61 May 31 Averages (11 months after reconstitution) 88.42 97.24 • Over time, securities within an index can migrate from one asset class to another (such as from small cap to large cap) • An index’s characteristics may be significantly different 11 months after reconstitution due to security migration. 100% Percentage of Assets in Bottom 10% of Market • An index that purports to represent a certain asset class may not offer thorough, consistent exposure to the underlying risk factors. 95% 90% 85% CRSP 6-10 Index Russell 2000 Index 80% Jan 2004 Jan 2005 Jan 2006 Jan 2007 Jan 2008 Jan 2009 Jan 2010 Jan 2011 Jan 2012 Jan 2013 Month-end values from January 2004-December 2012. Russell data copyright © Russell Investment Group 1995-2013, all rights reserved. CRSP data provided by the Center for Research in Security Prices, University of Chicago. Indices are not available for direct investment. Their performance does not reflect the expenses associated with the management of an actual portfolio. Past performance is not a guarantee of future results. 5
- 6. Structure Determines Performance Structured Exposure to Factors explain 96% of return variation • The vast majority of the variation in returns is due to risk factor exposure. • Market • Size • Value/Growth • After fees, traditional management typically reduces returns. Unexplained Variation is 4% THE MODEL TELLS THE DIFFERENCE BETWEEN INVESTING AND SPECULATING THE MODEL TELLS THE DIFFERENCE BETWEEN INVESTING AND SPECULATING average expected return = [minus T-bills] average excess return + sensitivity to market [market return minus T-bills] + sensitivity to size + [small stocks minus big stocks] Priced Risk • Positive expected return • Systematic • Economic • Long-term • Investing sensitivity to BtM [value stocks minus growth] + random error e(t) Unpriced Risk • Noise • Random • Short-term • Speculating
- 7. RR1210.2 Capital Asset Pricing Model William Sharpe: Nobel Prize in Economics, 1990 Total Equity Risk Unsystematic Company Risk • Specific to firm or industry (lawsuit, fraud, etc.) • Diversifiable Unsystematic • No compensation Industry Risk Systematic Market Risk Systematic • Marketwide, affects all firms (war, recession, inflation, etc.) • Non-diversifiable • Investor compensation • Measured by beta Beta measures volatility relative to the total market. A beta higher than the market’s beta of 1 implies more volatility, and a beta lower than the market’s implies less volatility. 7
- 8. Dimensions of Higher Expected Returns Annual Average US Premiums: 1927–2012 8.05% 4.80% 3.58% 2.52% 0.85% 1 Market Premium 2 Size Premium 3 BtM Premium All Equity Universe minus T-Bills Small Stocks minus Large Stocks 4 High BtM minus Low BtM 1. Credit premium data (1973–2012) provided by Barclays Bank PLC. Indices are not available for direct investment. Their performance does not reflect the expenses associated with the management of an actual portfolio. Equity premiums provided by Fama/French. Maturity premium data provided by © Stocks, Bonds, Bills, and Inflation Yearbook©, Ibbotson Associates, Chicago (annually updated work by Roger G. Ibbotson and Rex A. Sinquefield). 5 Maturity Premium 6 Credit1 Premium LT Govt. minus T-Bills Int. Corp. minus LT Govt.
- 9. RR1221.5 Historical US Value and Small Cap Premiums Annual VALUE MINUS GROWTH Top 30% – Bottom 30% Average Premium (%) Standard Deviation (%) SMALL MINUS LARGE Bottom 50% – Top 50% Average Premium (%) Standard Deviation (%) Jan 1926–Dec 2012 4.77 16.60 4.53 16.08 Jan 1946–Dec 2012 4.56 13.83 3.04 13.67 Jan 1975–Dec 2012 3.55 14.53 3.35 12.83 Data provided by Fama/French. 9
- 10. RR1271.5 The Risk Dimensions Delivered July 1926–December 2012 US Value vs. US Growth US Small vs. US Large OVERLAPPING PERIODS In 25-Year Periods Value beat growth 100% of the time. Small beat large 97% of the time. In 20-Year Periods Value beat growth 100% of the time. Small beat large 88% of the time. In 15-Year Periods Value beat growth 99% of the time. 95% Small beat large 82% of the time. In 10-Year Periods Value beat growth 96% of the time. 91% Small beat large 75% of the time. In 5-Year Periods Value beat growth 86% of the time. 80% Small beat large 60% of the time. Periods based on rolling annualized returns. 739 total 25-year periods. 799 total 20-year periods. 859 total 15-year periods. 919 total 10-year periods. 979 total 5-year periods. Performance based on Fama/French Research Factors. Securities of small companies are often less liquid than those of large companies. As a result, small company stocks may fluctuate relatively more in price. Mutual funds distributed by DFA Securities LLC.
- 11. RR1271.5 The Risk Dimensions Delivered January 1975–December 2012 January 1970–December 2012 International Value vs. International Growth International Small vs. International Large OVERLAPPING PERIODS In 25-Year Periods Value beat growth 100% of the time. Small beat large 100% of the time. In 20-Year Periods Value beat growth 100% of the time. Small beat large 97% of the time. In 15-Year Periods Value beat growth 100% of the time. Small beat large 83% of the time. In 10-Year Periods Value beat growth 100% of the time. Small beat large 80% of the time. In 5-Year Periods 96% Value beat growth 98% of the time. Small beat large 79% of the time. Based on rolling annualized returns. Rolling multi-year periods overlap and are not independent. This statistical dependence must be considered when assessing the reliability of long-horizon return differences. International Value vs. International Growth data: 157 overlapping 25-year periods. 217 overlapping 20-year periods. 277 overlapping 15-year periods. 337 overlapping 10-year periods. 397 overlapping 5-year periods. International Small vs. International Large data: 217 overlapping 25-year periods. 277 overlapping 20-year periods. 337 overlapping 15-year periods. 397 overlapping 10-year periods. 457 overlapping 5-year periods. International Value and Growth data provided by Fama/French from Bloomberg and MSCI securities data. International Small data compiled by Dimensional from Bloomberg, StyleResearch, London Business School, and Nomura Securities data. International Large is MSCI World ex USA Index gross of foreign withholding taxes on dividends; copyright MSCI 2013, all rights reserved.
- 12. LT1330.9 Performance of the S&P 500 Index Daily: January 1, 1970-December 31, 2012 $58,769 Growth of $1,000 $52,702 $38,212 $22,191 $13,999 $9,195 Total Period Annualized Compound Return 9.94% Missed 1 Best Day 9.66% Missed 5 Best Single Days 8.84% Missed 15 Best Single Days 7.47% Missed 25 Best Single Days 6.33% One-Month US T-Bills 5.30% Performance data for January 1970-August 2008 provided by CRSP; performance data for September 2008-December 2012 provided by Bloomberg. The S&P data are provided by Standard & Poor’s Index Services Group. US bonds and bills data © Stocks, Bonds, Bills, and Inflation Yearbook™, Ibbotson Associates, Chicago (annually updated work by Roger G. Ibbotson and Rex A. Sinquefield). Indexes are not available for direct investment. Their performance does not reflect the expenses associated with the management of an actual portfolio. Dimensional Fund Advisors is an investment advisor registered with the Securities and Exchange Commission. Information contained herein is compiled from sources believed to be reliable and current, but accuracy should be placed in the context of underlying assumptions. This publication is distributed for educational purposes and should not be considered investment advice or an offer of any security for sale. Past performance is not a guarantee of future results. Unauthorized copying, reproducing, duplicating, or transmitting of this material is prohibited. Date of first use: June 1, 2006. 12
- 13. LT1394.3 Perils of Market Timing A Case Study of Q1 2009 • March 9 was the low closing date for four of the five featured indices year-to-date. • The Dow Jones Industrial Average rose 5.8% on March 10, 2009. 43.8% • Looking at daily returns, it’s difficult to tell if a recovery is occurring. Positive Return Period 3/10-3/31 23.4% Q1 2009 Returns 1/1-3/31 Negative Return Period 1/1-3/9 16.4% 18.1% 20.5% Return excluding March 10, 2009 -2.7% -12.4% -11.0% -14.9% Dow Jones Industrial Average -19.3% S&P 500 Index -24.7% -24.6% Russell 2000 Index -31.0% Nasdaq Composite Index -35.8% KBW Bank Index -55.3% Returns are from market-close to market-close. Indices are not available for direct investment; their performance does not reflect the expenses associated with the management of an actual portfolio. The S&P data are provided by Standard & Poor’s Index Services Group. Dow Jones data provided by Dow Jones Indexes. Russell data copyright © Russell Investment Group 1995-2010 all rights reserved. Mutual fund universe statistical data and nonDimensional money managers’ fund data provided by Morningstar, Inc. Nasdaq Composite Index data provided by The Nasdaq Stock Market, Inc. KBW Bank Index data provided by Keefe, Bruyette & Woods, Inc. (KBW). Past performance is not a guarantee of future results. 13
- 14. LT1395.5 Missing Opportunity • Strong performance among a few stocks accounts for much of the market’s return each year. • There is no evidence that managers can identify these stocks in advance—and attempting to pick them may result in missed opportunity. Compound Average Annual Returns: 1926-2012 All US Stocks Excluding the Top 10% of Performers Each Year Excluding the Top 25% of Performers Each Year 9.6% • Investors should diversify broadly and stay fully invested to capture expected returns. 6.3% -0.6% Results based on the CRSP 1-10 Index. CRSP data provided by the Center for Research in Security Prices, University of Chicago.
Editor's Notes
- Exposure to three equity risk factors and two fixed income risk factors accounts for most of a diversified portfolio's expected return. The three equity risk factors are: Market—stocks have higher expected returns than fixed income securities.Size—small cap stocks have higher expected returns than large cap stocks.Book-to-Market (BtM)—lower-priced “value” (high BtM) stocks have higher expected returns than higher-priced “growth” stocks (low BtM). Two additional risk factors reflect compensated risk in the fixed income markets. These are: Maturity—longer-term bonds are riskier than shorter-term instruments.Credit—instruments of lower credit quality are riskier than instruments of higher credit quality. The credit premium only covers 1973-2012.The historical return premiums for these risk factors are documented in the graph. Equities have offered a higher expected return than fixed income, but these stronger premiums come with higher risk. Structuring a portfolio around compensated risk factors can change many aspects of the investment process. Rather than focusing on individual stock or bond selection, investors work to achieve diversified, controlled exposure to the risk factors that drive expected returns. An investor first determines his portfolio’s stock/bond mix, and then decides how much additional small cap and value to hold in pursuit of higher expected returns. The level of risk assumed in the fixed income component may depend on why an investor is holding fixed income. For example, an equity-driven investor who wants to reduce portfolio volatility may hold less risky debt instruments, while an investor pursuing higher yield or income may take more maturity and default risk.
- This slide documents the frequency with which the value and size premiums have been positive over various time periods in the US stock market from 1926 to 2012. As the results illustrate, US value stocks have outperformed US growth stocks—and US small cap stocks have outperformed US large cap stocks—in a majority of all the rolling return periods measured. The US value premium has been positive more often than the size premium. The time periods, which range from five to twenty-five years, are based on annualized returns for rolling 12-month periods (e.g., January-December, February-January, March-February, etc.). The total number of 12-month periods for each time frame is indicated in the footnotes.
- This slide documents the frequency with which the value premium, from 1975-2012, and the size premium, from 1970-2012, have been positive over various time periods in the international (non-US) developed stock markets. In the international markets, value stocks have outperformed growth stocks—and small cap stocks have outperformed large cap stocks—in a majority of all rolling return periods measured. The value premium has been strongly positive more often than the size premium. The time periods, which range from five to twenty-five years, are based on annualized returns for rolling 12-month periods (e.g., January-December, February-January, March-February, etc.). The total number of 12-month periods for each time frame is indicated in the footnotes. The set of available data for non-US developed markets is considerably shorter than US markets. As a result, the smaller set of observations can amplify the effect of sustained periods of negative or positive premiums. This may explain part of the frequency difference between the 20-year and 15-year periods for the international small cap premium.
- The harsh reality of market efficiency has not stopped speculators and other traders from attempting to read the future. On paper, market timing offers a seductive prospect: By predicting market direction ahead of time, a trader might capture only the best-performing days and avoid the worst. This slide tells the other side of that story. Large gains may come in quick, unpredictable surges. A trader who misinterprets events may leave the market at the wrong time. Missing only a small fraction of days—especially the best days—can defeat a timer’s strategy.For example, since 1970, missing the best 25 trading days would have significantly cut S&P 500 Index annualized compound return.Trying to forecast which days or weeks will yield good or bad returns is a guessing game that can prove costly for investors.
- Talking Points:This graph shows that a few outperforming stocks may account for a disproportionately large share of the US market’s return in a given year. From 1926 to 2012, the US stock market, as measured by the CRSP 1-10 Index, provided a 9.6% compound average annual return. If the top-performing decile of stocks were excluded each year, the market’s return would drop to 6.3% annualized. Excluding the top quartile of performers each year would reduce the market’s average annual return to a negative 0.6%. Since it is impossible to reliably identify winners before the fact, the most prudent approach is to maintain broad diversification and consistent exposure within a particular asset class. This improves the likelihood that a portfolio will capture outperformance—wherever it may occur.