1. CP1920.8
A Fully Diversified Portfolio
Quarterly: 1973-2011
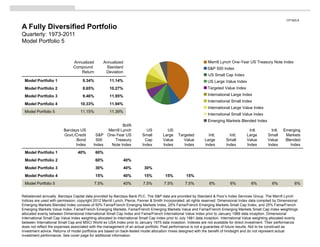
Model Portfolio 5
Annualized Annualized Merrill Lynch One-Year US Treasury Note Index
Compound Standard S&P 500 Index
Return Deviation
US Small Cap Index
Model Portfolio 1 9.34% 11.14% US Large Value Index
Model Portfolio 2 8.65% 10.27% Targeted Value Index
Model Portfolio 3 9.46% 11.95% International Large Index
International Small Index
Model Portfolio 4 10.33% 11.94%
International Large Value Index
Model Portfolio 5 11.15% 11.39%
International Small Value Index
Emerging Markets Blended Index
BofA
Barclays US Merrill Lynch US US Intl. Intl. Emerging
Govt./Credit S&P One-Year US Small Large Targeted Intl. Intl. Large Small Markets
Bond 500 Treasury Cap Value Value Large Small Value Value Blended
Index Index Note Index Index Index Index Index Index Index Index Index
Model Portfolio 1 40% 60%
Model Portfolio 2 60% 40%
Model Portfolio 3 30% 40% 30%
Model Portfolio 4 15% 40% 15% 15% 15%
Model Portfolio 5 7.5% 40% 7.5% 7.5% 7.5% 6% 6% 6% 6% 6%
Rebalanced annually. Barclays Capital data provided by Barclays Bank PLC. The S&P data are provided by Standard & Poor’s Index Services Group. The Merrill Lynch
Indices are used with permission; copyright 2012 Merrill Lynch, Pierce, Fenner & Smith Incorporated; all rights reserved. Dimensional Index data compiled by Dimensional.
Emerging Markets Blended Index consists of 50% Fama/French Emerging Markets Index, 25% Fama/French Emerging Markets Small Cap Index, and 25% Fama/French
Emerging Markets Value Index. Fama/French Emerging Markets, Fama/French Emerging Markets Value and Fama/French Emerging Markets Small Cap Index weightings
allocated evenly between Dimensional International Small Cap Index and Fama/French International Value Index prior to January 1989 data inception. Dimensional
International Small Cap Value Index weighting allocated to International Small Cap Index prior to July 1981 data inception. International Value weighting allocated evenly
between International Small Cap and MSCI World ex USA Index prior to January 1975 data inception. Indexes are not available for direct investment. Their performance
does not reflect the expenses associated with the management of an actual portfolio. Past performance is not a guarantee of future results. Not to be construed as
investment advice. Returns of model portfolios are based on back-tested model allocation mixes designed with the benefit of hindsight and do not represent actual
investment performance. See cover page for additional information.
2. RR1220.9
Size and Value Effects Are Strong around the World
Annual Index Data
Annualized
Compound
Returns (%)
US US US US Emg. Emg. Emg. Emg.
Large S&P Large Small CRSP Small Intl. Intl. MSCI Intl. Markets Markets Markets Markets
Value 500 Growth Value 6-10 Growth Value Small EAFE Growth Value Small “Market” Growth
US Large US Small Non-US Developed Emerging
Capitalization Stocks Capitalization Stocks Markets Stocks Markets Stocks
1927–2011 1927–2011 1975–2011 1989–2011
Average Return (%) 13.63 11.77 11.29 18.82 15.72 13.74 17.44 18.23 12.98 10.74 22.86 20.00 17.77 15.63
Standard Deviation (%) 27.10 20.41 21.81 35.07 30.84 33.90 24.81 28.32 22.37 22.07 42.31 40.86 36.47 34.77
In US dollars. Indices are not available for direct investment. Their performance does not reflect the expenses associated with the management of an actual portfolio. Past
performance is not a guarantee of future results. US value and growth index data (ex utilities) provided by Fama/French. The S&P data are provided by Standard & Poor’s
Index Services Group. CRSP data provided by the Center for Research in Security Prices, University of Chicago. International Value data provided by Fama/French from
Bloomberg and MSCI securities data. International Small data compiled by Dimensional from Bloomberg, StyleResearch, London Business School, and Nomura Securities
data. MSCI EAFE Index is net of foreign withholding taxes on dividends; copyright MSCI 2012, all rights reserved. Emerging markets index data simulated by Fama/French
from countries in the IFC Investable Universe; simulations are free-float weighted both within each country and across all countries.
Indexes are not available for direct investment. Their performance does not reflect the expenses associated with the management of an actual portfolio.
Past performance is not a guarantee of future results. Values change frequently and past performance may not be repeated. There is always the risk that an investor may
lose money. Small company risk: Securities of small firms are often less liquid than those of large companies. As a result, small company stocks may fluctuate relatively
more in price. Emerging markets risk: Numerous emerging countries have experienced serious, and potentially continuing, economic and political problems. Stock markets
in many emerging countries are relatively small, expensive, and risky. Foreigners are often limited in their ability to invest in, and withdraw assets from, these markets.
Additional restrictions may be imposed under other conditions. Foreign securities and currencies risk: Foreign securities prices may decline or fluctuate because of: (a)
economic or political actions of foreign governments, and/or (b) less regulated or liquid securities markets. Investors holding these securities are also exposed to foreign
currency risk (the possibility that foreign currency will fluctuate in value against the US dollar).
3. RR1260.4
Structure Determines Performance
Structured Exposure
to Factors.
• The vast majority of the variation in returns is
• Market.
due to risk factor exposure. • Size.
• Value/Growth.
• After fees, traditional management typically
reduces returns.
Unexplained Variation
THE MODEL TELLS THE DIFFERENCE BETWEEN INVESTING AND SPECULATING
average average sensitivity sensitivity sensitivity random
expected return = excess + to market + to size + to BtM + error
return e(t)
[minus T-bills] [market return [small stocks [value stocks
minus T-bills] minus big minus
stocks] growth]
Priced Risk Unpriced Risk
• Positive expected return. • Noise.
• Systematic. • Random.
• Economic. • Short-term.
• Long-term. • Speculating.
• Investing.
5. RR1271.5
The Risk Dimensions Delivered
July1926–December 2011
US Value vs. US Growth US Small vs. US Large
O V E R L A P P IN G
P E R IO D S
Value beat growth 100% of the time.
Value beat growth 100% of the time. Small beat large 96% of the time.
Small beat large 97% of the time.
Value beat growth 100% of the time.
Value beat growth 100% of the time. Small beat large 83% of the time.
Small beat large 88% of the time.
Value beat growth 99% of the time.
Value beat growth 95% of the time. Small beat large 78% of the time.
Small beat large 82% of the time.
Value beat growth 91% of the time.
Value beat growth 96% of the time. Small beat large 68% of the time.
Small beat large 75% of the time.
Value beat growth 81% of the time.
Value beat growth 86% of the time. Small beat large 59% of the time.
Small beat large 60% of the time.
Periods based on rolling annualized returns. 727 total 25-year periods. 787 total 20-year periods.
847 total 15-year periods. 895 total 10-year periods. 967 total 5-year periods.
Performance based on Fama/French Research Factors. Securities of small companies are often less liquid than those of large companies.
As a result, small company stocks may fluctuate relatively more in price. Mutual funds distributed by DFA Securities LLC.
6. RR1271.5
The Risk Dimensions Delivered
January 1975–December 2011 January 1970–December 2011
International Value vs. International International Small vs. International Large
O V E R L A P P IN G Growth
P E R IO D S
Value beat growth 100% of the time.
Value beat growth 100% of the time. Small beat large 100% of the time.
Small beat large 100% of the time.
Value beat growth 100% of the time.
Value beat growth 100% of the time. Small beat large 100% of the time.
Small beat large 97%
Value beat growth 100% of the time.
Value beat growth 100% of the time. Small beat large 83% of the time.
Small beat large 84% of the time.
Value beat growth 100% of the time.
Value beat growth 100% of the time. Small beat large 76% of the time.
Small beat large 79% of the time.
Value beat growth 98% of the time.
Value beat growth 98% of the time. Small beat large 75% of the time.
Small beat large 79% of the time.
Based on rolling annualized returns. Rolling multi-year periods overlap and are not independent. This statistical dependence must be considered when
assessing the reliability of long-horizon return differences.
International Value vs. International Growth data: 145 overlapping 25-year periods. 205 overlapping 20-year periods. 265 overlapping 15-year periods. 325
overlapping 10-year periods. 385 overlapping 5-year periods. International Small vs. International Large data: 205 overlapping 25-year periods. 265
overlapping 20-year periods. 325 overlapping 15-year periods. 385 overlapping 10-year periods. 445 overlapping 5-year periods. International Value and
Growth data provided by Fama/French from Bloomberg and MSCI securities data. International Small data compiled by Dimensional from Bloomberg,
StyleResearch, London Business School, and Nomura Securities data. International Large is MSCI World ex USA Index gross of foreign withholding taxes
on dividends; copyright MSCI 2012, all rights reserved.
8. IC1420.5
Mutual Fund Expenses
“After costs, the return on the average actively managed dollar will be less than the return on the
average passively managed dollar for any time period.”
—William F. Sharpe, 1990 Nobel Laureate
Domestic Mutual Fund Expense Ratios International Mutual Fund Expense Ratios
Average of Weighted Average, Average of Weighted Average, Average of Weighted Average, Average of Weighted Average,
All Funds Based on Fund Assets All Funds Based on Fund Assets All Funds Based on Fund Assets All Funds Based on Fund Assets
Active Passive Active Passive
William F. Sharpe, “The Arithmetic of Active Management,” Financial Analysts Journal 47, no. 1 (January/February 1991): 7-9.
Mutual fund expense ratios as of April 9, 2010. Asset weighting based on net assets as of December 31, 2008. Data provided by Morningstar, Inc.
Passive funds are those coded by Morningstar as Index Funds.
9. IT1610.2
Innovations in Finance
Conventional Wisdom circa 1950 Efficient Markets Hypothesis
“Once you attain competency, Single-Factor Asset Pricing Risk/ Eugene F. Fama,
diversification is undesirable. One or University of Chicago
Return Model
two, or at most three or four, securities The Role of Stocks
should be bought. Competent William Sharpe Extensive research on stock price
investors will never be satisfied James Tobin Nobel Prize in Economics, 1990 patterns.
beating the averages by a few small Nobel Prize in Economics, 1981
percentage points.” Capital Asset Pricing Model: Develops Efficient Markets Hypothesis,
Separation Theorem: Theoretical model defines risk as which asserts that prices reflect values
Gerald M. Loeb, The Battle for Investment 1. Form portfolio of risky assets. volatility relative to market. and information accurately and quickly.
Survival, 1935 2. Temper risk by lending and It is difficult if not impossible to capture
borrowing. A stock’s cost of capital (the investor’s returns in excess of market returns The Birth of Index Funds
Analyze securities one by one. Focus expected return) is proportional to the without taking greater than market John McQuown,
on picking winners. Concentrate Shifts focus from security selection to stock’s risk relative to the entire stock levels of risk. Wells Fargo Bank, 1971;
holdings to maximize returns. portfolio structure. universe. Rex Sinquefield,
Investors cannot identify superior American National Bank, 1973
Broad diversification is considered “Liquidity Preference as Behavior Theoretical model for evaluating the stocks using fundamental information
undesirable. Toward Risk,” Review of Economic risk and expected return of securities or price patterns. Banks develop the first passive S&P
Studies, February 1958. and portfolios. 500 Index funds.
1950 1951 1952 1953 1954 1955 1956 1957 1958 1959 1960 1961 1962 1963 1964 1965 1966 1967 1968 1969 1970 1971 1972 1973 1974
Diversification and Portfolio Risk Investments and Capital Behavior of Securities Prices First Major Study of Manager Options Pricing Model
Harry Markowitz Structure Paul Samuelson, MIT Performance Fischer Black,
Nobel Prize in Economics, 1990 Merton Miller and Franco Modigliani Nobel Prize in Economics, 1970 Michael Jensen, 1965 University of Chicago;
Nobel Prizes in Economics, A.G. Becker Corporation, 1968 Myron Scholes,
Diversification reduces risk. 1990 and 1985 Market prices are the best estimates of University of Chicago;
value. First studies of mutual funds (Jensen) Robert Merton,
Assets evaluated not by individual Theorem relating corporate finance to and of institutional plans (A.G. Becker Harvard University
characteristics but by their effect on a returns. Price changes follow random patterns. Corp.) indicate active managers Nobel Prize in Economics, 1997
portfolio. An optimal portfolio can be Future share prices are unpredictable. underperform indices.
constructed to maximize return for a given A firm’s value is unrelated to its The development of the Options
standard deviation. dividend policy. “Proof That Properly Anticipated Becker Corp. gives rise to consulting Pricing Model allows new ways to
Prices Fluctuate Randomly,” Industrial industry with creation of “Green Book” segment, quantify, and manage risk.
Dividend policy is an unreliable guide Management Review, Spring 1965. performance tables comparing results
for stock selection. to benchmarks. The model spurs the development of a
market for alternative investments.
10. IT1610.2
Innovations in Finance
Multifactor Asset Pricing Model
and Value Effect
A Major Plan First Eugene Fama and Integrated Equity
Commits to Indexing Kenneth French,
University of Chicago Eugene F. Fama and
New York Telephone Company Kenneth R. French
invests $40 million in an S&P 500 Improves on the single-factor asset
Index fund. pricing model (CAPM). International Size Effect Increasing exposure to small and
value companies relative to their
The first major plan to index. The Size Effect Identifies market, size, and “value” Steven L. Heston, K. Geert market weights and integrating the
factors in returns. Rouwenhorst, and Roberto E. Wessels portfolio across the full range of
Helps launch the era of indexed Rolf Banz, University of Chicago securities may reduce the turnover
investing. Develops the three-factor asset pricing Find evidence of higher average and transaction costs normally
Analyzed NYSE stocks, model, an invaluable asset allocation returns to small companies in twelve associated with forming an asset
“Fund spokesmen are quick to point 1926-1975. and portfolio analysis tool. international markets. allocation from multiple components.
out you can’t buy the market averages.
It’s time the public could.” Finds that, in the long term, small “Common Risk Factors in the Returns “The Structure of International Stock “Migration,” CRSP Working Paper No.
companies have higher expected on Stocks and Bonds,” Journal of Returns and the Integration of Capital 614, Center for Research in Security
Burton G. Malkiel, A Random Walk returns than large companies and Financial Economics 33, no. 1 Markets,” Journal of Empirical Finance Prices, University of Chicago,
Down Wall Street, 1973 ed. behave differently. (February 1993): 3-56. 2, no. 3 (September 1995): 173-97. February 2007.
1975 1976 1977 1978 1979 1980 1981 1982 1983 1984 1985 1986 1987 1988 1989 1990 1991 1992 1993 1994 1995 1996 1997 1998 1999 2000 2001 2002 2003 2004 2005 2006
Database of Securities Prices Variable Maturity Strategy Nobel Prize Recognizes Modern
since 1926 Implemented Finance
Roger Ibbotson and Eugene F. Fama Economists who shaped the way we
Rex Sinquefield, invest are recognized, emphasizing
Stocks, Bonds, Bills, and Inflation With no prediction of interest rates, the role of science in finance.
Eugene Fama develops a method of
An extensive returns database for shifting maturities that identifies William Sharpe for the Capital Asset
multiple asset classes is first optimal positions on the fixed income Pricing Model.
developed and will become one of the yield curve.
most widely used investment Harry Markowitz for portfolio theory.
databases. “The Information in the Term
Structure,” Journal of Financial Merton Miller for work on the effect of
The first extensive, empirical basis for Economics 13, no. 4 (December firms’ capital structure and dividend
making asset allocation decisions 1984): 509-28. policy on their prices.
changes the way investors build
portfolios.
12. CP2000.6
MSCI Disclosure
Copyright MSCI 2012. Unpublished. All rights reserved. This information may only be used for your internal
use, may not be reproduced or redisseminated in any form and may not be used to create any financial
instruments or products or any indices. This information is provided on an “as is” basis and the user of this
information assumes the entire risk of any use it may make or permit to be made of this information. Neither
MSCI, any of its affiliates, nor any other person involved in or related to compiling, computing or creating this
information makes any express or implied warranties or representations with respect to such information or
the results to be obtained by the use thereof, and MSCI, its affiliates, and each such other person hereby
expressly disclaims all warranties (including, without limitation, all warranties of originality, accuracy,
completeness, timeliness, non-infringement, merchantability and fitness for a particular purpose) with respect
to this information. Without limiting any of the foregoing, in no event shall MSCI, any of its affiliates or any
other person involved in or related to compiling, computing, or creating this information have any liability for
any direct, indirect, special, incidental, punitive, consequential, or any other damages (including, without
limitation, lost profits) even if notified of, or if it might otherwise have anticipated, the possibility of such
damages.
Editor's Notes
Talking Points: Model Portfolio 5 completes this multifactor construction by diversifying outside the US. All four US asset classes are reduced by half, from 15% to 7.5% allocations, and the balance is apportioned equally to five non-US asset classes—international large, small, large value, and small value indexes, and emerging markets blended index. The portfolio’s 60% equity allocation is now evenly split between the US and international markets, with roughly equal exposures to size and BtM. The historical data for the performance period shows Model Portfolio 5 producing the highest annualized compound return of all the portfolios, without an increase in volatility. In fact, adding the global component reduces the variability in the portfolio’s return due to the lower correlation of international and US risk dimensions. Compared to the original 60/40 balanced strategy, Model Portfolio 5 offers higher annualized return with only slightly higher volatility. A globally diversified allocation harnesses the power of markets, manages the risk-return tradeoff, provides broad diversification, and offers calculated exposure to compensating risk factors through structured investing.
Talking Points: The size and BtM effects appear in both US and international markets—strong evidence that the risk factors are systematic across the globe. This graph demonstrates the higher expected returns offered by small cap stocks and value (high-BtM) stocks in the US, non-US developed, and emerging markets. Note that the international and emerging markets data is for a shorter time frame. Small cap stocks are considered riskier than large cap stocks, and value stocks (as defined by a higher book-to-market ratio) are deemed riskier than growth stocks. These higher returns reflect compensation for bearing higher risk. A multifactor approach incorporates both size and value measures—and exposure to non-US markets—in an effort to increase expected returns and reduce portfolio volatility. An effective way to capture these effects is through portfolio structure.
Talking Points: Research shows that most of the variation in returns among equity portfolios can be explained by the portfolios’ relative exposure to three compensated risk factors: • Market factor—Stocks have higher expected returns than fixed income securities. • Size factor—Small cap stocks have higher expected returns than large cap stocks. • Book-to-Market (BtM) factor—Lower-priced “value” (high BtM) stocks have higher expected returns than higher-priced “growth” stocks (low BtM). Structuring a portfolio around compensated risk factors can change priorities in the investment process. The focus shifts from returns chasing (through stock picking or market timing) to diversification across multiple asset classes in a portfolio. The model in this slide illustrates this multifactor approach. Investors receive an average expected return (above T-bills) according to the relative risks they assume in their portfolios. The main factors driving expected returns are sensitivity to the market, sensitivity to small cap stocks (size factor), and sensitivity to value stocks (as measured by book-to-market ratio). Any additional average expected return in the portfolio may be attributed to unpriced risk. Average explanatory power (R 2 ) is for the Fama/French equity benchmark universe. R 2 describes the goodness of fit of a regression model by indicating the proportion of the total variance of the dependent variable explained by the model.
Academic research has identified five risk dimensions that explain most of the relative performance between portfolios. The three equity risk factors are: Market—stocks have higher expected returns than fixed income securities. Size—small cap stocks have higher expected returns than large cap stocks. Book-to-Market (BtM)—lower-priced “value” (high BtM) stocks have higher expected returns than higher-priced “growth” stocks (low BtM). Two additional factors reflect compensated risk in the fixed income markets. These are: Maturity—longer-term bonds are riskier than shorter-term instruments. Credit—instruments of lower credit quality are riskier than instruments of higher credit quality. The credit factor for 1927–2011 as an annual arithmetic average of 0.63%, composed of the following data series: a. 1927–1972: Ibbotson Long-Term Corporate Bonds minus Ibbotson Long-Term Government Bonds; b. 1973–present: Barclays Capital US Long Credit Baa Index minus Barclays Capital Long US Government Bond Index. Term/Maturity factor for 1927–2011, it was an annual arithmetic average of 2.51%. Data series used are: a. 1927–present: Ibbotson Long-Term Government Bonds minus Ibbotson One-Month US Treasury Bills. The historical return premiums for these risk factors are documented in the graph. Equities have offered a higher expected return than fixed income, but these stronger premiums come with higher risk. Structuring a portfolio around compensated risk factors can change many aspects of the investment process. Rather than focusing on individual stock or bond selection, investors work to achieve diversified, controlled exposure to the risk factors that drive expected returns. An investor first determines his portfolio’s stock/bond mix, and then decides how much additional small cap and value to hold in pursuit of higher expected returns. The level of risk assumed in the fixed income component may depend on why an investor is holding fixed income. For example, an equity-driven investor who wants to reduce portfolio volatility may hold less risky debt instruments, while an investor pursuing higher yield or income may take more maturity and default risk.
This slide documents the frequency with which the value and size premiums have been positive over various time periods in the US stock market from 1926 to 2011. As the results illustrate, US value stocks have outperformed US growth stocks—and US small cap stocks have outperformed US large cap stocks—in a majority of all the rolling return periods measured. The US value premium has been positive more often than the size premium. The time periods, which range from five to twenty-five years, are based on annualized returns for rolling 12-month periods (e.g., January-December, February-January, March-February, etc.). The total number of 12-month periods for each time frame is indicated in the footnotes.
This slide documents the frequency with which the value premium, from 1975-2011, and the size premium, from 1970-2011, have been positive over various time periods in the international (non-US) developed stock markets. In the international markets, value stocks have outperformed growth stocks—and small cap stocks have outperformed large cap stocks—in a majority of all rolling return periods measured. The value premium has been strongly positive more often than the size premium. The time periods, which range from five to twenty-five years, are based on annualized returns for rolling 12-month periods (e.g., January-December, February-January, March-February, etc.). The total number of 12-month periods for each time frame is indicated in the footnotes. The set of available data for non-US developed markets is considerably shorter than US markets. As a result, the smaller set of observations can amplify the effect of sustained periods of negative or positive premiums. This may explain part of the frequency difference between the 20-year and 15-year periods for the international small cap premium.
Talking Points: The difference in returns among portfolios is largely determined by relative exposure to the market, small cap stocks, and value stocks. Stocks offer higher expected returns than fixed income due to the higher perceived risk of being in the market. Many economists further believe that small cap and value stocks outperform large cap and growth because the market rationally discounts their prices to reflect underlying risk. The lower prices give investors greater upside as compensation for bearing this risk. Investors who want to earn above-market returns must take higher risks in their portfolio. The cross-hair map illustrates that tilting a portfolio toward small cap and value stocks increases the exposure to risk and expected return. Decreasing this exposure relative to the market results in lower risk and lower expected return.
Talking Points: In both US and non-US strategies, the average actively managed mutual fund is considerably more expensive than the average passively managed fund. The graph compares average expense ratios of actively managed funds to those of passive funds. The ratios are presented as simple averages and weighted averages. The weighted average calculation indicates that larger funds tend to have lower expenses than smaller funds. Active managers, on average, charge more than twice the fees of passive managers. This is also true in the international fund universe, although the differences are not as large due to the higher costs of investing in non-US markets. Nobel laureate William Sharpe has pointed out that active management in aggregate must underperform passive management, not due to controversial financial theories but by the simple laws of arithmetic.
Talking Points: Financial science is a relatively young academic field. But the theories, research, and applications have significantly influenced investment methodology over the last half-century. This timeline offers some of the high points in the evolution of modern finance. Prior to 1950, conventional investment managers shunned diversification in favor of securities analysis and concentrated stock picking. In 1952, Harry Markowitz introduced the modern investment age with his landmark work on building optimal portfolios using diversification and mean-variance analysis. The following two decades brought major developments in asset pricing and market efficiency.
Talking Points: The rise of computing power and stock return databases gave academics the tools to empirically test their theories and develop more advanced models to explain securities behavior. Since the 1970s, this research has led to the introduction of advanced forms of passive investing, while casting increasing doubt on the value of active management. More recently, advanced quantitative methods have given rise to the multifactor approach in portfolio construction, and integrated equity.
Talking Points: Relative performance in fixed income is largely driven by two dimensions: bond maturity and credit quality. Bonds that mature farther in the future are subject to the risk of unexpected changes in interest rates. Bonds with lower credit quality are subject to the risk of default. Extending bond maturities and reducing credit quality increases potential returns, although these returns come with higher volatility, as measured by standard deviation. By understanding the dimensions of risk in the bond market, investors may better determine their risk/return profile and estimate the total risk exposure necessary to pursue their expected return goals. Investors seeking the greater expected returns of stocks may choose to focus on equities and keep their bond portfolio short and high in quality. Investors who prefer the lower risk of fixed income can still target higher expected returns by holding bonds with slightly longer maturities and slightly lower credit quality.
This slide must be included in all presentations with slides that contain MSCI data. The disclosure indicates that MSCI data may only be used internally and cannot be distributed; however that message is meant for individual investors. Under a special agreement with MSCI, advisors may redistribute the data provided in these slides. The agreement only covers these slides.