SlideShare a Scribd company logo
DISCLOSURES
Exhibit 1: In US dollars. Source: World Federation of Exchanges members, affiliates, correspondents, and non-members. Trade
data from the global electronic order book. Daily averages were computed using year-to-date totals as of December 31, 2016,
divided by 250 as an approximate number of annual trading days.
Exhibit 2: The sample includes funds at the beginning of the 15-year period ending December 31, 2016. Each fund is evaluated
relative to the Morningstar benchmark assigned to the fund’s category at the start of the evaluation period. Surviving funds are
those with return observations for every month of the sample period. Winner funds are those that survived and whose cumulative
net return over the period exceeded that of their respective Morningstar category benchmark.
Exhibit 3: At the end of each year, funds are sorted within their category based on their five-year total return. Funds in the top quartile
(25%) of returns are evaluated again in the following year based on one-year performance in order to determine the percentage
of funds that maintained a top-quartile ranking. The analysis is repeated each year from 2007–2016. The chart shows average
persistence of top-quartile funds during the 10-year period.
Source (Exhibits 2 and 3): US-domiciled open-end mutual fund data is from Morningstar and Center for Research in Security Prices
(CRSP) from the University of Chicago. Index funds and fund-of-funds are excluded from the sample. Equity fund sample includes the
Morningstar historical categories: Diversified Emerging Markets, Europe Stock, Foreign Large Blend, Foreign Large Growth, Foreign
Large Value, Foreign Small/Mid Blend, Foreign Small/Mid Growth, Foreign Small/Mid Value, Japan Stock, Large Blend, Large Growth,
Large Value, Mid-Cap Blend, Mid-Cap Value, Miscellaneous Region, Pacific/Asia ex-Japan Stock, Small Blend, Small Growth, Small
Value, and World Stock. Fixed income fund sample includes the Morningstar historical categories: Corporate Bond, Inflation-Protected
Bond, Intermediate Government, Intermediate-Term Bond, Muni California Intermediate, Muni National Intermediate, Muni National
Short, Muni New York Intermediate, Muni Single State Short, Short Government, Short-Term Bond, Ultrashort Bond, and World Bond.
See Dimensional’s “Mutual Fund Landscape 2017” for more detail. Benchmark data provided by Bloomberg Barclays, MSCI, Russell,
Citigroup, and S&P. Bloomberg Barclays data provided by Bloomberg. MSCI data © MSCI 2017, all rights reserved. Frank Russell
Company is the source and owner of the trademarks, service marks, and copyrights related to the Russell Indexes. Citi fixed income
indices © 2017 by Citigroup. The S&P data is provided by Standard & Poor’s Index Services Group.
Exhibit 4: In US dollars. US Small Cap is the CRSP 6–10 Index. US Large Cap is the S&P 500 Index. Long-Term Government Bonds
is the IA SBBI US LT Govt TR USD. Treasury Bills is the IA SBBI US 30 Day TBill TR USD. US Inflation is measured as changes in
the US Consumer Price Index. CRSP data is provided by the Center for Research in Security Prices, University of Chicago. The S&P
data is provided by Standard & Poor’s Index Services Group. Long-term government bonds and Treasury bills data provided by
Ibbotson Associates via Morningstar Direct. US Consumer Price Index data is provided by the US Department of Labor Bureau of
Labor Statistics.
Exhibit 5: Relative price is measured by the price-to-book ratio; value stocks are those with lower price-to-book ratios. Profitability
is a measure of current profitability, based on information from individual companies’ income statements.
Exhibit 6: Number of holdings and countries for the S&P 500 Index and MSCI ACWI (All Country World Index) Investable Market
Index (IMI) as of December 31, 2016. The S&P data is provided by Standard & Poor’s Index Services Group. MSCI data © MSCI
2017, all rights reserved. International investing involves special risks such as currency fluctuation and political instability. Investing
in emerging markets may accentuate these risks.
Exhibit 7: In US dollars. US Large Cap is the S&P 500 Index. US Large Cap Value is the Russell 1000 Value Index. US Small Cap
is the Russell 2000 Index. US Small Cap Value is the Russell 2000 Value Index. US Real Estate is the Dow Jones US Select REIT
Index. International Large Cap Value is the MSCI World ex USA Value Index (net dividends). International Small Cap Value is the
MSCI World ex USA Small Cap Value Index (net dividends). Emerging Markets is the MSCI Emerging Markets Index (net dividends).
Five-Year US Government Fixed is the Bloomberg Barclays US TIPS Index 1–5 Years. The S&P data is provided by Standard &
Poor’s Index Services Group. Frank Russell Company is the source and owner of the trademarks, service marks, and copyrights
related to the Russell Indexes. Dow Jones data provided by Dow Jones Indices. MSCI data © MSCI 2017, all rights reserved.
Bloomberg Barclays data provided by Bloomberg. Chart is for illustrative purposes only.
Dimensional Fund Advisors LP is an investment advisor registered with the Securities and Exchange Commission.
Pursuing a Better
Investment Experience
Key Principles to Improve
Your Odds of Success
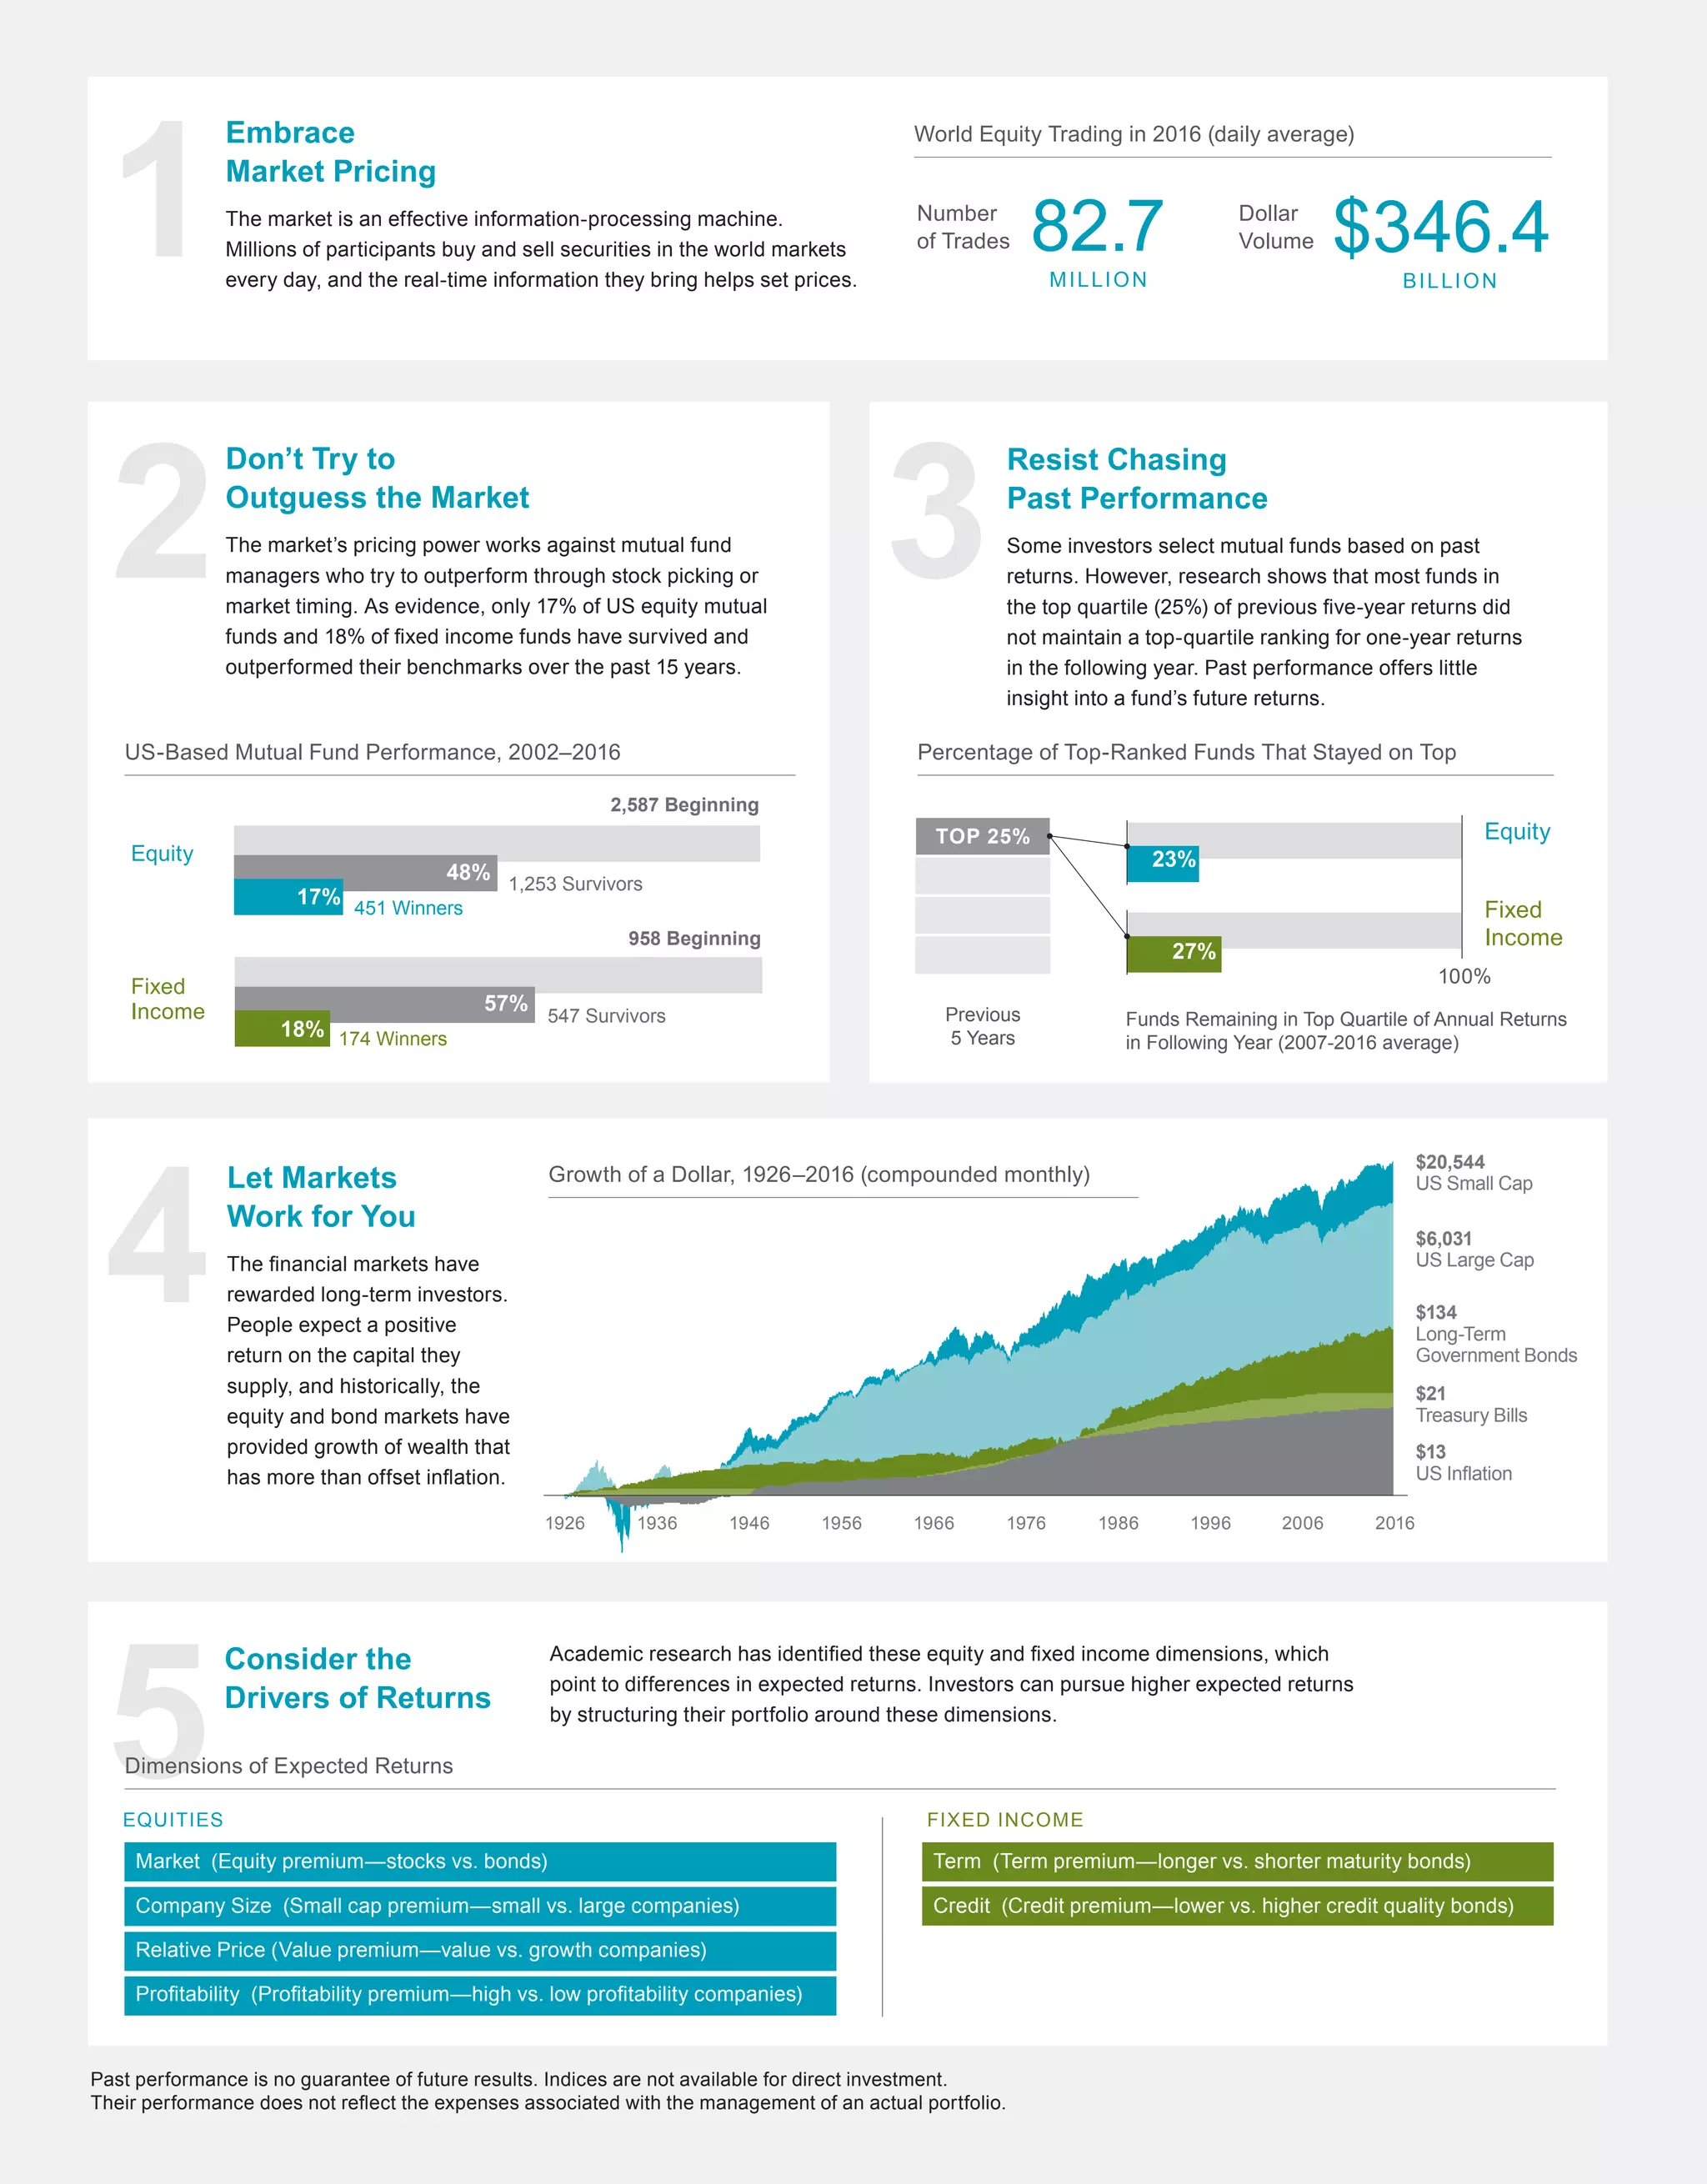
Academic research has identified these equity and fixed income dimensions, which
point to differences in expected returns. Investors can pursue higher expected returns
by structuring their portfolio around these dimensions.
Past performance is no guarantee of future results. Indices are not available for direct investment.
Their performance does not reflect the expenses associated with the management of an actual portfolio.
Diversification does not eliminate the risk of market loss. There is no guarantee investment strategies will be successful.
This information is for illustrative purposes only. See back page for additional exhibit information and important disclosures.
Growth of a Dollar, 1926–2016 (compounded monthly)
Annual Returns by Market Index
Avoid Reactive Investing
US-Based Mutual Fund Performance, 2002–2016 Percentage of Top-Ranked Funds That Stayed on Top
82.7
MILLION
Number
of Trades
Dollar
Volume $346.4
BILLION
World Equity Trading in 2016 (daily average) Home Market Index Portfolio Global Market Index Portfolio
S&P 500 Index
1 Country,
500 stocks
MSCI ACWI
Investable
Market Index (IMI)
46 countries,
8,628 stocks
THE TOP 10 FUNDS TO OWN
RETIRE RICH
SELL STOCKS NOW!
MARKET HITS RECORD HIGH!
HOUSING MARKET BOOM!
THE LOOMING RECESSION
451 Winners
1,253 Survivors
2,587 Beginning
17%
48%
Equity
174 Winners
547 Survivors
958 Beginning
18%
57%
Fixed
Income Previous
5 Years
Funds Remaining in Top Quartile of Annual Returns
in Following Year (2007-2016 average)
TOP 25%
100%
Equity
Fixed
Income
23%
27%
Elation
Fear
Optimism
Nervousness Optimism
Create an investment plan to fit your needs and risk tolerance
Structure a portfolio along the dimensions of expected returns
Diversify globally
Manage expenses, turnover, and taxes
Stay disciplined through market dips and swings
$20,544
US Small Cap
$6,031
US Large Cap
$134
Long-Term
Government Bonds
$21
Treasury Bills
$13
US Inflation
1926 1946 19861966 20061936 1956 19961976 2016
2002 2004 2006 2008 2010 2012 2014 2016
HIGHER
RETURN
LOWER
RETURN
US Large Cap
US Large Cap Value
US Small Cap
US Small Cap Value
US Real Estate
Intl. Large Cap Value
Intl. Small Cap Value
Emerging Markets
Five-Year US Govt. Fixed
1 6
7
8
10
9
2
4
5
3
Embrace
Market Pricing
The market is an effective information-processing machine.
Millions of participants buy and sell securities in the world markets
every day, and the real-time information they bring helps set prices.
Don’t Try to
Outguess the Market
The market’s pricing power works against mutual fund
managers who try to outperform through stock picking or
market timing. As evidence, only 17% of US equity mutual
funds and 18% of fixed income funds have survived and
outperformed their benchmarks over the past 15 years.
Resist Chasing
Past Performance
Some investors select mutual funds based on past
returns. However, research shows that most funds in
the top quartile (25%) of previous five-year returns did
not maintain a top-quartile ranking for one-year returns
in the following year. Past performance offers little
insight into a fund’s future returns.
Let Markets
Work for You
The financial markets have
rewarded long-term investors.
People expect a positive
return on the capital they
supply, and historically, the
equity and bond markets have
provided growth of wealth that
has more than offset inflation.
Practice Smart
Diversification
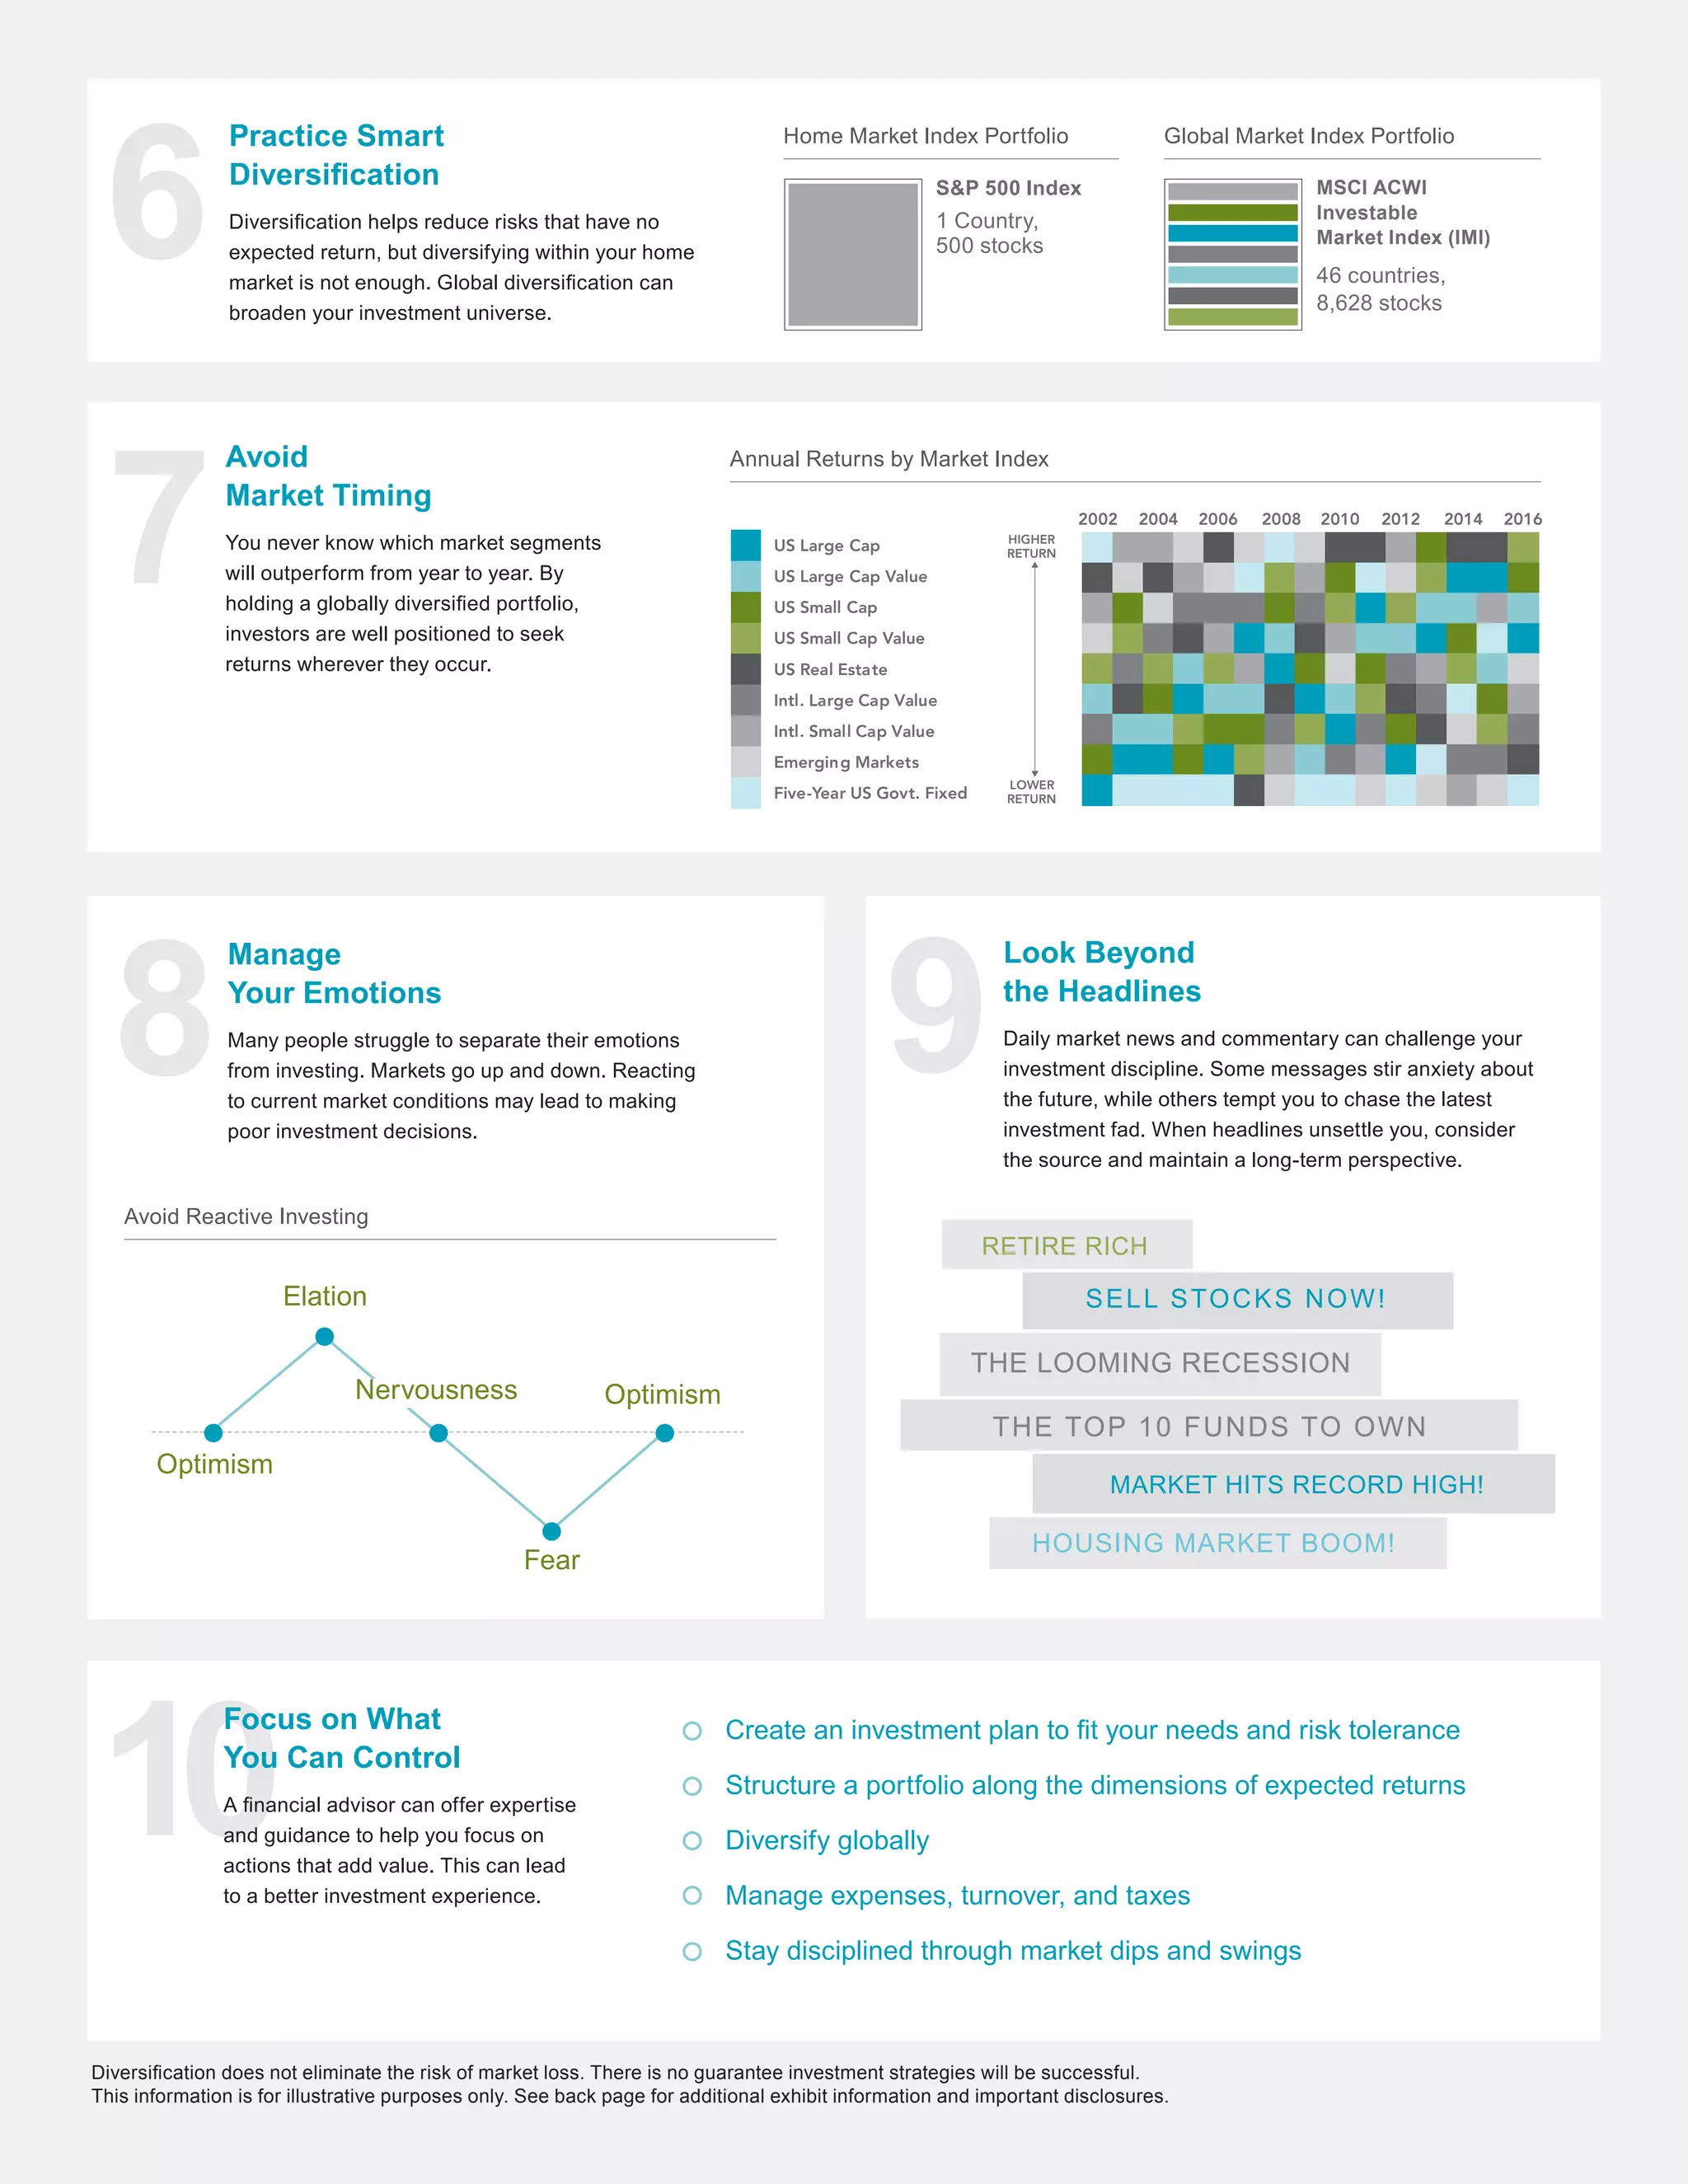
Diversification helps reduce risks that have no
expected return, but diversifying within your home
market is not enough. Global diversification can
broaden your investment universe.
Avoid
Market Timing
You never know which market segments
will outperform from year to year. By
holding a globally diversified portfolio,
investors are well positioned to seek
returns wherever they occur.
Manage
Your Emotions
Many people struggle to separate their emotions
from investing. Markets go up and down. Reacting
to current market conditions may lead to making
poor investment decisions.
Focus on What
You Can Control
A financial advisor can offer expertise
and guidance to help you focus on
actions that add value. This can lead
to a better investment experience.
Look Beyond
the Headlines
Daily market news and commentary can challenge your
investment discipline. Some messages stir anxiety about
the future, while others tempt you to chase the latest
investment fad. When headlines unsettle you, consider
the source and maintain a long-term perspective.
Dimensions of Expected Returns
Consider the
Drivers of Returns
EQUITIES
Market (Equity premium—stocks vs. bonds)
Company Size (Small cap premium—small vs. large companies)
Relative Price (Value premium—value vs. growth companies)
Profitability (Profitability premium—high vs. low profitability companies)
FIXED INCOME
Term (Term premium—longer vs. shorter maturity bonds)
Credit (Credit premium—lower vs. higher credit quality bonds)
DISCLOSURES
Exhibit 1: In US dollars. Source: World Federation of Exchanges members, affiliates, correspondents, and non-members. Trade
data from the global electronic order book. Daily averages were computed using year-to-date totals as of December 31, 2016,
divided by 250 as an approximate number of annual trading days.
Exhibit 2: The sample includes funds at the beginning of the 15-year period ending December 31, 2016. Each fund is evaluated
relative to the Morningstar benchmark assigned to the fund’s category at the start of the evaluation period. Surviving funds are
those with return observations for every month of the sample period. Winner funds are those that survived and whose cumulative
net return over the period exceeded that of their respective Morningstar category benchmark.
Exhibit 3: At the end of each year, funds are sorted within their category based on their five-year total return. Funds in the top quartile
(25%) of returns are evaluated again in the following year based on one-year performance in order to determine the percentage
of funds that maintained a top-quartile ranking. The analysis is repeated each year from 2007–2016. The chart shows average
persistence of top-quartile funds during the 10-year period.
Source (Exhibits 2 and 3): US-domiciled open-end mutual fund data is from Morningstar and Center for Research in Security Prices
(CRSP) from the University of Chicago. Index funds and fund-of-funds are excluded from the sample. Equity fund sample includes the
Morningstar historical categories: Diversified Emerging Markets, Europe Stock, Foreign Large Blend, Foreign Large Growth, Foreign
Large Value, Foreign Small/Mid Blend, Foreign Small/Mid Growth, Foreign Small/Mid Value, Japan Stock, Large Blend, Large Growth,
Large Value, Mid-Cap Blend, Mid-Cap Value, Miscellaneous Region, Pacific/Asia ex-Japan Stock, Small Blend, Small Growth, Small
Value, and World Stock. Fixed income fund sample includes the Morningstar historical categories: Corporate Bond, Inflation-Protected
Bond, Intermediate Government, Intermediate-Term Bond, Muni California Intermediate, Muni National Intermediate, Muni National
Short, Muni New York Intermediate, Muni Single State Short, Short Government, Short-Term Bond, Ultrashort Bond, and World Bond.
See Dimensional’s “Mutual Fund Landscape 2017” for more detail. Benchmark data provided by Bloomberg Barclays, MSCI, Russell,
Citigroup, and S&P. Bloomberg Barclays data provided by Bloomberg. MSCI data © MSCI 2017, all rights reserved. Frank Russell
Company is the source and owner of the trademarks, service marks, and copyrights related to the Russell Indexes. Citi fixed income
indices © 2017 by Citigroup. The S&P data is provided by Standard & Poor’s Index Services Group.
Exhibit 4: In US dollars. US Small Cap is the CRSP 6–10 Index. US Large Cap is the S&P 500 Index. Long-Term Government Bonds
is the IA SBBI US LT Govt TR USD. Treasury Bills is the IA SBBI US 30 Day TBill TR USD. US Inflation is measured as changes in
the US Consumer Price Index. CRSP data is provided by the Center for Research in Security Prices, University of Chicago. The S&P
data is provided by Standard & Poor’s Index Services Group. Long-term government bonds and Treasury bills data provided by
Ibbotson Associates via Morningstar Direct. US Consumer Price Index data is provided by the US Department of Labor Bureau of
Labor Statistics.
Exhibit 5: Relative price is measured by the price-to-book ratio; value stocks are those with lower price-to-book ratios. Profitability
is a measure of current profitability, based on information from individual companies’ income statements.
Exhibit 6: Number of holdings and countries for the S&P 500 Index and MSCI ACWI (All Country World Index) Investable Market
Index (IMI) as of December 31, 2016. The S&P data is provided by Standard & Poor’s Index Services Group. MSCI data © MSCI
2017, all rights reserved. International investing involves special risks such as currency fluctuation and political instability. Investing
in emerging markets may accentuate these risks.
Exhibit 7: In US dollars. US Large Cap is the S&P 500 Index. US Large Cap Value is the Russell 1000 Value Index. US Small Cap
is the Russell 2000 Index. US Small Cap Value is the Russell 2000 Value Index. US Real Estate is the Dow Jones US Select REIT
Index. International Large Cap Value is the MSCI World ex USA Value Index (net dividends). International Small Cap Value is the
MSCI World ex USA Small Cap Value Index (net dividends). Emerging Markets is the MSCI Emerging Markets Index (net dividends).
Five-Year US Government Fixed is the Bloomberg Barclays US TIPS Index 1–5 Years. The S&P data is provided by Standard &
Poor’s Index Services Group. Frank Russell Company is the source and owner of the trademarks, service marks, and copyrights
related to the Russell Indexes. Dow Jones data provided by Dow Jones Indices. MSCI data © MSCI 2017, all rights reserved.
Bloomberg Barclays data provided by Bloomberg. Chart is for illustrative purposes only.
Dimensional Fund Advisors LP is an investment advisor registered with the Securities and Exchange Commission.
Pursuing a Better
Investment Experience
Key Principles to Improve
Your Odds of Success

More Related Content

What's hot

True-Insight-Spring-2016-1
True-Insight-Spring-2016-1True-Insight-Spring-2016-1
True-Insight-Spring-2016-1
Barrie Kent
 
DSP Global Allocation Fund
DSP Global Allocation FundDSP Global Allocation Fund
DSP Global Allocation Fund
DSP Mutual Fund
 
Why To Diversify
Why To DiversifyWhy To Diversify
Why To Diversify
Connell McNamara, APMA®
 
Value stocks-v3
Value stocks-v3Value stocks-v3
Value stocks-v3
Aranca
 
New Market Highs and Positive Expected Returns
New Market Highs and Positive Expected ReturnsNew Market Highs and Positive Expected Returns
New Market Highs and Positive Expected Returns
Rich Schuette
 
JPM prime brokerage global hedge fund trends august 2013
JPM prime brokerage global hedge fund trends august 2013JPM prime brokerage global hedge fund trends august 2013
JPM prime brokerage global hedge fund trends august 2013
Brian Shapiro
 
Cummings_DBP_Brochure_0716
Cummings_DBP_Brochure_0716Cummings_DBP_Brochure_0716
Cummings_DBP_Brochure_0716
Bobby
 
NWAM investment outlook 12-31-18
NWAM investment outlook 12-31-18NWAM investment outlook 12-31-18
NWAM investment outlook 12-31-18
Patrick Thuemmel
 
Randomness of returns_historical_asset_class_ranking_2014 skittles
Randomness of returns_historical_asset_class_ranking_2014 skittlesRandomness of returns_historical_asset_class_ranking_2014 skittles
Randomness of returns_historical_asset_class_ranking_2014 skittles
Better Financial Education
 
ifm_final_report_-_spring_2016
ifm_final_report_-_spring_2016ifm_final_report_-_spring_2016
ifm_final_report_-_spring_2016
Tianyuan Ren
 
Power of proactivity
Power of proactivityPower of proactivity
Power of proactivity
dhess0
 
Asset class skittles_2014
Asset class skittles_2014Asset class skittles_2014
Asset class skittles_2014
Better Financial Education
 
2016 ETF and investment outlook
2016 ETF and investment outlook2016 ETF and investment outlook
2016 ETF and investment outlook
Ying wei (Joe) Chou
 
Design, build, protect with Capital Associates
Design, build, protect with Capital AssociatesDesign, build, protect with Capital Associates
Design, build, protect with Capital Associates
Mitch Katz
 
Capital Markets Review Q1 2009
Capital Markets Review Q1 2009Capital Markets Review Q1 2009
Capital Markets Review Q1 2009
dkeogh
 
Presentación Degroof Petercam: Funds Experience 2016
Presentación Degroof Petercam: Funds Experience 2016Presentación Degroof Petercam: Funds Experience 2016
Presentación Degroof Petercam: Funds Experience 2016
Rankia
 
Getting Through a Volatile Market
Getting Through a Volatile MarketGetting Through a Volatile Market
Getting Through a Volatile Market
JLinneman
 
Pursuing a Better Investment Experience Brochure Branded
Pursuing a Better Investment Experience Brochure BrandedPursuing a Better Investment Experience Brochure Branded
Pursuing a Better Investment Experience Brochure Branded
Theresa M. Mahoney
 
Class Investing Basics
Class Investing BasicsClass Investing Basics
Class Investing Basics
Social Thread
 
Putnam Perspectives: Equity Outlook Q3 2014
Putnam Perspectives: Equity Outlook Q3 2014Putnam Perspectives: Equity Outlook Q3 2014
Putnam Perspectives: Equity Outlook Q3 2014
Putnam Investments
 

What's hot (20)

True-Insight-Spring-2016-1
True-Insight-Spring-2016-1True-Insight-Spring-2016-1
True-Insight-Spring-2016-1
 
DSP Global Allocation Fund
DSP Global Allocation FundDSP Global Allocation Fund
DSP Global Allocation Fund
 
Why To Diversify
Why To DiversifyWhy To Diversify
Why To Diversify
 
Value stocks-v3
Value stocks-v3Value stocks-v3
Value stocks-v3
 
New Market Highs and Positive Expected Returns
New Market Highs and Positive Expected ReturnsNew Market Highs and Positive Expected Returns
New Market Highs and Positive Expected Returns
 
JPM prime brokerage global hedge fund trends august 2013
JPM prime brokerage global hedge fund trends august 2013JPM prime brokerage global hedge fund trends august 2013
JPM prime brokerage global hedge fund trends august 2013
 
Cummings_DBP_Brochure_0716
Cummings_DBP_Brochure_0716Cummings_DBP_Brochure_0716
Cummings_DBP_Brochure_0716
 
NWAM investment outlook 12-31-18
NWAM investment outlook 12-31-18NWAM investment outlook 12-31-18
NWAM investment outlook 12-31-18
 
Randomness of returns_historical_asset_class_ranking_2014 skittles
Randomness of returns_historical_asset_class_ranking_2014 skittlesRandomness of returns_historical_asset_class_ranking_2014 skittles
Randomness of returns_historical_asset_class_ranking_2014 skittles
 
ifm_final_report_-_spring_2016
ifm_final_report_-_spring_2016ifm_final_report_-_spring_2016
ifm_final_report_-_spring_2016
 
Power of proactivity
Power of proactivityPower of proactivity
Power of proactivity
 
Asset class skittles_2014
Asset class skittles_2014Asset class skittles_2014
Asset class skittles_2014
 
2016 ETF and investment outlook
2016 ETF and investment outlook2016 ETF and investment outlook
2016 ETF and investment outlook
 
Design, build, protect with Capital Associates
Design, build, protect with Capital AssociatesDesign, build, protect with Capital Associates
Design, build, protect with Capital Associates
 
Capital Markets Review Q1 2009
Capital Markets Review Q1 2009Capital Markets Review Q1 2009
Capital Markets Review Q1 2009
 
Presentación Degroof Petercam: Funds Experience 2016
Presentación Degroof Petercam: Funds Experience 2016Presentación Degroof Petercam: Funds Experience 2016
Presentación Degroof Petercam: Funds Experience 2016
 
Getting Through a Volatile Market
Getting Through a Volatile MarketGetting Through a Volatile Market
Getting Through a Volatile Market
 
Pursuing a Better Investment Experience Brochure Branded
Pursuing a Better Investment Experience Brochure BrandedPursuing a Better Investment Experience Brochure Branded
Pursuing a Better Investment Experience Brochure Branded
 
Class Investing Basics
Class Investing BasicsClass Investing Basics
Class Investing Basics
 
Putnam Perspectives: Equity Outlook Q3 2014
Putnam Perspectives: Equity Outlook Q3 2014Putnam Perspectives: Equity Outlook Q3 2014
Putnam Perspectives: Equity Outlook Q3 2014
 

Similar to A Better Investment Experience

Stop Wasting Your Money & Start Having a Better Investment Experience
Stop Wasting Your Money & Start Having a Better Investment ExperienceStop Wasting Your Money & Start Having a Better Investment Experience
Stop Wasting Your Money & Start Having a Better Investment Experience
Andreas Scott, CFP®
 
DHGWA Brochure 2015 Portrait
DHGWA Brochure 2015 PortraitDHGWA Brochure 2015 Portrait
DHGWA Brochure 2015 Portrait
Ellen Lindh
 
EA - Core Beliefs Presentation_EA Core Factor Factor Plus
EA - Core Beliefs Presentation_EA Core Factor  Factor PlusEA - Core Beliefs Presentation_EA Core Factor  Factor Plus
EA - Core Beliefs Presentation_EA Core Factor Factor Plus
John Schmick
 
New perspectives on asset class investing
New perspectives on asset class investingNew perspectives on asset class investing
New perspectives on asset class investing
RobUgiansky
 
The Fundamentals of Asset Class Investing
The Fundamentals of Asset Class InvestingThe Fundamentals of Asset Class Investing
The Fundamentals of Asset Class Investing
Mitch Katz
 
Investment Principles
Investment PrinciplesInvestment Principles
Investment Principles
Paul Ohanian, CFP®
 
John hancock-lesson
John hancock-lessonJohn hancock-lesson
John hancock-lesson
lsorrentino1
 
Asset Allocation And Your Portfolio
Asset Allocation And Your PortfolioAsset Allocation And Your Portfolio
Asset Allocation And Your Portfolio
WilliamDeye
 
2nd Quarter 2014 Investment Commentary
2nd Quarter 2014 Investment Commentary2nd Quarter 2014 Investment Commentary
2nd Quarter 2014 Investment Commentary
mcclainlovejoy
 
A Different Way to Invest
A Different Way to InvestA Different Way to Invest
A Different Way to Invest
Andreas Scott, CFP®
 
Why Pillar Capital (Investment approach)
Why Pillar Capital (Investment approach)Why Pillar Capital (Investment approach)
Why Pillar Capital (Investment approach)
Michael Johnson
 
Portfolio perspectives-greatest lesson-part2-0813
Portfolio perspectives-greatest lesson-part2-0813Portfolio perspectives-greatest lesson-part2-0813
Portfolio perspectives-greatest lesson-part2-0813
Better Financial Education
 
Cummings_ACI_Brochure_0116
Cummings_ACI_Brochure_0116Cummings_ACI_Brochure_0116
Cummings_ACI_Brochure_0116
Bobby
 
Elementsof Investing.Ameriprise
Elementsof Investing.AmeripriseElementsof Investing.Ameriprise
Elementsof Investing.Ameriprise
genogates
 
RWC Investment Introduction Presentation
RWC Investment Introduction PresentationRWC Investment Introduction Presentation
RWC Investment Introduction Presentation
Sprague Kolp
 
Science Of Investing Us
Science Of Investing UsScience Of Investing Us
Science Of Investing Us
AegisAdvisor
 
Abacus Weath Partners Investment slideshow
Abacus Weath Partners Investment slideshowAbacus Weath Partners Investment slideshow
Abacus Weath Partners Investment slideshow
Abacus Wealth Partners
 
Q1 2019 Quarterly Market Review
Q1 2019 Quarterly Market ReviewQ1 2019 Quarterly Market Review
Q1 2019 Quarterly Market Review
Susan Langdon
 
Review of the Markets - 1st Quarter 2013
Review of the Markets - 1st Quarter 2013Review of the Markets - 1st Quarter 2013
Review of the Markets - 1st Quarter 2013
Barry Mendelson
 
QMR q217 2017_mamc
QMR q217 2017_mamcQMR q217 2017_mamc
QMR q217 2017_mamc
mclean8200
 

Similar to A Better Investment Experience (20)

Stop Wasting Your Money & Start Having a Better Investment Experience
Stop Wasting Your Money & Start Having a Better Investment ExperienceStop Wasting Your Money & Start Having a Better Investment Experience
Stop Wasting Your Money & Start Having a Better Investment Experience
 
DHGWA Brochure 2015 Portrait
DHGWA Brochure 2015 PortraitDHGWA Brochure 2015 Portrait
DHGWA Brochure 2015 Portrait
 
EA - Core Beliefs Presentation_EA Core Factor Factor Plus
EA - Core Beliefs Presentation_EA Core Factor  Factor PlusEA - Core Beliefs Presentation_EA Core Factor  Factor Plus
EA - Core Beliefs Presentation_EA Core Factor Factor Plus
 
New perspectives on asset class investing
New perspectives on asset class investingNew perspectives on asset class investing
New perspectives on asset class investing
 
The Fundamentals of Asset Class Investing
The Fundamentals of Asset Class InvestingThe Fundamentals of Asset Class Investing
The Fundamentals of Asset Class Investing
 
Investment Principles
Investment PrinciplesInvestment Principles
Investment Principles
 
John hancock-lesson
John hancock-lessonJohn hancock-lesson
John hancock-lesson
 
Asset Allocation And Your Portfolio
Asset Allocation And Your PortfolioAsset Allocation And Your Portfolio
Asset Allocation And Your Portfolio
 
2nd Quarter 2014 Investment Commentary
2nd Quarter 2014 Investment Commentary2nd Quarter 2014 Investment Commentary
2nd Quarter 2014 Investment Commentary
 
A Different Way to Invest
A Different Way to InvestA Different Way to Invest
A Different Way to Invest
 
Why Pillar Capital (Investment approach)
Why Pillar Capital (Investment approach)Why Pillar Capital (Investment approach)
Why Pillar Capital (Investment approach)
 
Portfolio perspectives-greatest lesson-part2-0813
Portfolio perspectives-greatest lesson-part2-0813Portfolio perspectives-greatest lesson-part2-0813
Portfolio perspectives-greatest lesson-part2-0813
 
Cummings_ACI_Brochure_0116
Cummings_ACI_Brochure_0116Cummings_ACI_Brochure_0116
Cummings_ACI_Brochure_0116
 
Elementsof Investing.Ameriprise
Elementsof Investing.AmeripriseElementsof Investing.Ameriprise
Elementsof Investing.Ameriprise
 
RWC Investment Introduction Presentation
RWC Investment Introduction PresentationRWC Investment Introduction Presentation
RWC Investment Introduction Presentation
 
Science Of Investing Us
Science Of Investing UsScience Of Investing Us
Science Of Investing Us
 
Abacus Weath Partners Investment slideshow
Abacus Weath Partners Investment slideshowAbacus Weath Partners Investment slideshow
Abacus Weath Partners Investment slideshow
 
Q1 2019 Quarterly Market Review
Q1 2019 Quarterly Market ReviewQ1 2019 Quarterly Market Review
Q1 2019 Quarterly Market Review
 
Review of the Markets - 1st Quarter 2013
Review of the Markets - 1st Quarter 2013Review of the Markets - 1st Quarter 2013
Review of the Markets - 1st Quarter 2013
 
QMR q217 2017_mamc
QMR q217 2017_mamcQMR q217 2017_mamc
QMR q217 2017_mamc
 

Recently uploaded

An Overview of the Prosocial dHEDGE Vault works
An Overview of the Prosocial dHEDGE Vault worksAn Overview of the Prosocial dHEDGE Vault works
An Overview of the Prosocial dHEDGE Vault works
Colin R. Turner
 
一比一原版(GWU,GW毕业证)加利福尼亚大学|尔湾分校毕业证如何办理
一比一原版(GWU,GW毕业证)加利福尼亚大学|尔湾分校毕业证如何办理一比一原版(GWU,GW毕业证)加利福尼亚大学|尔湾分校毕业证如何办理
一比一原版(GWU,GW毕业证)加利福尼亚大学|尔湾分校毕业证如何办理
obyzuk
 
在线办理(GU毕业证书)美国贡萨加大学毕业证学历证书一模一样
在线办理(GU毕业证书)美国贡萨加大学毕业证学历证书一模一样在线办理(GU毕业证书)美国贡萨加大学毕业证学历证书一模一样
在线办理(GU毕业证书)美国贡萨加大学毕业证学历证书一模一样
5spllj1l
 
5 Tips for Creating Standard Financial Reports
5 Tips for Creating Standard Financial Reports5 Tips for Creating Standard Financial Reports
5 Tips for Creating Standard Financial Reports
EasyReports
 
1.2 Business Ideas Business Ideas Busine
1.2 Business Ideas Business Ideas Busine1.2 Business Ideas Business Ideas Busine
1.2 Business Ideas Business Ideas Busine
Lawrence101
 
Applying the Global Internal Audit Standards_AIS.pdf
Applying the Global Internal Audit Standards_AIS.pdfApplying the Global Internal Audit Standards_AIS.pdf
Applying the Global Internal Audit Standards_AIS.pdf
alexiusbrian1
 
BONKMILLON Unleashes Its Bonkers Potential on Solana.pdf
BONKMILLON Unleashes Its Bonkers Potential on Solana.pdfBONKMILLON Unleashes Its Bonkers Potential on Solana.pdf
BONKMILLON Unleashes Its Bonkers Potential on Solana.pdf
coingabbar
 
Solution Manual For Financial Accounting, 8th Canadian Edition 2024, by Libby...
Solution Manual For Financial Accounting, 8th Canadian Edition 2024, by Libby...Solution Manual For Financial Accounting, 8th Canadian Edition 2024, by Libby...
Solution Manual For Financial Accounting, 8th Canadian Edition 2024, by Libby...
Donc Test
 
Instant Issue Debit Cards
Instant Issue Debit CardsInstant Issue Debit Cards
Instant Issue Debit Cards
egoetzinger
 
SWAIAP Fraud Risk Mitigation Prof Oyedokun.pptx
SWAIAP Fraud Risk Mitigation   Prof Oyedokun.pptxSWAIAP Fraud Risk Mitigation   Prof Oyedokun.pptx
SWAIAP Fraud Risk Mitigation Prof Oyedokun.pptx
Godwin Emmanuel Oyedokun MBA MSc PhD FCA FCTI FCNA CFE FFAR
 
一比一原版(UCSB毕业证)圣芭芭拉分校毕业证如何办理
一比一原版(UCSB毕业证)圣芭芭拉分校毕业证如何办理一比一原版(UCSB毕业证)圣芭芭拉分校毕业证如何办理
一比一原版(UCSB毕业证)圣芭芭拉分校毕业证如何办理
bbeucd
 
falcon-invoice-discounting-a-premier-investment-platform-for-superior-returns...
falcon-invoice-discounting-a-premier-investment-platform-for-superior-returns...falcon-invoice-discounting-a-premier-investment-platform-for-superior-returns...
falcon-invoice-discounting-a-premier-investment-platform-for-superior-returns...
Falcon Invoice Discounting
 
OAT_RI_Ep20 WeighingTheRisks_May24_Trade Wars.pptx
OAT_RI_Ep20 WeighingTheRisks_May24_Trade Wars.pptxOAT_RI_Ep20 WeighingTheRisks_May24_Trade Wars.pptx
OAT_RI_Ep20 WeighingTheRisks_May24_Trade Wars.pptx
hiddenlevers
 
Tdasx: Unveiling the Trillion-Dollar Potential of Bitcoin DeFi
Tdasx: Unveiling the Trillion-Dollar Potential of Bitcoin DeFiTdasx: Unveiling the Trillion-Dollar Potential of Bitcoin DeFi
Tdasx: Unveiling the Trillion-Dollar Potential of Bitcoin DeFi
nimaruinazawa258
 
Money20/20 and EU Networking Event of 20/24!
Money20/20 and EU Networking Event of 20/24!Money20/20 and EU Networking Event of 20/24!
Money20/20 and EU Networking Event of 20/24!
FinTech Belgium
 
Independent Study - College of Wooster Research (2023-2024) FDI, Culture, Glo...
Independent Study - College of Wooster Research (2023-2024) FDI, Culture, Glo...Independent Study - College of Wooster Research (2023-2024) FDI, Culture, Glo...
Independent Study - College of Wooster Research (2023-2024) FDI, Culture, Glo...
AntoniaOwensDetwiler
 
Who Is the Largest Producer of Soybean in India Now.pdf
Who Is the Largest Producer of Soybean in India Now.pdfWho Is the Largest Producer of Soybean in India Now.pdf
Who Is the Largest Producer of Soybean in India Now.pdf
Price Vision
 
一比一原版(IC毕业证)帝国理工大学毕业证如何办理
一比一原版(IC毕业证)帝国理工大学毕业证如何办理一比一原版(IC毕业证)帝国理工大学毕业证如何办理
一比一原版(IC毕业证)帝国理工大学毕业证如何办理
conose1
 
一比一原版(UoB毕业证)伯明翰大学毕业证如何办理
一比一原版(UoB毕业证)伯明翰大学毕业证如何办理一比一原版(UoB毕业证)伯明翰大学毕业证如何办理
一比一原版(UoB毕业证)伯明翰大学毕业证如何办理
nexop1
 
Tdasx: In-Depth Analysis of Cryptocurrency Giveaway Scams and Security Strate...
Tdasx: In-Depth Analysis of Cryptocurrency Giveaway Scams and Security Strate...Tdasx: In-Depth Analysis of Cryptocurrency Giveaway Scams and Security Strate...
Tdasx: In-Depth Analysis of Cryptocurrency Giveaway Scams and Security Strate...
nimaruinazawa258
 

Recently uploaded (20)

An Overview of the Prosocial dHEDGE Vault works
An Overview of the Prosocial dHEDGE Vault worksAn Overview of the Prosocial dHEDGE Vault works
An Overview of the Prosocial dHEDGE Vault works
 
一比一原版(GWU,GW毕业证)加利福尼亚大学|尔湾分校毕业证如何办理
一比一原版(GWU,GW毕业证)加利福尼亚大学|尔湾分校毕业证如何办理一比一原版(GWU,GW毕业证)加利福尼亚大学|尔湾分校毕业证如何办理
一比一原版(GWU,GW毕业证)加利福尼亚大学|尔湾分校毕业证如何办理
 
在线办理(GU毕业证书)美国贡萨加大学毕业证学历证书一模一样
在线办理(GU毕业证书)美国贡萨加大学毕业证学历证书一模一样在线办理(GU毕业证书)美国贡萨加大学毕业证学历证书一模一样
在线办理(GU毕业证书)美国贡萨加大学毕业证学历证书一模一样
 
5 Tips for Creating Standard Financial Reports
5 Tips for Creating Standard Financial Reports5 Tips for Creating Standard Financial Reports
5 Tips for Creating Standard Financial Reports
 
1.2 Business Ideas Business Ideas Busine
1.2 Business Ideas Business Ideas Busine1.2 Business Ideas Business Ideas Busine
1.2 Business Ideas Business Ideas Busine
 
Applying the Global Internal Audit Standards_AIS.pdf
Applying the Global Internal Audit Standards_AIS.pdfApplying the Global Internal Audit Standards_AIS.pdf
Applying the Global Internal Audit Standards_AIS.pdf
 
BONKMILLON Unleashes Its Bonkers Potential on Solana.pdf
BONKMILLON Unleashes Its Bonkers Potential on Solana.pdfBONKMILLON Unleashes Its Bonkers Potential on Solana.pdf
BONKMILLON Unleashes Its Bonkers Potential on Solana.pdf
 
Solution Manual For Financial Accounting, 8th Canadian Edition 2024, by Libby...
Solution Manual For Financial Accounting, 8th Canadian Edition 2024, by Libby...Solution Manual For Financial Accounting, 8th Canadian Edition 2024, by Libby...
Solution Manual For Financial Accounting, 8th Canadian Edition 2024, by Libby...
 
Instant Issue Debit Cards
Instant Issue Debit CardsInstant Issue Debit Cards
Instant Issue Debit Cards
 
SWAIAP Fraud Risk Mitigation Prof Oyedokun.pptx
SWAIAP Fraud Risk Mitigation   Prof Oyedokun.pptxSWAIAP Fraud Risk Mitigation   Prof Oyedokun.pptx
SWAIAP Fraud Risk Mitigation Prof Oyedokun.pptx
 
一比一原版(UCSB毕业证)圣芭芭拉分校毕业证如何办理
一比一原版(UCSB毕业证)圣芭芭拉分校毕业证如何办理一比一原版(UCSB毕业证)圣芭芭拉分校毕业证如何办理
一比一原版(UCSB毕业证)圣芭芭拉分校毕业证如何办理
 
falcon-invoice-discounting-a-premier-investment-platform-for-superior-returns...
falcon-invoice-discounting-a-premier-investment-platform-for-superior-returns...falcon-invoice-discounting-a-premier-investment-platform-for-superior-returns...
falcon-invoice-discounting-a-premier-investment-platform-for-superior-returns...
 
OAT_RI_Ep20 WeighingTheRisks_May24_Trade Wars.pptx
OAT_RI_Ep20 WeighingTheRisks_May24_Trade Wars.pptxOAT_RI_Ep20 WeighingTheRisks_May24_Trade Wars.pptx
OAT_RI_Ep20 WeighingTheRisks_May24_Trade Wars.pptx
 
Tdasx: Unveiling the Trillion-Dollar Potential of Bitcoin DeFi
Tdasx: Unveiling the Trillion-Dollar Potential of Bitcoin DeFiTdasx: Unveiling the Trillion-Dollar Potential of Bitcoin DeFi
Tdasx: Unveiling the Trillion-Dollar Potential of Bitcoin DeFi
 
Money20/20 and EU Networking Event of 20/24!
Money20/20 and EU Networking Event of 20/24!Money20/20 and EU Networking Event of 20/24!
Money20/20 and EU Networking Event of 20/24!
 
Independent Study - College of Wooster Research (2023-2024) FDI, Culture, Glo...
Independent Study - College of Wooster Research (2023-2024) FDI, Culture, Glo...Independent Study - College of Wooster Research (2023-2024) FDI, Culture, Glo...
Independent Study - College of Wooster Research (2023-2024) FDI, Culture, Glo...
 
Who Is the Largest Producer of Soybean in India Now.pdf
Who Is the Largest Producer of Soybean in India Now.pdfWho Is the Largest Producer of Soybean in India Now.pdf
Who Is the Largest Producer of Soybean in India Now.pdf
 
一比一原版(IC毕业证)帝国理工大学毕业证如何办理
一比一原版(IC毕业证)帝国理工大学毕业证如何办理一比一原版(IC毕业证)帝国理工大学毕业证如何办理
一比一原版(IC毕业证)帝国理工大学毕业证如何办理
 
一比一原版(UoB毕业证)伯明翰大学毕业证如何办理
一比一原版(UoB毕业证)伯明翰大学毕业证如何办理一比一原版(UoB毕业证)伯明翰大学毕业证如何办理
一比一原版(UoB毕业证)伯明翰大学毕业证如何办理
 
Tdasx: In-Depth Analysis of Cryptocurrency Giveaway Scams and Security Strate...
Tdasx: In-Depth Analysis of Cryptocurrency Giveaway Scams and Security Strate...Tdasx: In-Depth Analysis of Cryptocurrency Giveaway Scams and Security Strate...
Tdasx: In-Depth Analysis of Cryptocurrency Giveaway Scams and Security Strate...
 

A Better Investment Experience

  • 1. DISCLOSURES Exhibit 1: In US dollars. Source: World Federation of Exchanges members, affiliates, correspondents, and non-members. Trade data from the global electronic order book. Daily averages were computed using year-to-date totals as of December 31, 2016, divided by 250 as an approximate number of annual trading days. Exhibit 2: The sample includes funds at the beginning of the 15-year period ending December 31, 2016. Each fund is evaluated relative to the Morningstar benchmark assigned to the fund’s category at the start of the evaluation period. Surviving funds are those with return observations for every month of the sample period. Winner funds are those that survived and whose cumulative net return over the period exceeded that of their respective Morningstar category benchmark. Exhibit 3: At the end of each year, funds are sorted within their category based on their five-year total return. Funds in the top quartile (25%) of returns are evaluated again in the following year based on one-year performance in order to determine the percentage of funds that maintained a top-quartile ranking. The analysis is repeated each year from 2007–2016. The chart shows average persistence of top-quartile funds during the 10-year period. Source (Exhibits 2 and 3): US-domiciled open-end mutual fund data is from Morningstar and Center for Research in Security Prices (CRSP) from the University of Chicago. Index funds and fund-of-funds are excluded from the sample. Equity fund sample includes the Morningstar historical categories: Diversified Emerging Markets, Europe Stock, Foreign Large Blend, Foreign Large Growth, Foreign Large Value, Foreign Small/Mid Blend, Foreign Small/Mid Growth, Foreign Small/Mid Value, Japan Stock, Large Blend, Large Growth, Large Value, Mid-Cap Blend, Mid-Cap Value, Miscellaneous Region, Pacific/Asia ex-Japan Stock, Small Blend, Small Growth, Small Value, and World Stock. Fixed income fund sample includes the Morningstar historical categories: Corporate Bond, Inflation-Protected Bond, Intermediate Government, Intermediate-Term Bond, Muni California Intermediate, Muni National Intermediate, Muni National Short, Muni New York Intermediate, Muni Single State Short, Short Government, Short-Term Bond, Ultrashort Bond, and World Bond. See Dimensional’s “Mutual Fund Landscape 2017” for more detail. Benchmark data provided by Bloomberg Barclays, MSCI, Russell, Citigroup, and S&P. Bloomberg Barclays data provided by Bloomberg. MSCI data © MSCI 2017, all rights reserved. Frank Russell Company is the source and owner of the trademarks, service marks, and copyrights related to the Russell Indexes. Citi fixed income indices © 2017 by Citigroup. The S&P data is provided by Standard & Poor’s Index Services Group. Exhibit 4: In US dollars. US Small Cap is the CRSP 6–10 Index. US Large Cap is the S&P 500 Index. Long-Term Government Bonds is the IA SBBI US LT Govt TR USD. Treasury Bills is the IA SBBI US 30 Day TBill TR USD. US Inflation is measured as changes in the US Consumer Price Index. CRSP data is provided by the Center for Research in Security Prices, University of Chicago. The S&P data is provided by Standard & Poor’s Index Services Group. Long-term government bonds and Treasury bills data provided by Ibbotson Associates via Morningstar Direct. US Consumer Price Index data is provided by the US Department of Labor Bureau of Labor Statistics. Exhibit 5: Relative price is measured by the price-to-book ratio; value stocks are those with lower price-to-book ratios. Profitability is a measure of current profitability, based on information from individual companies’ income statements. Exhibit 6: Number of holdings and countries for the S&P 500 Index and MSCI ACWI (All Country World Index) Investable Market Index (IMI) as of December 31, 2016. The S&P data is provided by Standard & Poor’s Index Services Group. MSCI data © MSCI 2017, all rights reserved. International investing involves special risks such as currency fluctuation and political instability. Investing in emerging markets may accentuate these risks. Exhibit 7: In US dollars. US Large Cap is the S&P 500 Index. US Large Cap Value is the Russell 1000 Value Index. US Small Cap is the Russell 2000 Index. US Small Cap Value is the Russell 2000 Value Index. US Real Estate is the Dow Jones US Select REIT Index. International Large Cap Value is the MSCI World ex USA Value Index (net dividends). International Small Cap Value is the MSCI World ex USA Small Cap Value Index (net dividends). Emerging Markets is the MSCI Emerging Markets Index (net dividends). Five-Year US Government Fixed is the Bloomberg Barclays US TIPS Index 1–5 Years. The S&P data is provided by Standard & Poor’s Index Services Group. Frank Russell Company is the source and owner of the trademarks, service marks, and copyrights related to the Russell Indexes. Dow Jones data provided by Dow Jones Indices. MSCI data © MSCI 2017, all rights reserved. Bloomberg Barclays data provided by Bloomberg. Chart is for illustrative purposes only. Dimensional Fund Advisors LP is an investment advisor registered with the Securities and Exchange Commission. Pursuing a Better Investment Experience Key Principles to Improve Your Odds of Success
  • 2. Academic research has identified these equity and fixed income dimensions, which point to differences in expected returns. Investors can pursue higher expected returns by structuring their portfolio around these dimensions. Past performance is no guarantee of future results. Indices are not available for direct investment. Their performance does not reflect the expenses associated with the management of an actual portfolio. Diversification does not eliminate the risk of market loss. There is no guarantee investment strategies will be successful. This information is for illustrative purposes only. See back page for additional exhibit information and important disclosures. Growth of a Dollar, 1926–2016 (compounded monthly) Annual Returns by Market Index Avoid Reactive Investing US-Based Mutual Fund Performance, 2002–2016 Percentage of Top-Ranked Funds That Stayed on Top 82.7 MILLION Number of Trades Dollar Volume $346.4 BILLION World Equity Trading in 2016 (daily average) Home Market Index Portfolio Global Market Index Portfolio S&P 500 Index 1 Country, 500 stocks MSCI ACWI Investable Market Index (IMI) 46 countries, 8,628 stocks THE TOP 10 FUNDS TO OWN RETIRE RICH SELL STOCKS NOW! MARKET HITS RECORD HIGH! HOUSING MARKET BOOM! THE LOOMING RECESSION 451 Winners 1,253 Survivors 2,587 Beginning 17% 48% Equity 174 Winners 547 Survivors 958 Beginning 18% 57% Fixed Income Previous 5 Years Funds Remaining in Top Quartile of Annual Returns in Following Year (2007-2016 average) TOP 25% 100% Equity Fixed Income 23% 27% Elation Fear Optimism Nervousness Optimism Create an investment plan to fit your needs and risk tolerance Structure a portfolio along the dimensions of expected returns Diversify globally Manage expenses, turnover, and taxes Stay disciplined through market dips and swings $20,544 US Small Cap $6,031 US Large Cap $134 Long-Term Government Bonds $21 Treasury Bills $13 US Inflation 1926 1946 19861966 20061936 1956 19961976 2016 2002 2004 2006 2008 2010 2012 2014 2016 HIGHER RETURN LOWER RETURN US Large Cap US Large Cap Value US Small Cap US Small Cap Value US Real Estate Intl. Large Cap Value Intl. Small Cap Value Emerging Markets Five-Year US Govt. Fixed 1 6 7 8 10 9 2 4 5 3 Embrace Market Pricing The market is an effective information-processing machine. Millions of participants buy and sell securities in the world markets every day, and the real-time information they bring helps set prices. Don’t Try to Outguess the Market The market’s pricing power works against mutual fund managers who try to outperform through stock picking or market timing. As evidence, only 17% of US equity mutual funds and 18% of fixed income funds have survived and outperformed their benchmarks over the past 15 years. Resist Chasing Past Performance Some investors select mutual funds based on past returns. However, research shows that most funds in the top quartile (25%) of previous five-year returns did not maintain a top-quartile ranking for one-year returns in the following year. Past performance offers little insight into a fund’s future returns. Let Markets Work for You The financial markets have rewarded long-term investors. People expect a positive return on the capital they supply, and historically, the equity and bond markets have provided growth of wealth that has more than offset inflation. Practice Smart Diversification Diversification helps reduce risks that have no expected return, but diversifying within your home market is not enough. Global diversification can broaden your investment universe. Avoid Market Timing You never know which market segments will outperform from year to year. By holding a globally diversified portfolio, investors are well positioned to seek returns wherever they occur. Manage Your Emotions Many people struggle to separate their emotions from investing. Markets go up and down. Reacting to current market conditions may lead to making poor investment decisions. Focus on What You Can Control A financial advisor can offer expertise and guidance to help you focus on actions that add value. This can lead to a better investment experience. Look Beyond the Headlines Daily market news and commentary can challenge your investment discipline. Some messages stir anxiety about the future, while others tempt you to chase the latest investment fad. When headlines unsettle you, consider the source and maintain a long-term perspective. Dimensions of Expected Returns Consider the Drivers of Returns EQUITIES Market (Equity premium—stocks vs. bonds) Company Size (Small cap premium—small vs. large companies) Relative Price (Value premium—value vs. growth companies) Profitability (Profitability premium—high vs. low profitability companies) FIXED INCOME Term (Term premium—longer vs. shorter maturity bonds) Credit (Credit premium—lower vs. higher credit quality bonds)
  • 3. Academic research has identified these equity and fixed income dimensions, which point to differences in expected returns. Investors can pursue higher expected returns by structuring their portfolio around these dimensions. Past performance is no guarantee of future results. Indices are not available for direct investment. Their performance does not reflect the expenses associated with the management of an actual portfolio. Diversification does not eliminate the risk of market loss. There is no guarantee investment strategies will be successful. This information is for illustrative purposes only. See back page for additional exhibit information and important disclosures. Growth of a Dollar, 1926–2016 (compounded monthly) Annual Returns by Market Index Avoid Reactive Investing US-Based Mutual Fund Performance, 2002–2016 Percentage of Top-Ranked Funds That Stayed on Top 82.7 MILLION Number of Trades Dollar Volume $346.4 BILLION World Equity Trading in 2016 (daily average) Home Market Index Portfolio Global Market Index Portfolio S&P 500 Index 1 Country, 500 stocks MSCI ACWI Investable Market Index (IMI) 46 countries, 8,628 stocks THE TOP 10 FUNDS TO OWN RETIRE RICH SELL STOCKS NOW! MARKET HITS RECORD HIGH! HOUSING MARKET BOOM! THE LOOMING RECESSION 451 Winners 1,253 Survivors 2,587 Beginning 17% 48% Equity 174 Winners 547 Survivors 958 Beginning 18% 57% Fixed Income Previous 5 Years Funds Remaining in Top Quartile of Annual Returns in Following Year (2007-2016 average) TOP 25% 100% Equity Fixed Income 23% 27% Elation Fear Optimism Nervousness Optimism Create an investment plan to fit your needs and risk tolerance Structure a portfolio along the dimensions of expected returns Diversify globally Manage expenses, turnover, and taxes Stay disciplined through market dips and swings $20,544 US Small Cap $6,031 US Large Cap $134 Long-Term Government Bonds $21 Treasury Bills $13 US Inflation 1926 1946 19861966 20061936 1956 19961976 2016 2002 2004 2006 2008 2010 2012 2014 2016 HIGHER RETURN LOWER RETURN US Large Cap US Large Cap Value US Small Cap US Small Cap Value US Real Estate Intl. Large Cap Value Intl. Small Cap Value Emerging Markets Five-Year US Govt. Fixed 1 6 7 8 10 9 2 4 5 3 Embrace Market Pricing The market is an effective information-processing machine. Millions of participants buy and sell securities in the world markets every day, and the real-time information they bring helps set prices. Don’t Try to Outguess the Market The market’s pricing power works against mutual fund managers who try to outperform through stock picking or market timing. As evidence, only 17% of US equity mutual funds and 18% of fixed income funds have survived and outperformed their benchmarks over the past 15 years. Resist Chasing Past Performance Some investors select mutual funds based on past returns. However, research shows that most funds in the top quartile (25%) of previous five-year returns did not maintain a top-quartile ranking for one-year returns in the following year. Past performance offers little insight into a fund’s future returns. Let Markets Work for You The financial markets have rewarded long-term investors. People expect a positive return on the capital they supply, and historically, the equity and bond markets have provided growth of wealth that has more than offset inflation. Practice Smart Diversification Diversification helps reduce risks that have no expected return, but diversifying within your home market is not enough. Global diversification can broaden your investment universe. Avoid Market Timing You never know which market segments will outperform from year to year. By holding a globally diversified portfolio, investors are well positioned to seek returns wherever they occur. Manage Your Emotions Many people struggle to separate their emotions from investing. Markets go up and down. Reacting to current market conditions may lead to making poor investment decisions. Focus on What You Can Control A financial advisor can offer expertise and guidance to help you focus on actions that add value. This can lead to a better investment experience. Look Beyond the Headlines Daily market news and commentary can challenge your investment discipline. Some messages stir anxiety about the future, while others tempt you to chase the latest investment fad. When headlines unsettle you, consider the source and maintain a long-term perspective. Dimensions of Expected Returns Consider the Drivers of Returns EQUITIES Market (Equity premium—stocks vs. bonds) Company Size (Small cap premium—small vs. large companies) Relative Price (Value premium—value vs. growth companies) Profitability (Profitability premium—high vs. low profitability companies) FIXED INCOME Term (Term premium—longer vs. shorter maturity bonds) Credit (Credit premium—lower vs. higher credit quality bonds)
  • 4. DISCLOSURES Exhibit 1: In US dollars. Source: World Federation of Exchanges members, affiliates, correspondents, and non-members. Trade data from the global electronic order book. Daily averages were computed using year-to-date totals as of December 31, 2016, divided by 250 as an approximate number of annual trading days. Exhibit 2: The sample includes funds at the beginning of the 15-year period ending December 31, 2016. Each fund is evaluated relative to the Morningstar benchmark assigned to the fund’s category at the start of the evaluation period. Surviving funds are those with return observations for every month of the sample period. Winner funds are those that survived and whose cumulative net return over the period exceeded that of their respective Morningstar category benchmark. Exhibit 3: At the end of each year, funds are sorted within their category based on their five-year total return. Funds in the top quartile (25%) of returns are evaluated again in the following year based on one-year performance in order to determine the percentage of funds that maintained a top-quartile ranking. The analysis is repeated each year from 2007–2016. The chart shows average persistence of top-quartile funds during the 10-year period. Source (Exhibits 2 and 3): US-domiciled open-end mutual fund data is from Morningstar and Center for Research in Security Prices (CRSP) from the University of Chicago. Index funds and fund-of-funds are excluded from the sample. Equity fund sample includes the Morningstar historical categories: Diversified Emerging Markets, Europe Stock, Foreign Large Blend, Foreign Large Growth, Foreign Large Value, Foreign Small/Mid Blend, Foreign Small/Mid Growth, Foreign Small/Mid Value, Japan Stock, Large Blend, Large Growth, Large Value, Mid-Cap Blend, Mid-Cap Value, Miscellaneous Region, Pacific/Asia ex-Japan Stock, Small Blend, Small Growth, Small Value, and World Stock. Fixed income fund sample includes the Morningstar historical categories: Corporate Bond, Inflation-Protected Bond, Intermediate Government, Intermediate-Term Bond, Muni California Intermediate, Muni National Intermediate, Muni National Short, Muni New York Intermediate, Muni Single State Short, Short Government, Short-Term Bond, Ultrashort Bond, and World Bond. See Dimensional’s “Mutual Fund Landscape 2017” for more detail. Benchmark data provided by Bloomberg Barclays, MSCI, Russell, Citigroup, and S&P. Bloomberg Barclays data provided by Bloomberg. MSCI data © MSCI 2017, all rights reserved. Frank Russell Company is the source and owner of the trademarks, service marks, and copyrights related to the Russell Indexes. Citi fixed income indices © 2017 by Citigroup. The S&P data is provided by Standard & Poor’s Index Services Group. Exhibit 4: In US dollars. US Small Cap is the CRSP 6–10 Index. US Large Cap is the S&P 500 Index. Long-Term Government Bonds is the IA SBBI US LT Govt TR USD. Treasury Bills is the IA SBBI US 30 Day TBill TR USD. US Inflation is measured as changes in the US Consumer Price Index. CRSP data is provided by the Center for Research in Security Prices, University of Chicago. The S&P data is provided by Standard & Poor’s Index Services Group. Long-term government bonds and Treasury bills data provided by Ibbotson Associates via Morningstar Direct. US Consumer Price Index data is provided by the US Department of Labor Bureau of Labor Statistics. Exhibit 5: Relative price is measured by the price-to-book ratio; value stocks are those with lower price-to-book ratios. Profitability is a measure of current profitability, based on information from individual companies’ income statements. Exhibit 6: Number of holdings and countries for the S&P 500 Index and MSCI ACWI (All Country World Index) Investable Market Index (IMI) as of December 31, 2016. The S&P data is provided by Standard & Poor’s Index Services Group. MSCI data © MSCI 2017, all rights reserved. International investing involves special risks such as currency fluctuation and political instability. Investing in emerging markets may accentuate these risks. Exhibit 7: In US dollars. US Large Cap is the S&P 500 Index. US Large Cap Value is the Russell 1000 Value Index. US Small Cap is the Russell 2000 Index. US Small Cap Value is the Russell 2000 Value Index. US Real Estate is the Dow Jones US Select REIT Index. International Large Cap Value is the MSCI World ex USA Value Index (net dividends). International Small Cap Value is the MSCI World ex USA Small Cap Value Index (net dividends). Emerging Markets is the MSCI Emerging Markets Index (net dividends). Five-Year US Government Fixed is the Bloomberg Barclays US TIPS Index 1–5 Years. The S&P data is provided by Standard & Poor’s Index Services Group. Frank Russell Company is the source and owner of the trademarks, service marks, and copyrights related to the Russell Indexes. Dow Jones data provided by Dow Jones Indices. MSCI data © MSCI 2017, all rights reserved. Bloomberg Barclays data provided by Bloomberg. Chart is for illustrative purposes only. Dimensional Fund Advisors LP is an investment advisor registered with the Securities and Exchange Commission. Pursuing a Better Investment Experience Key Principles to Improve Your Odds of Success