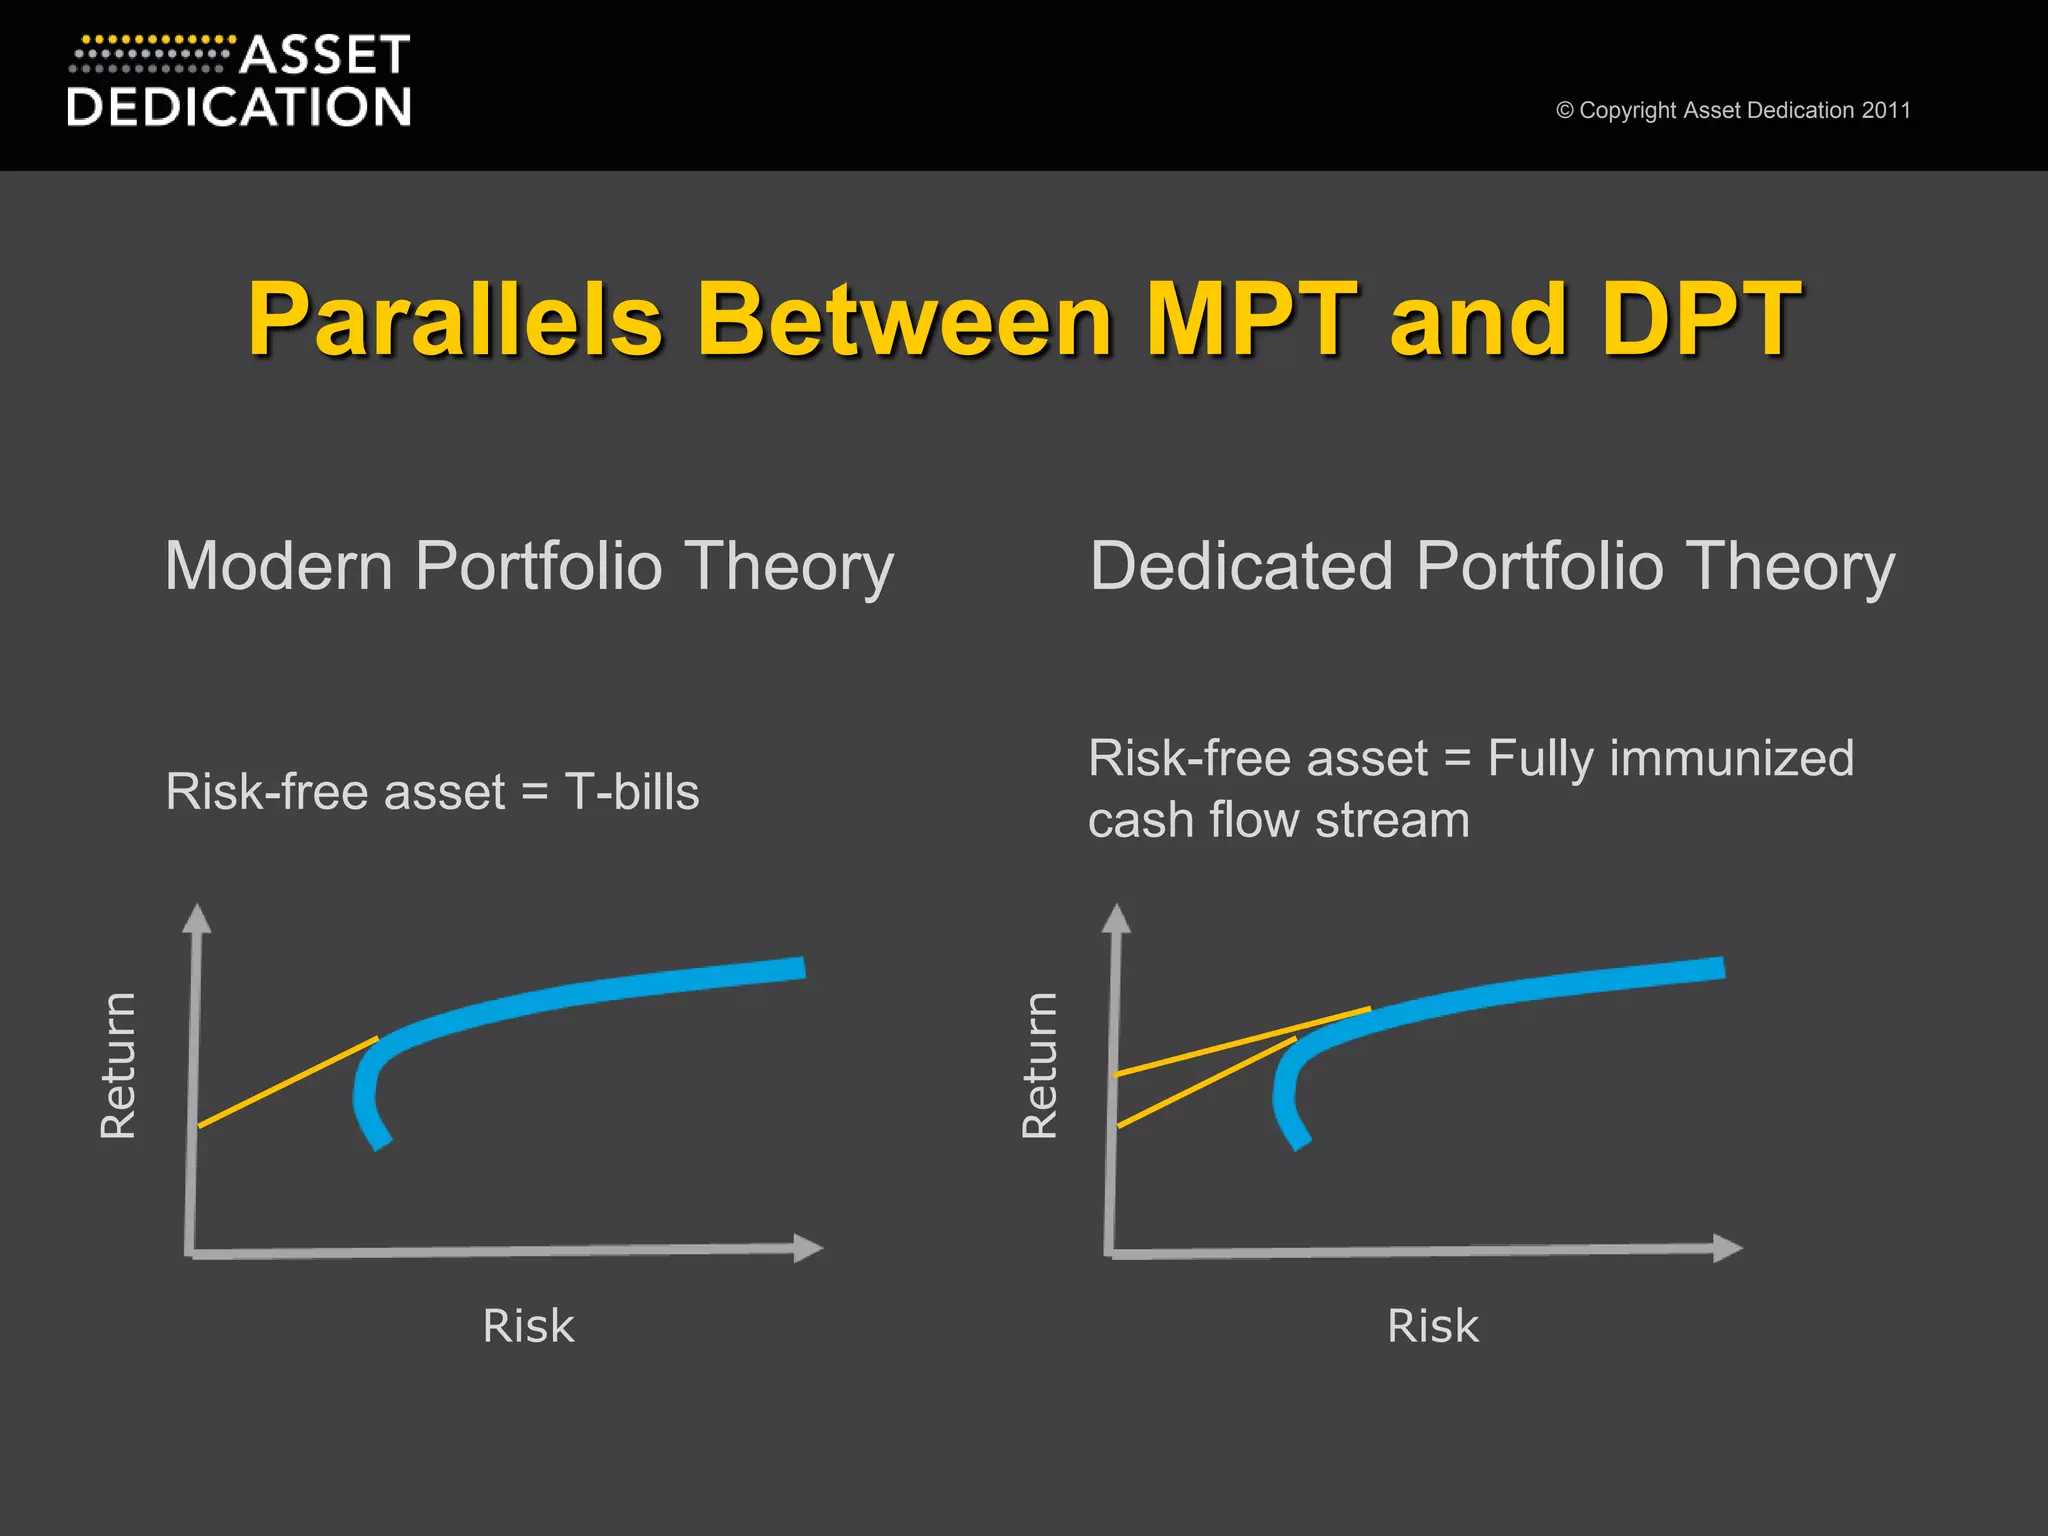
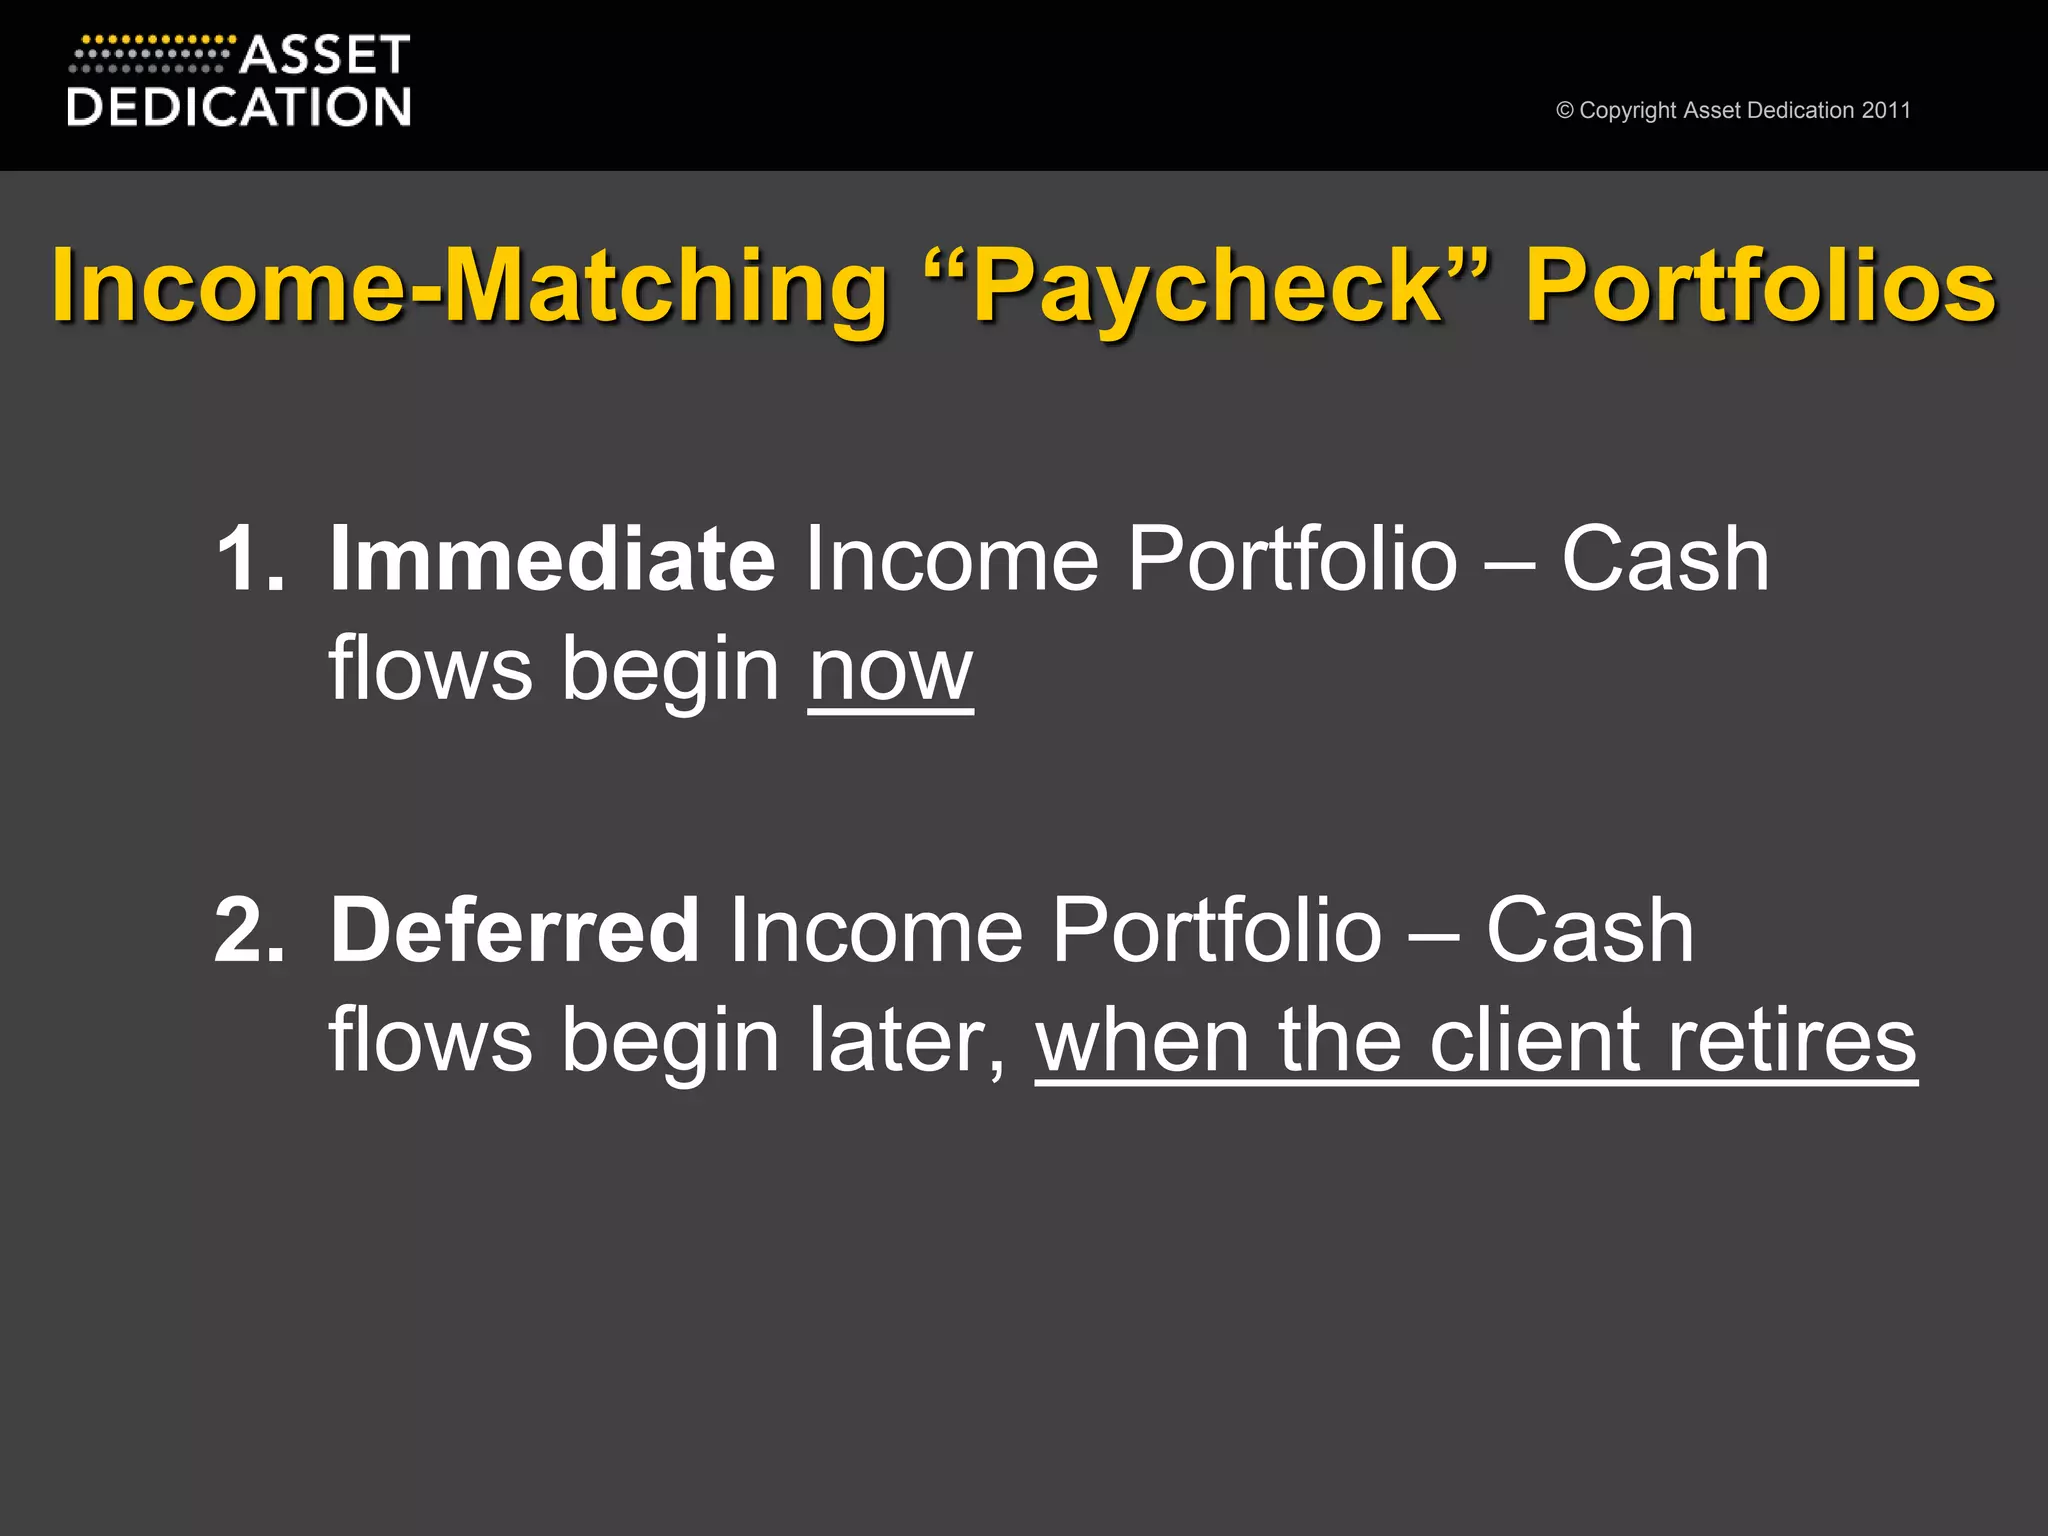
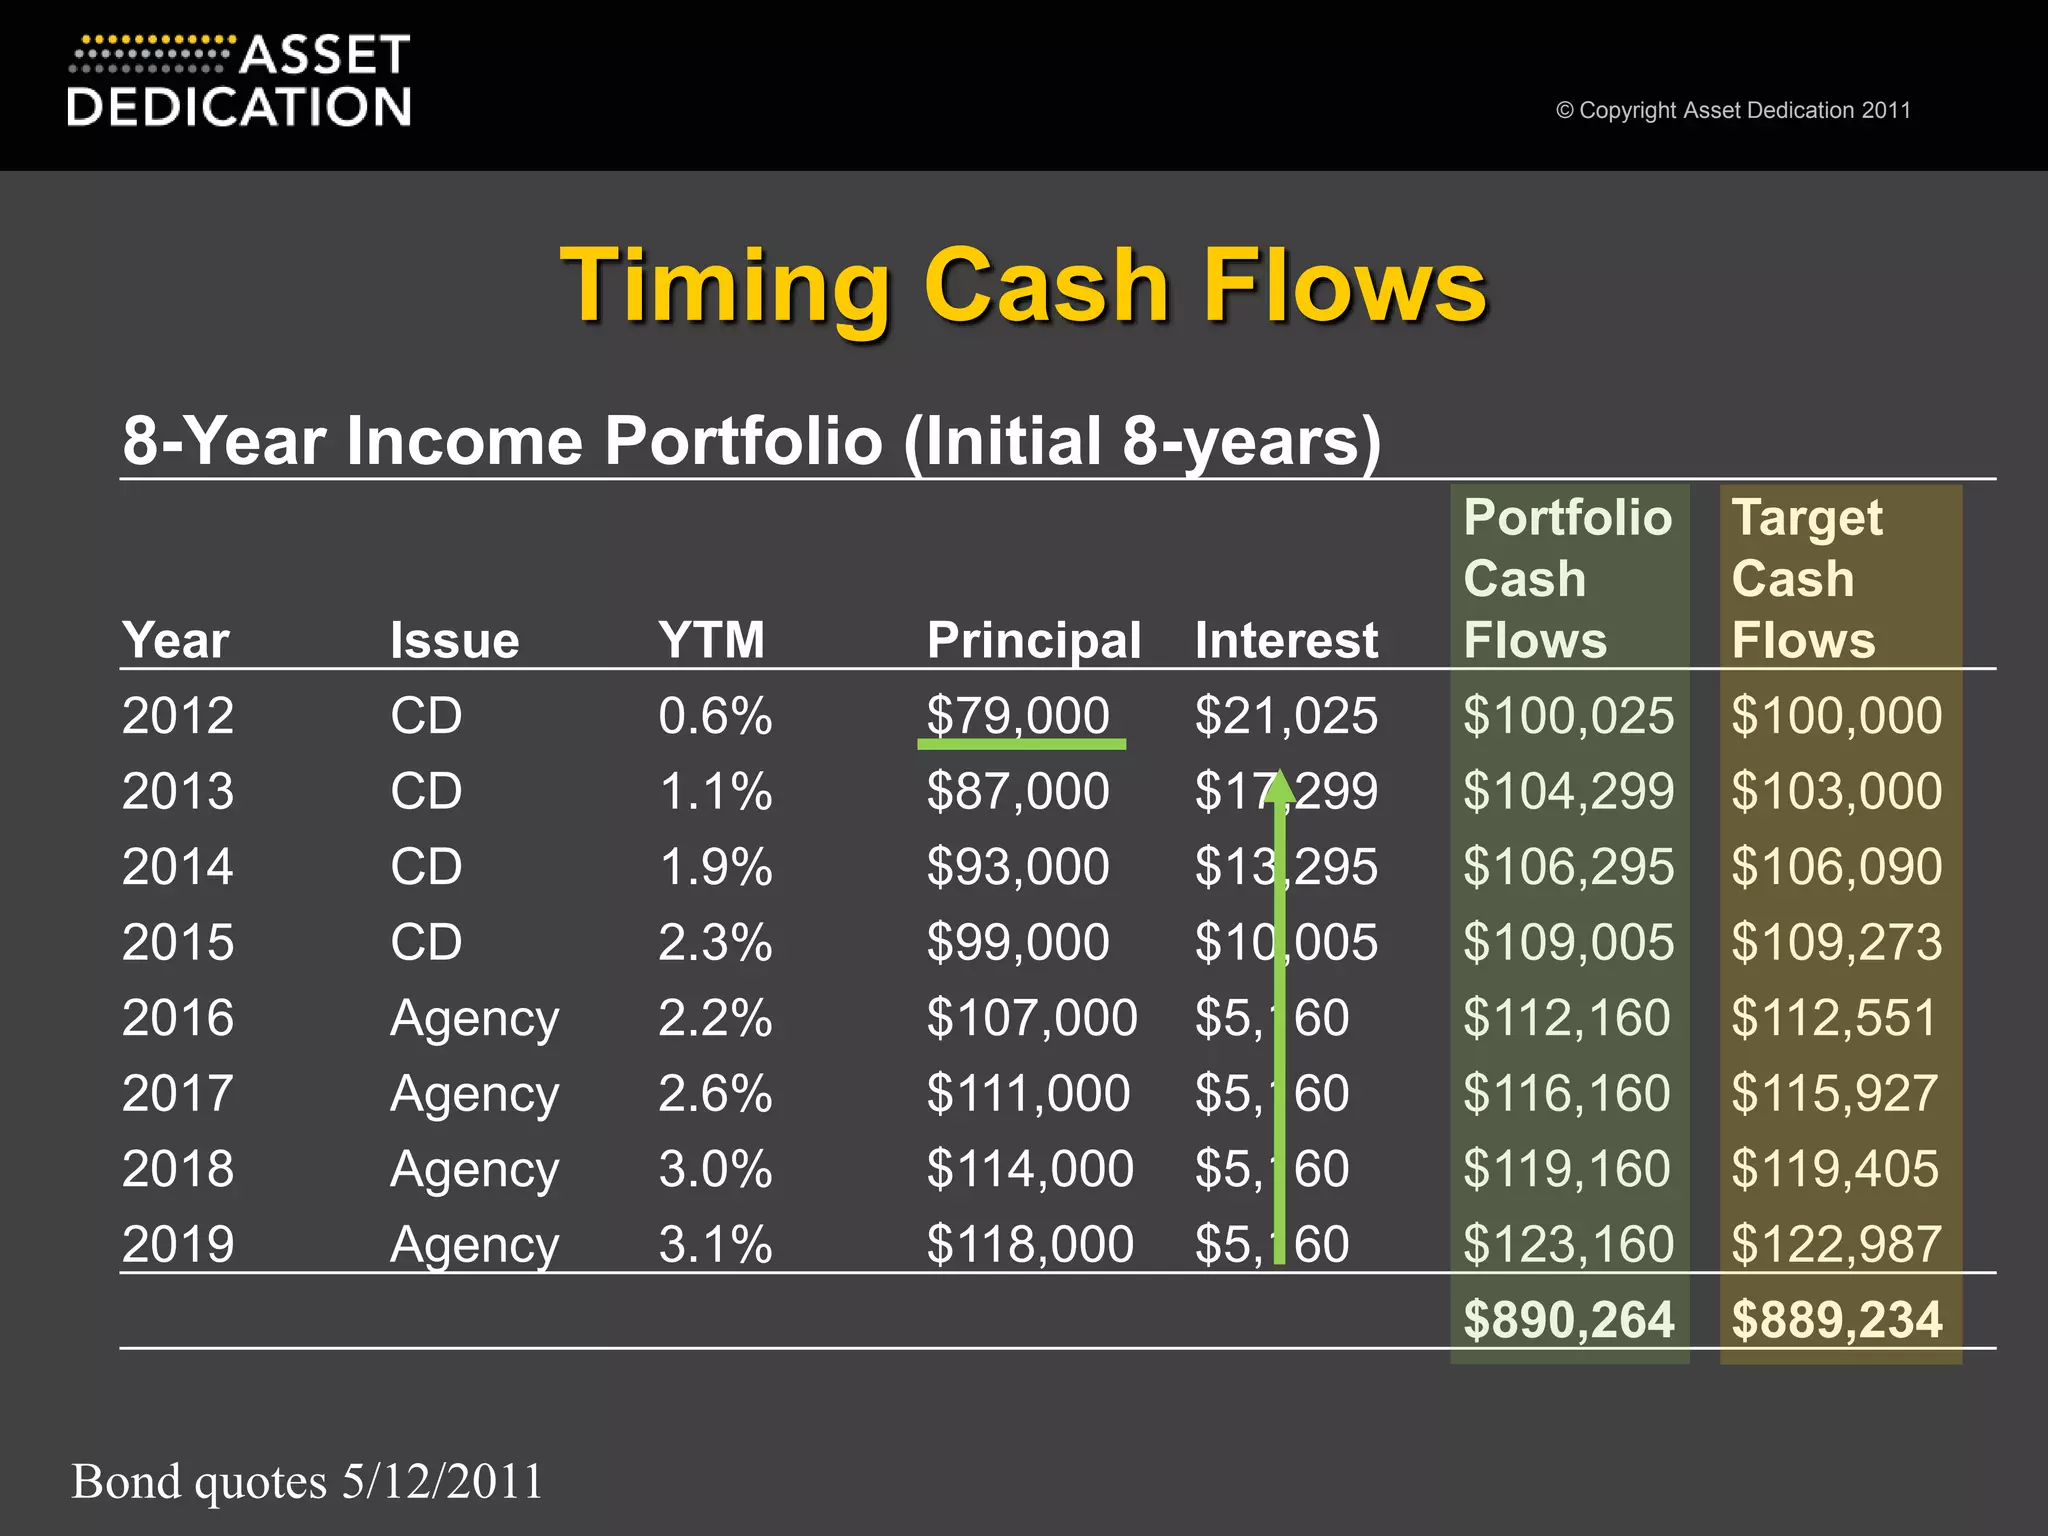
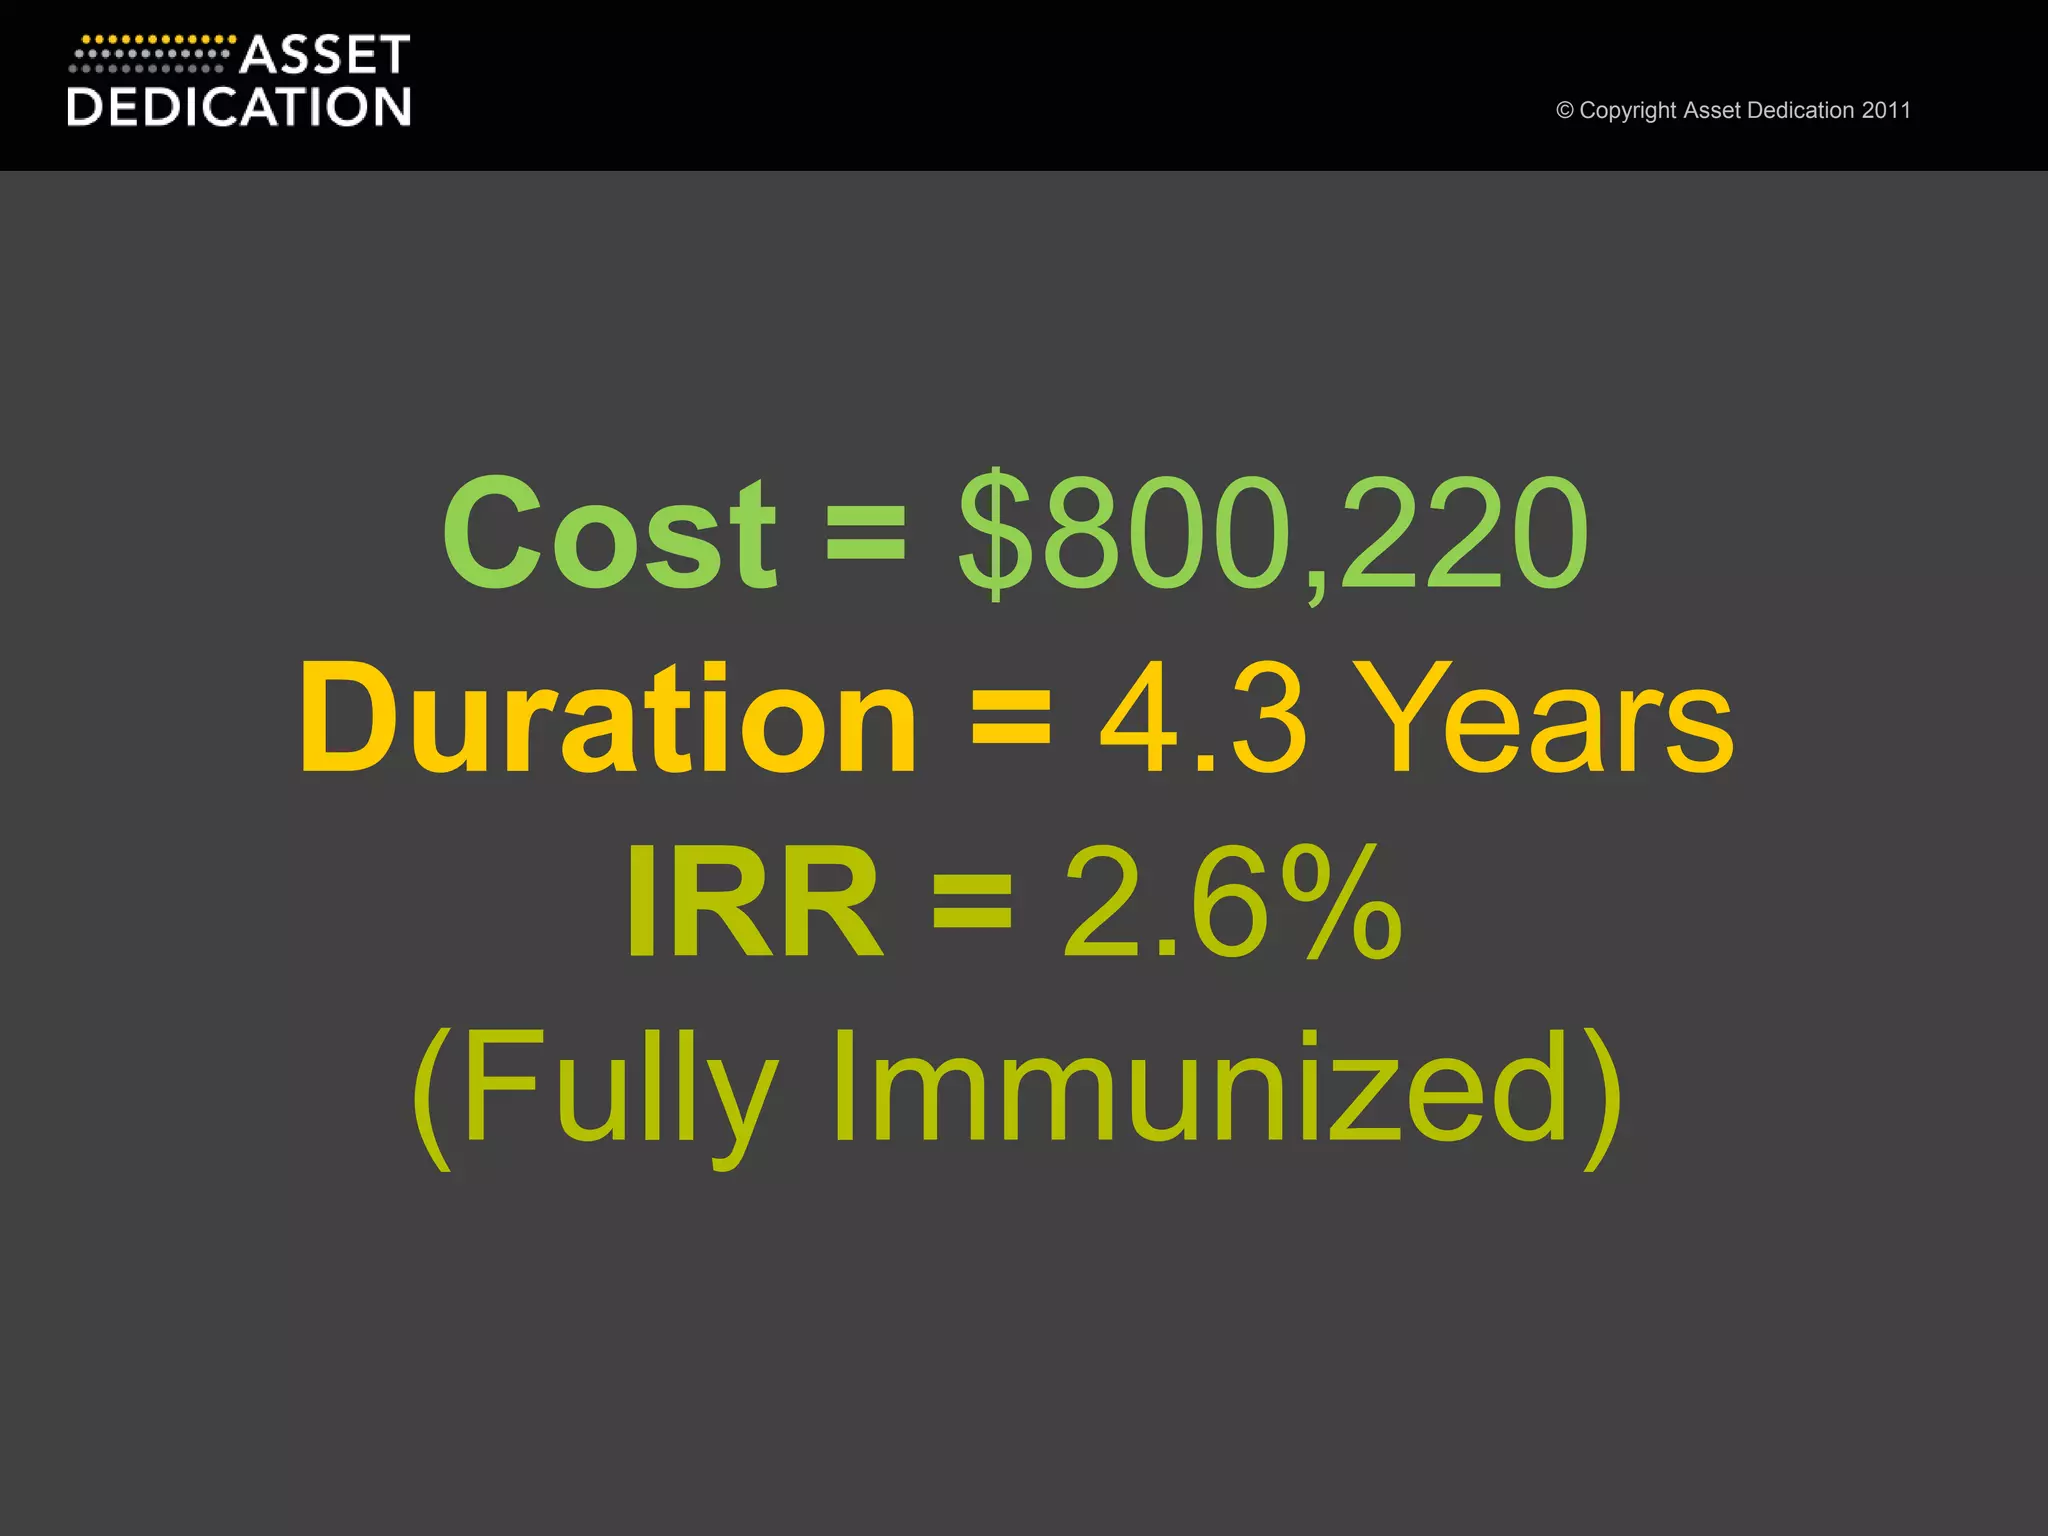
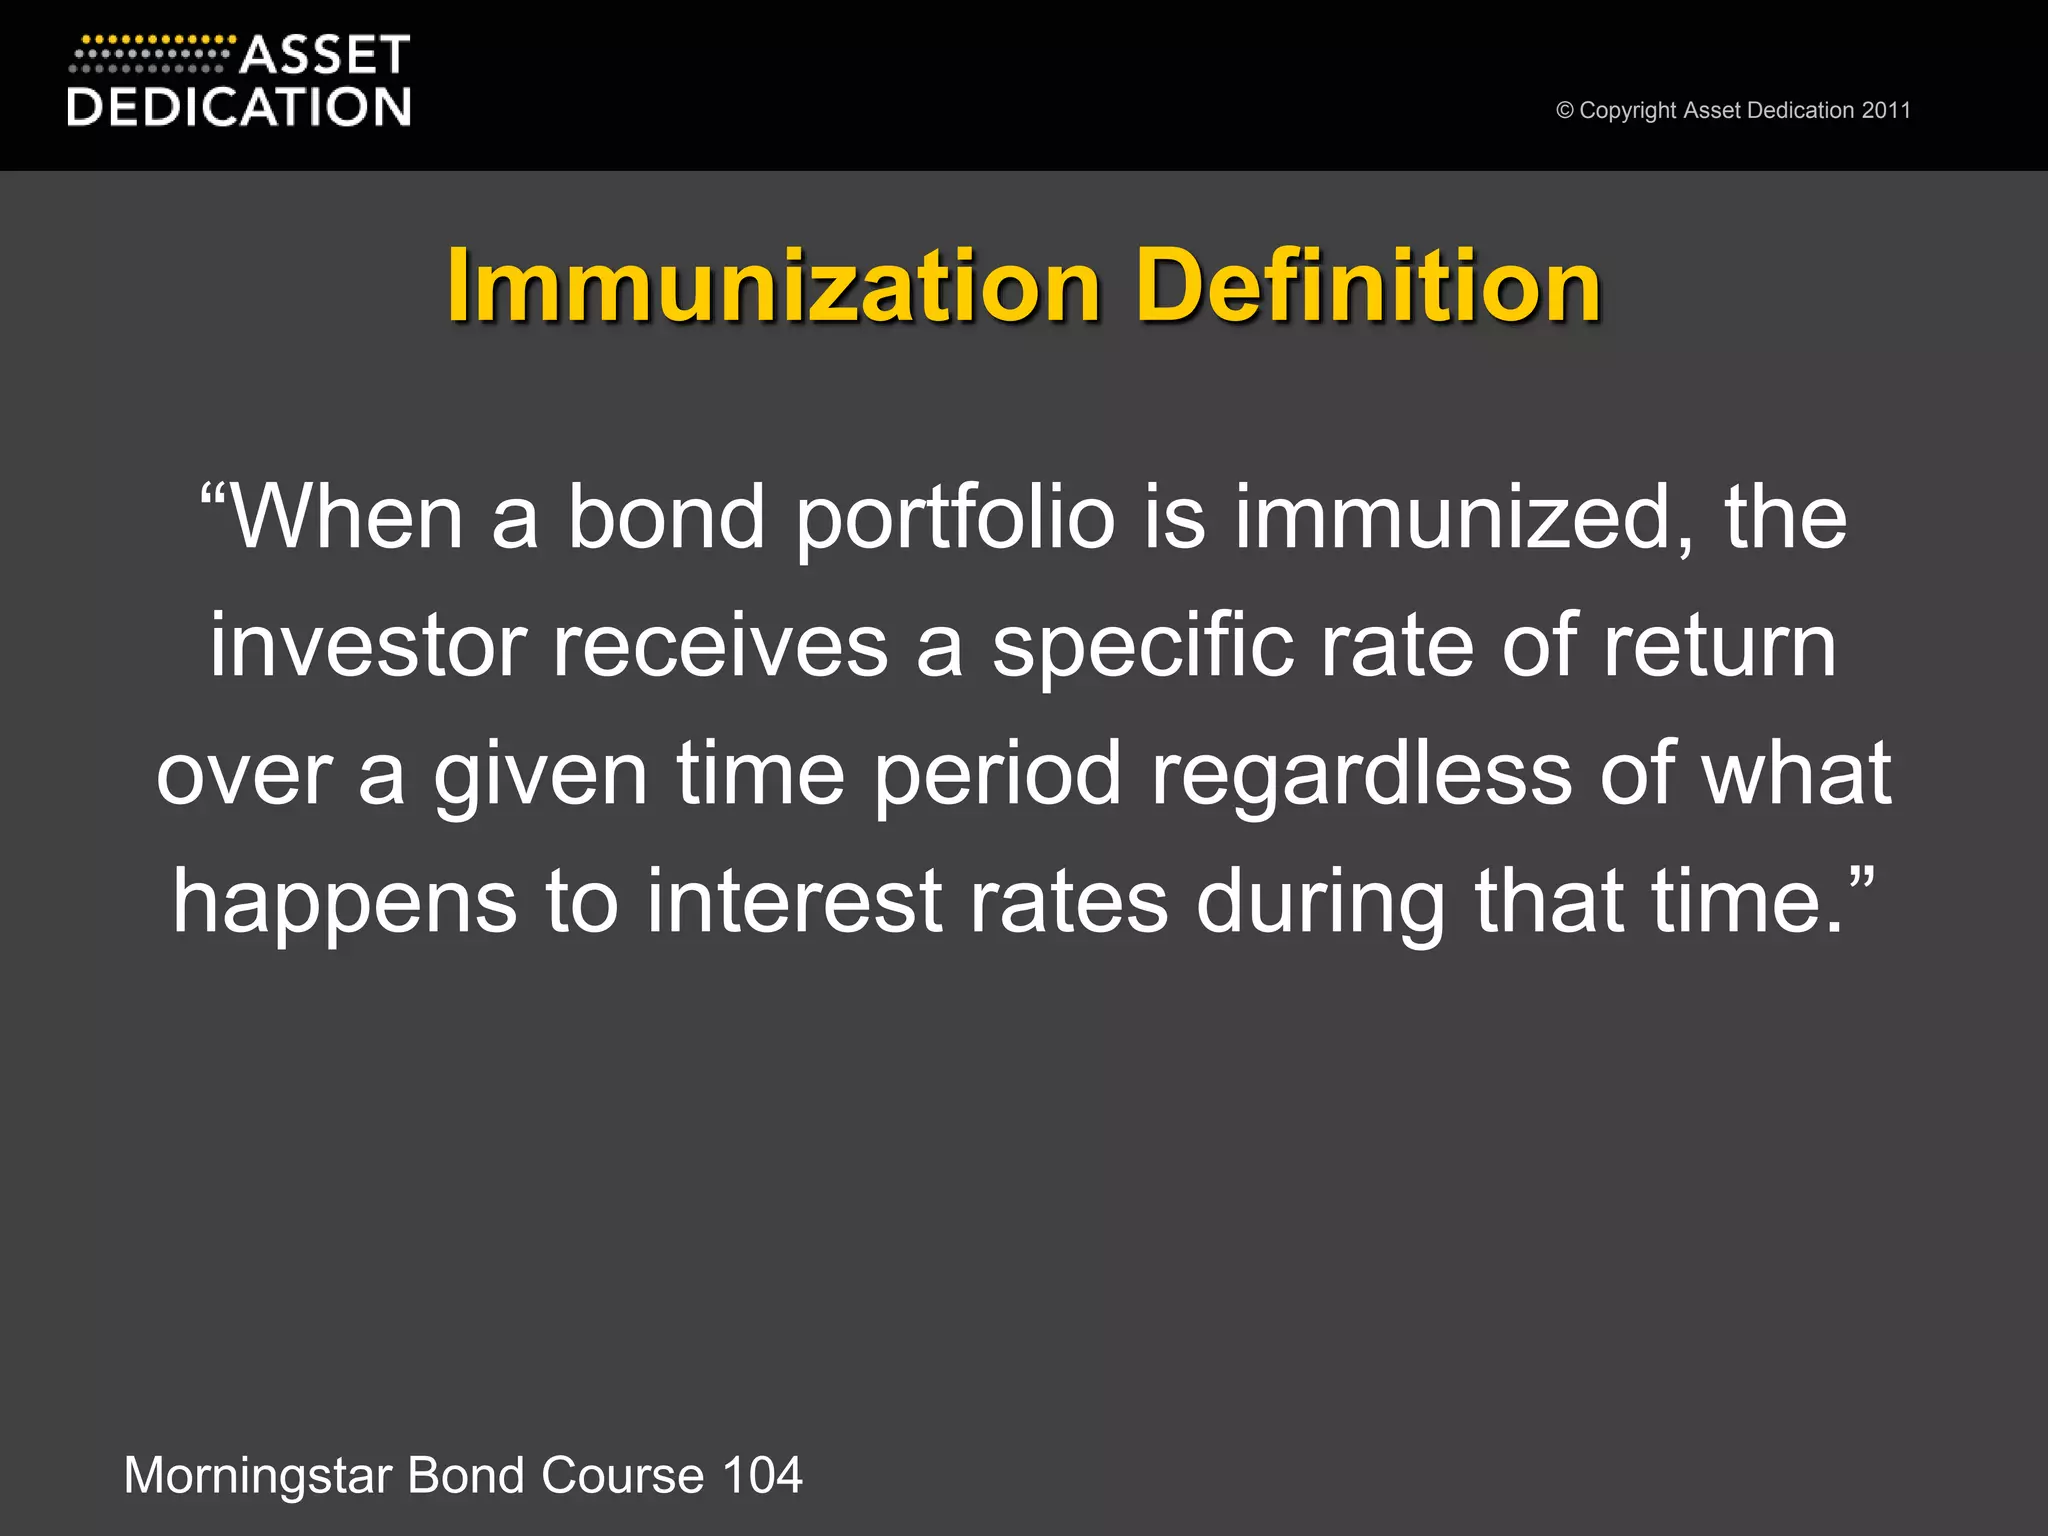
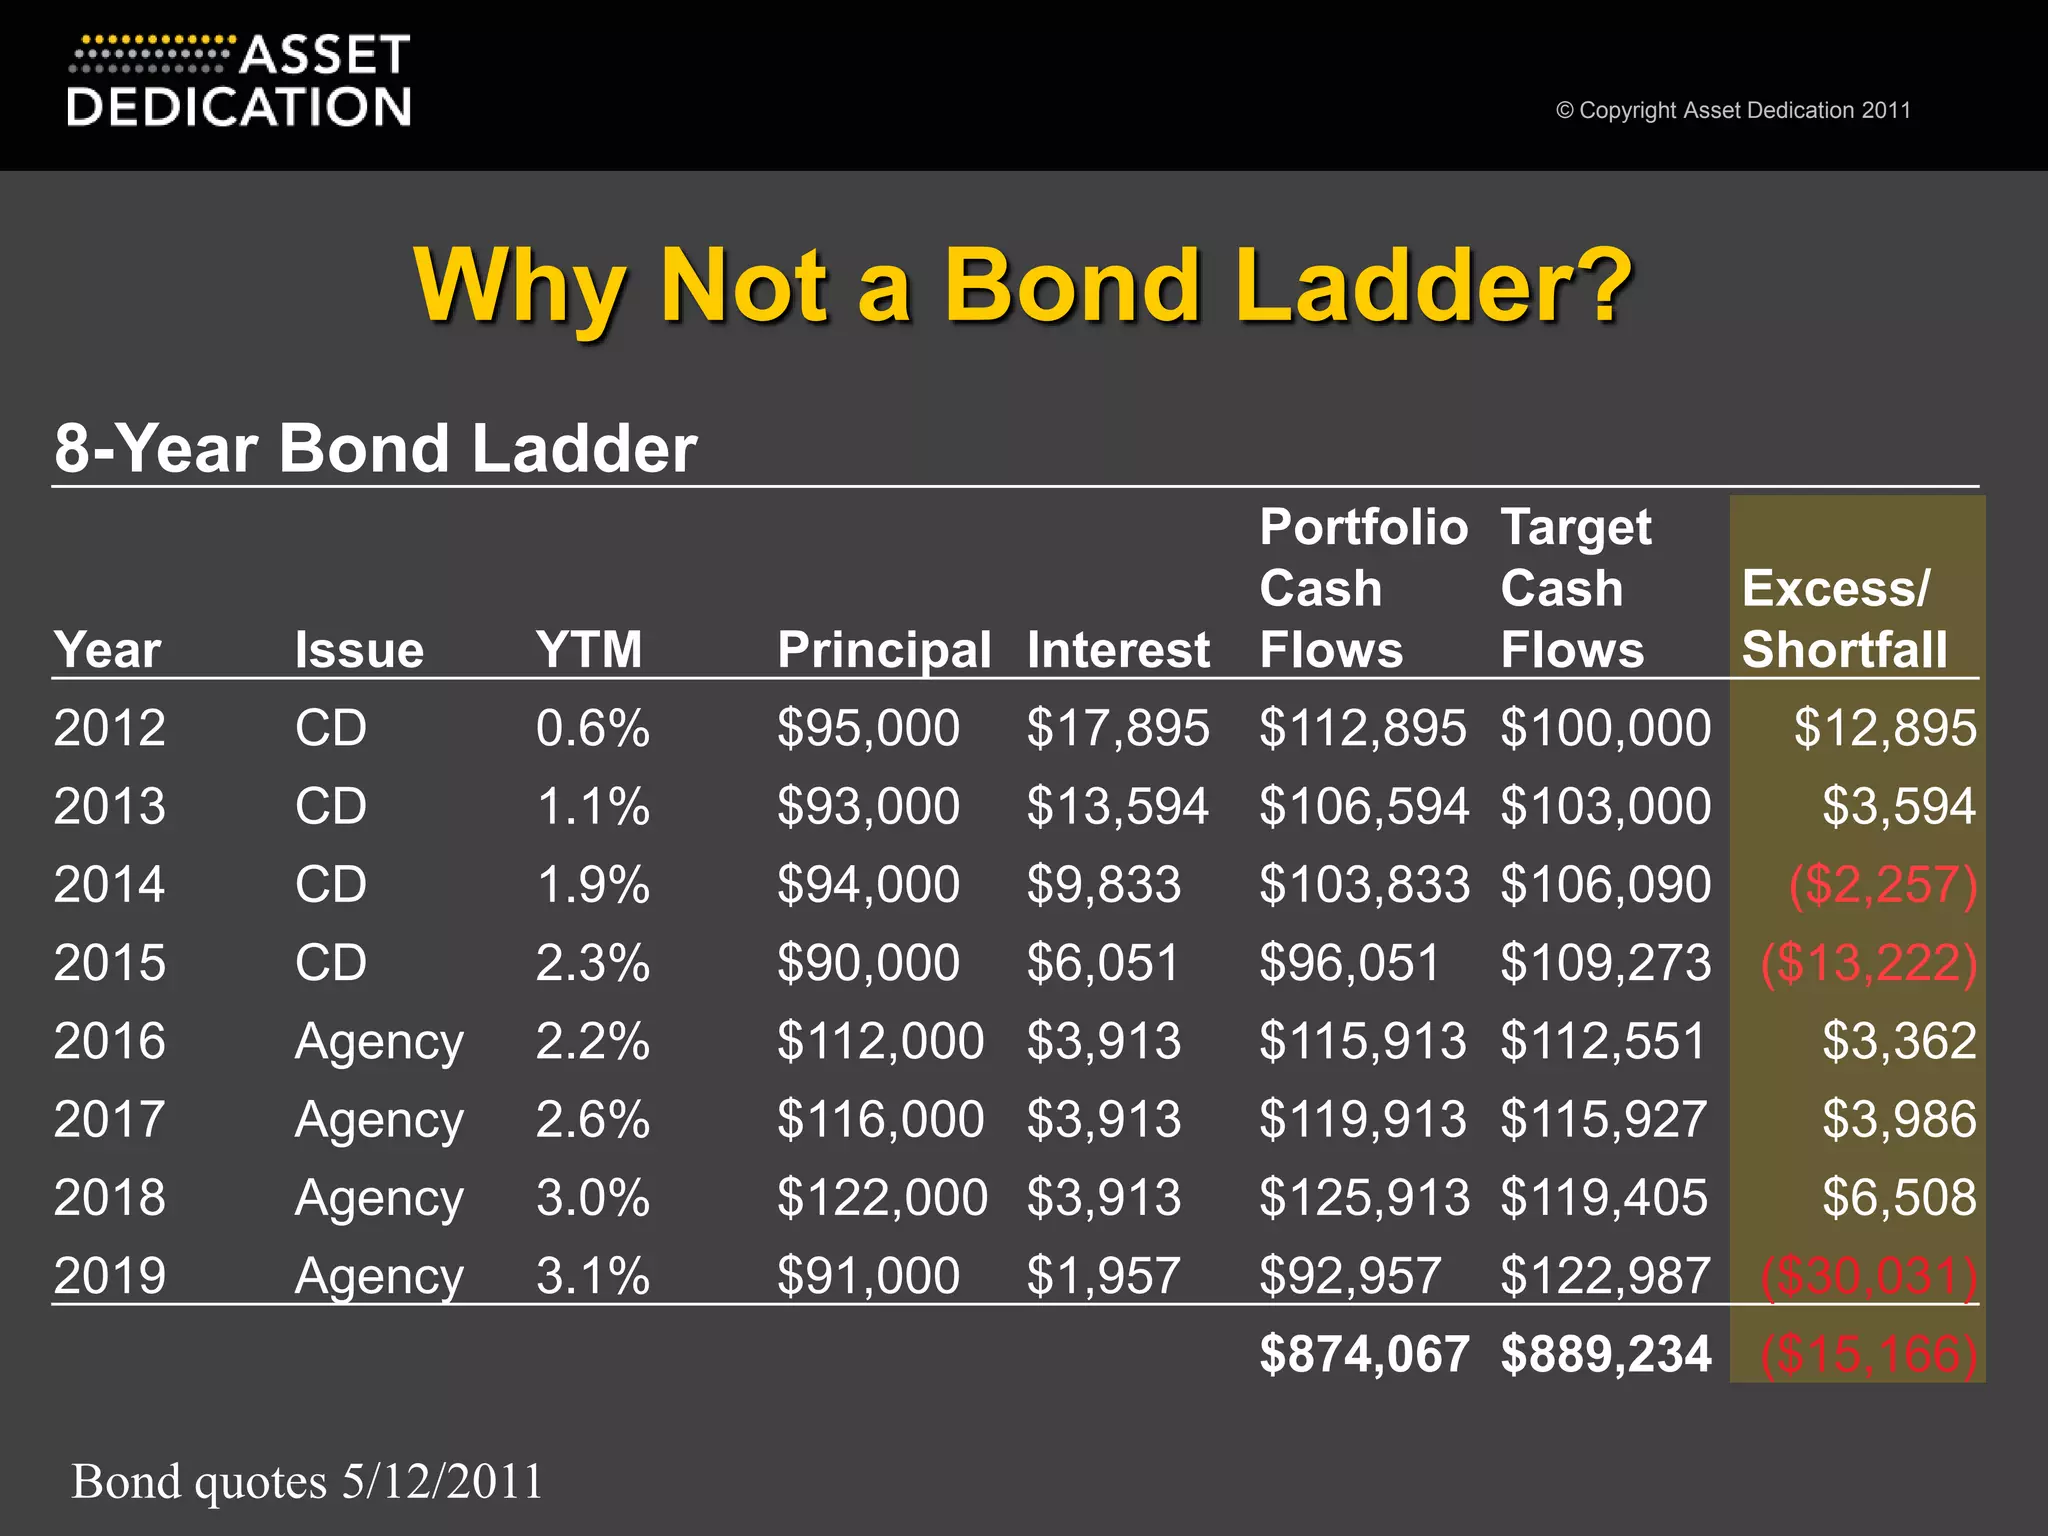
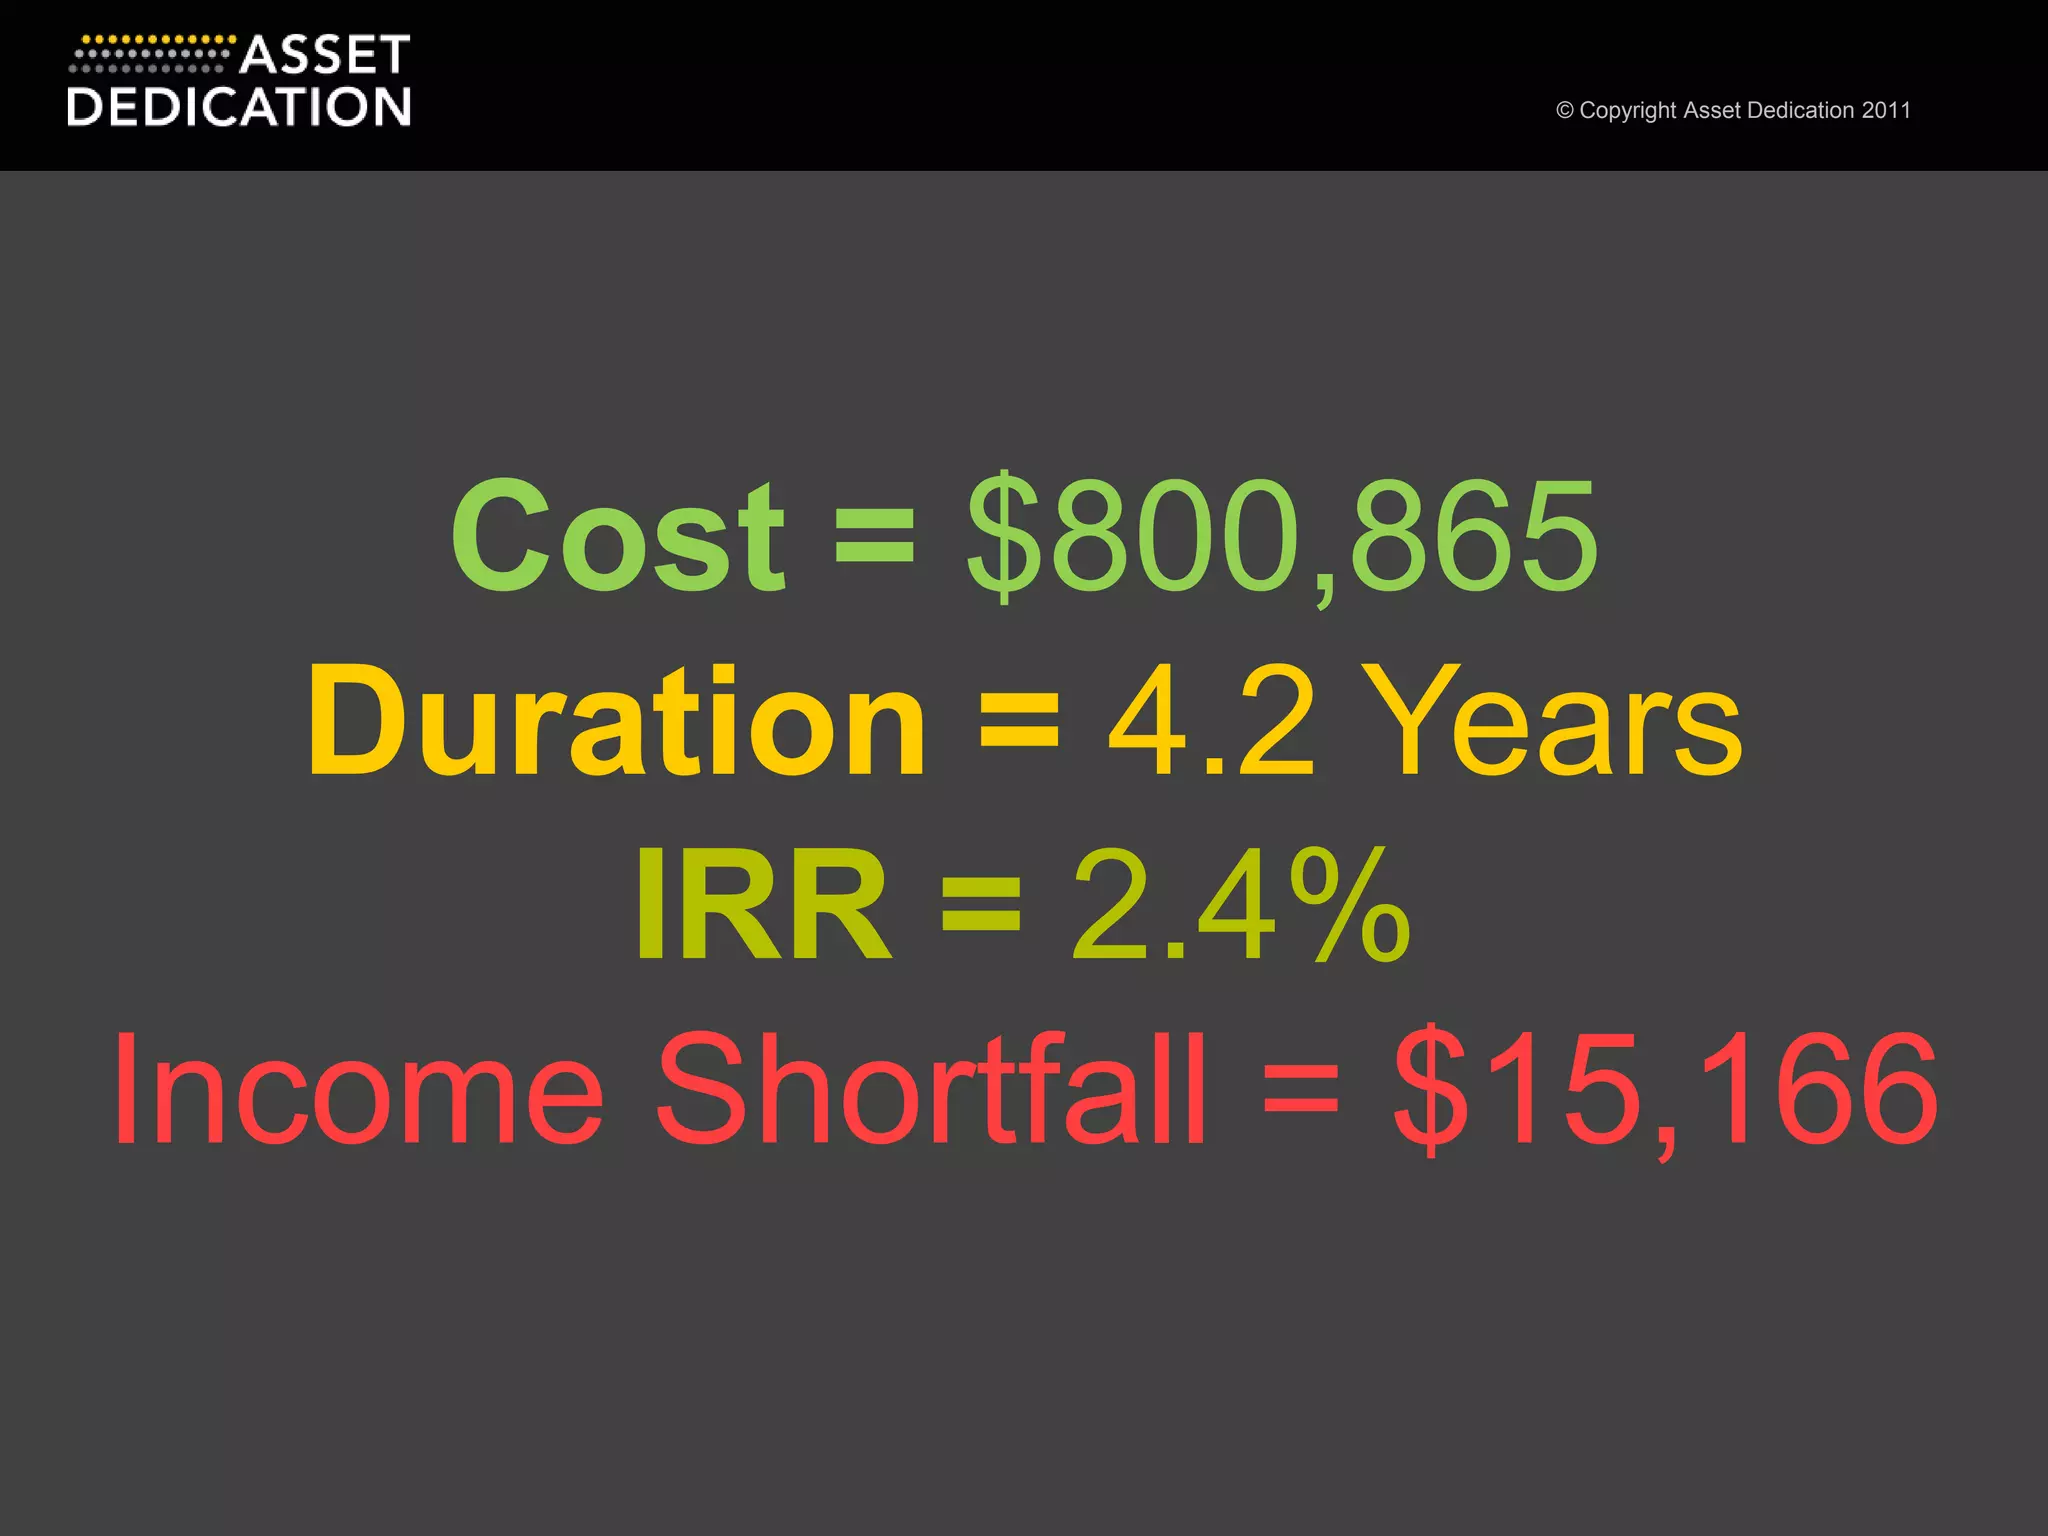
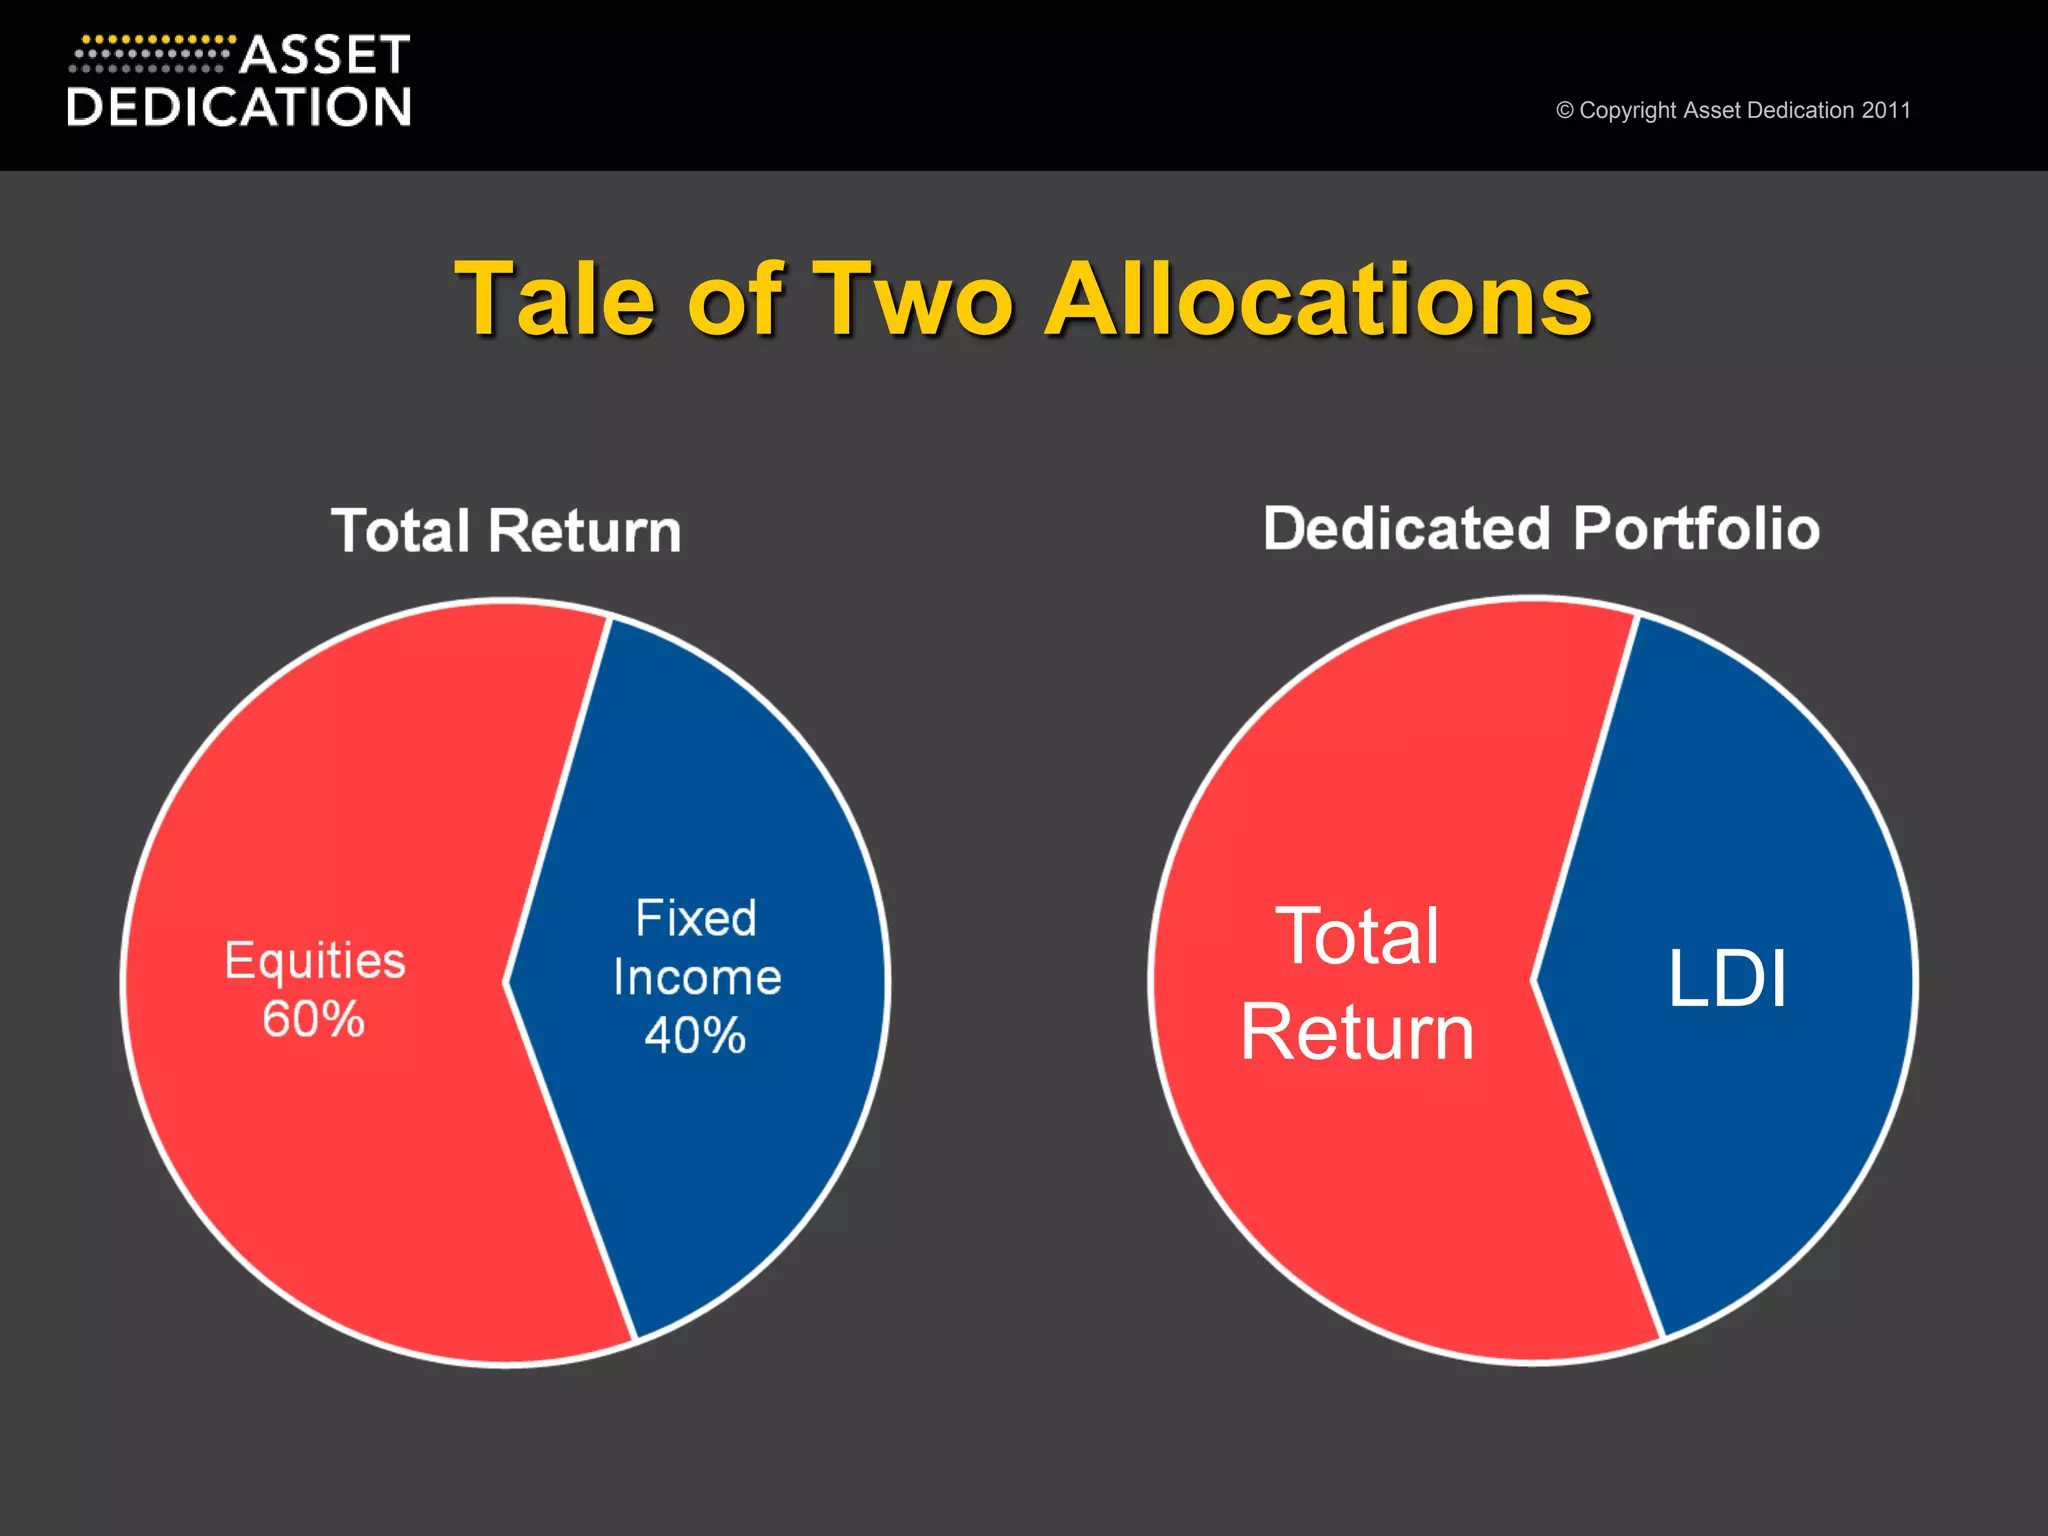
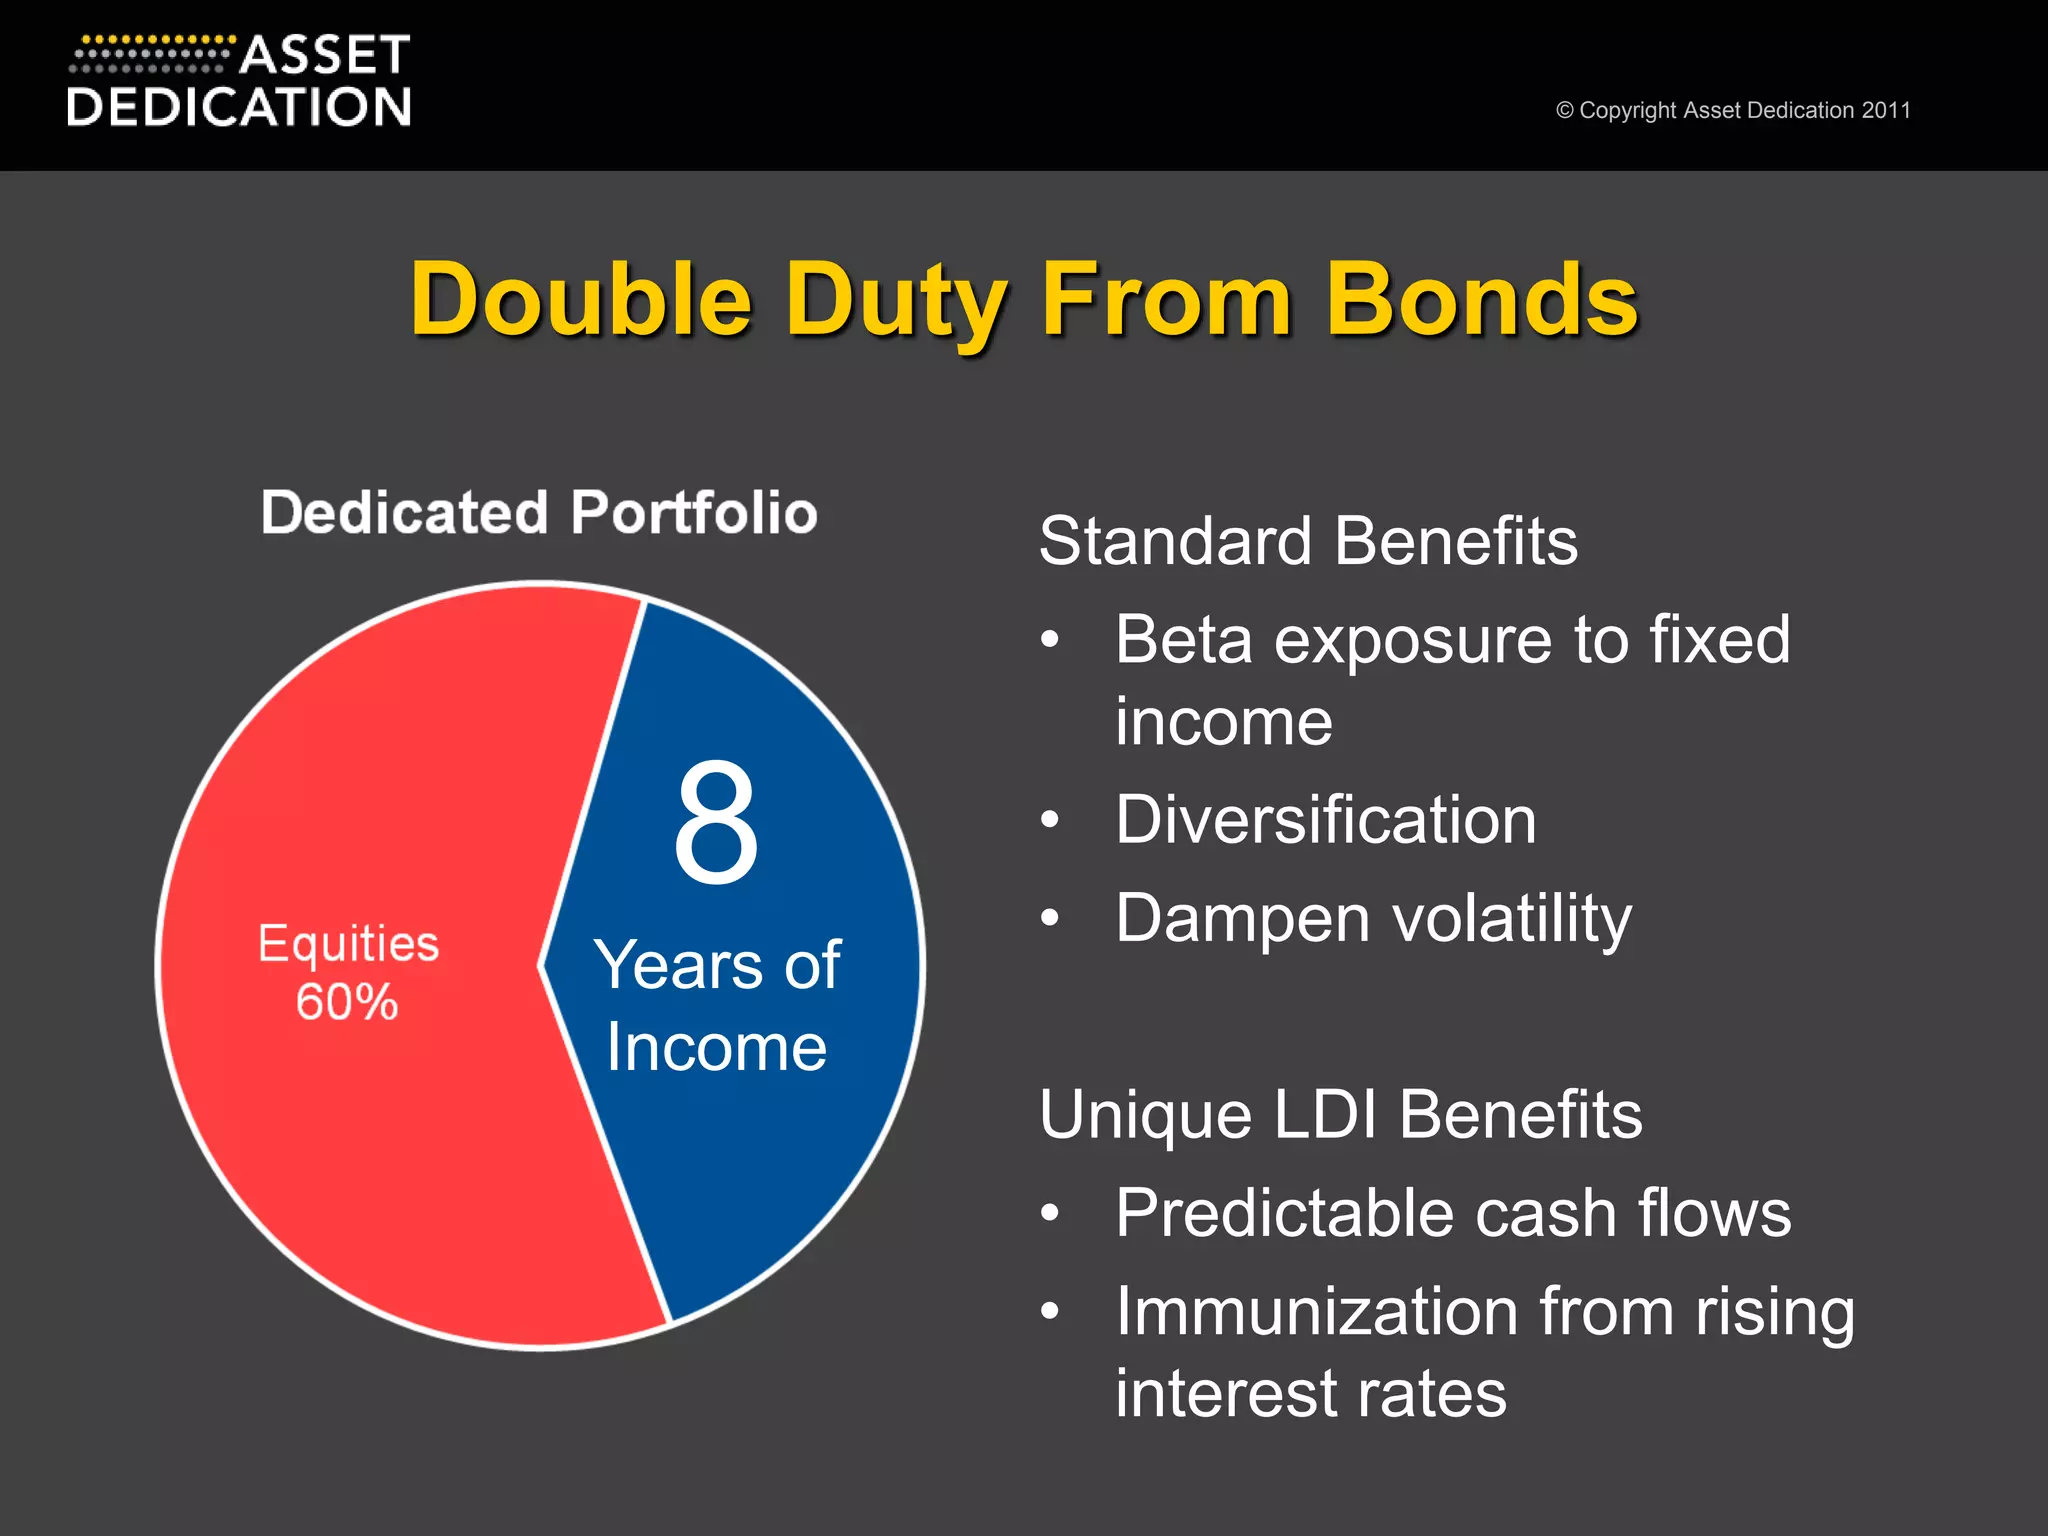
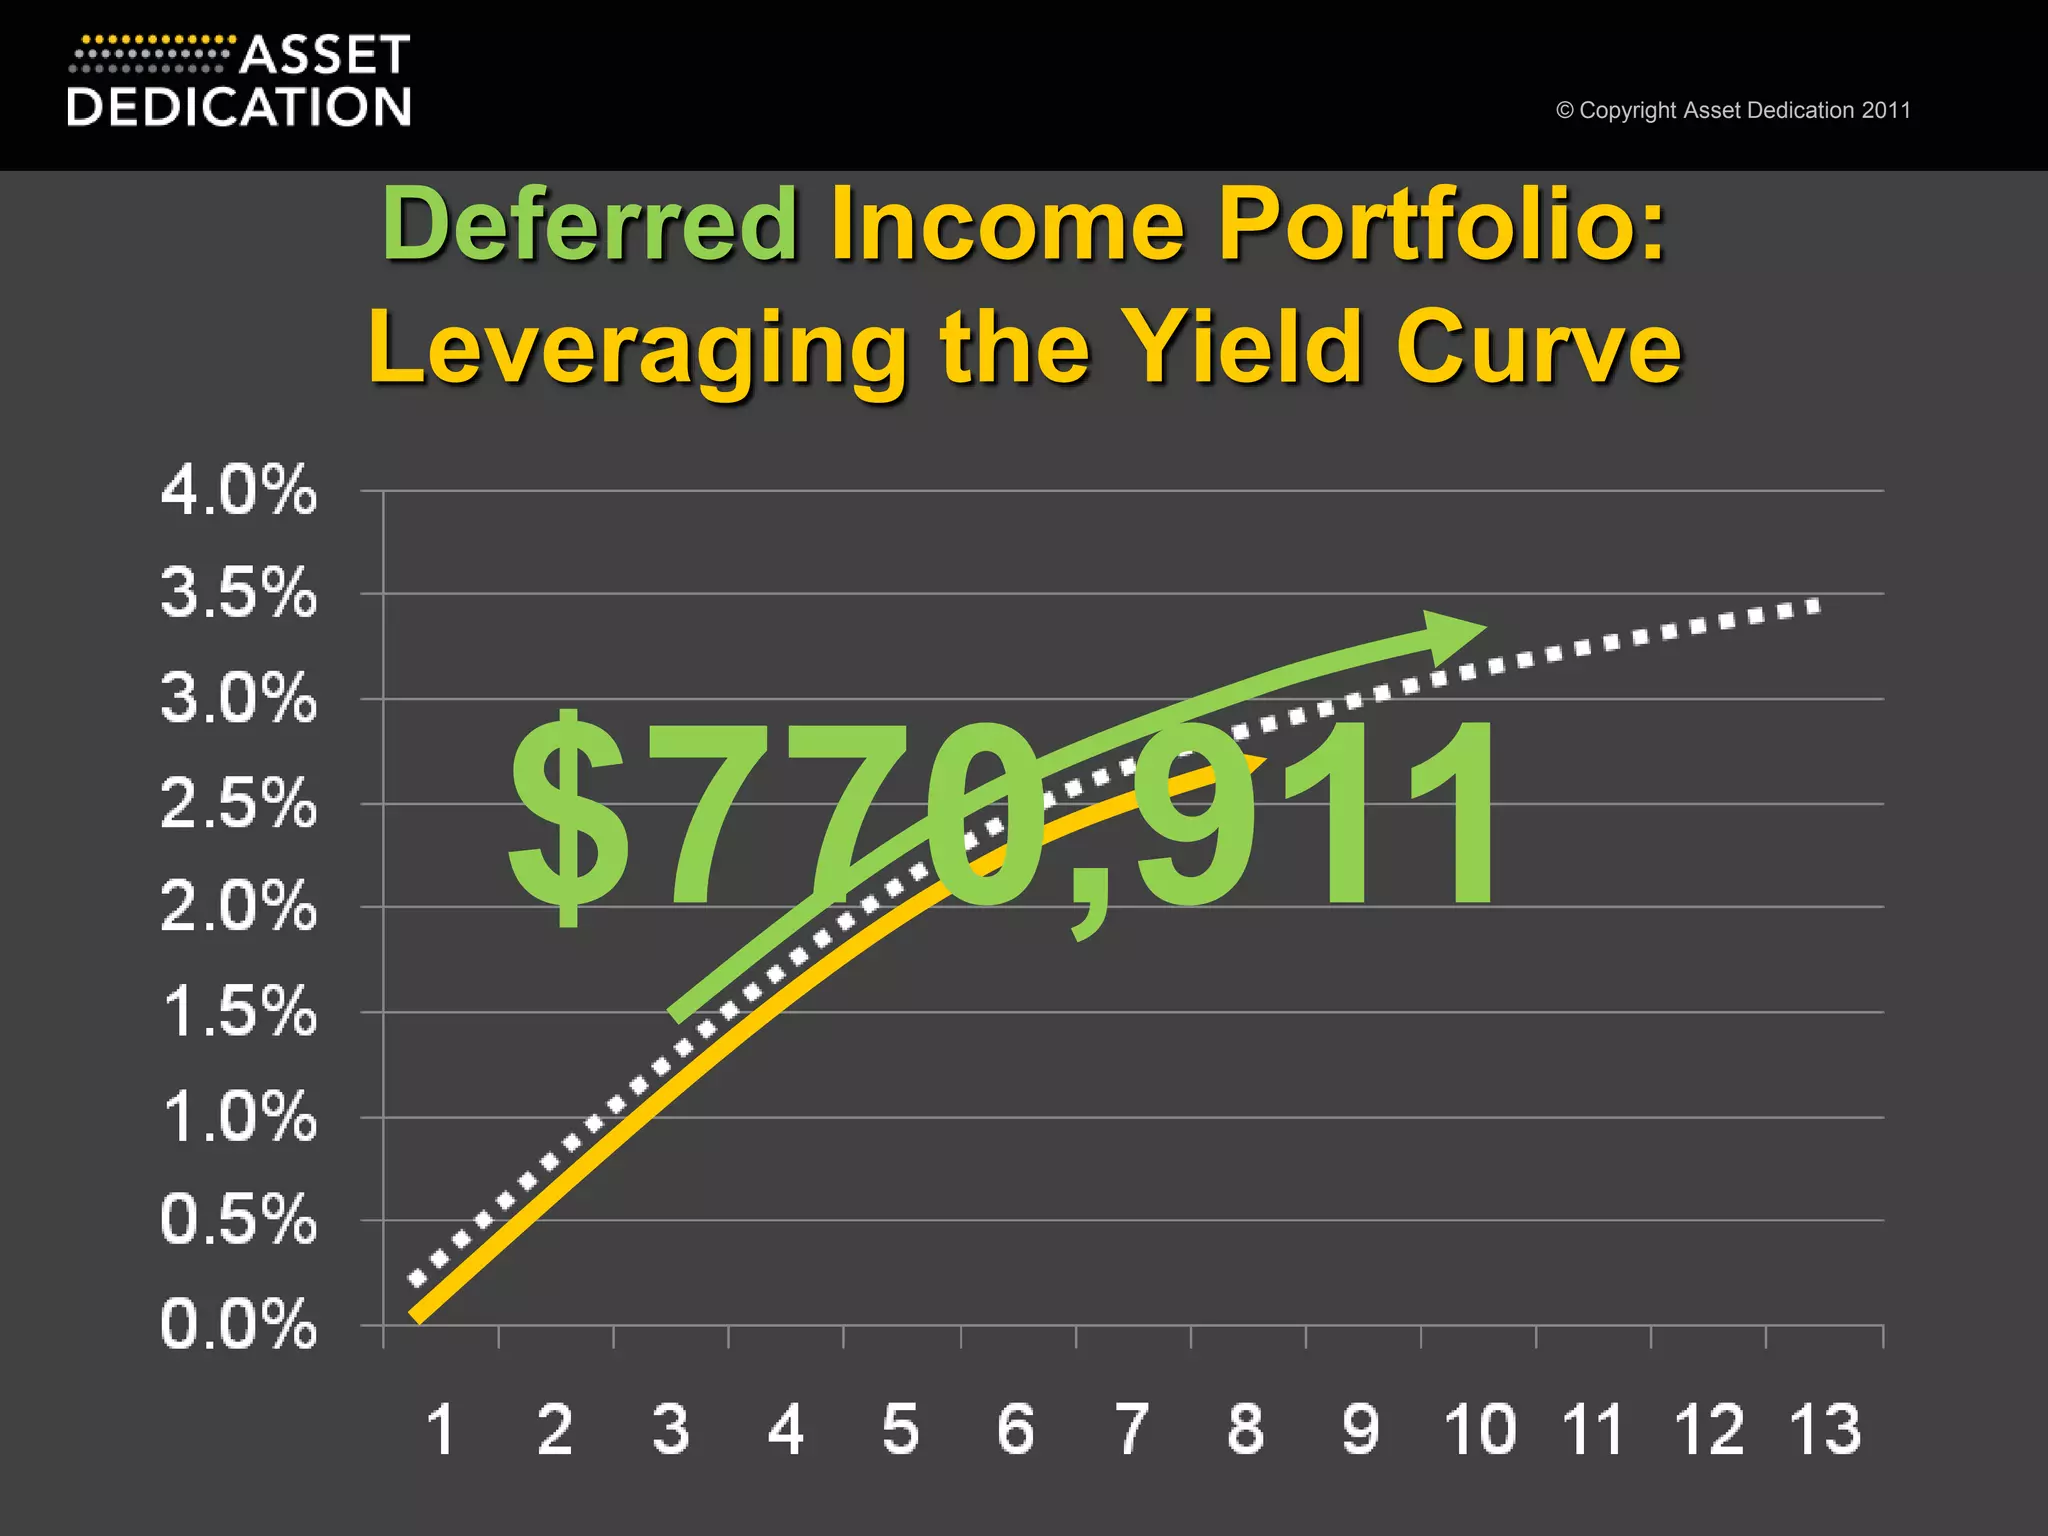
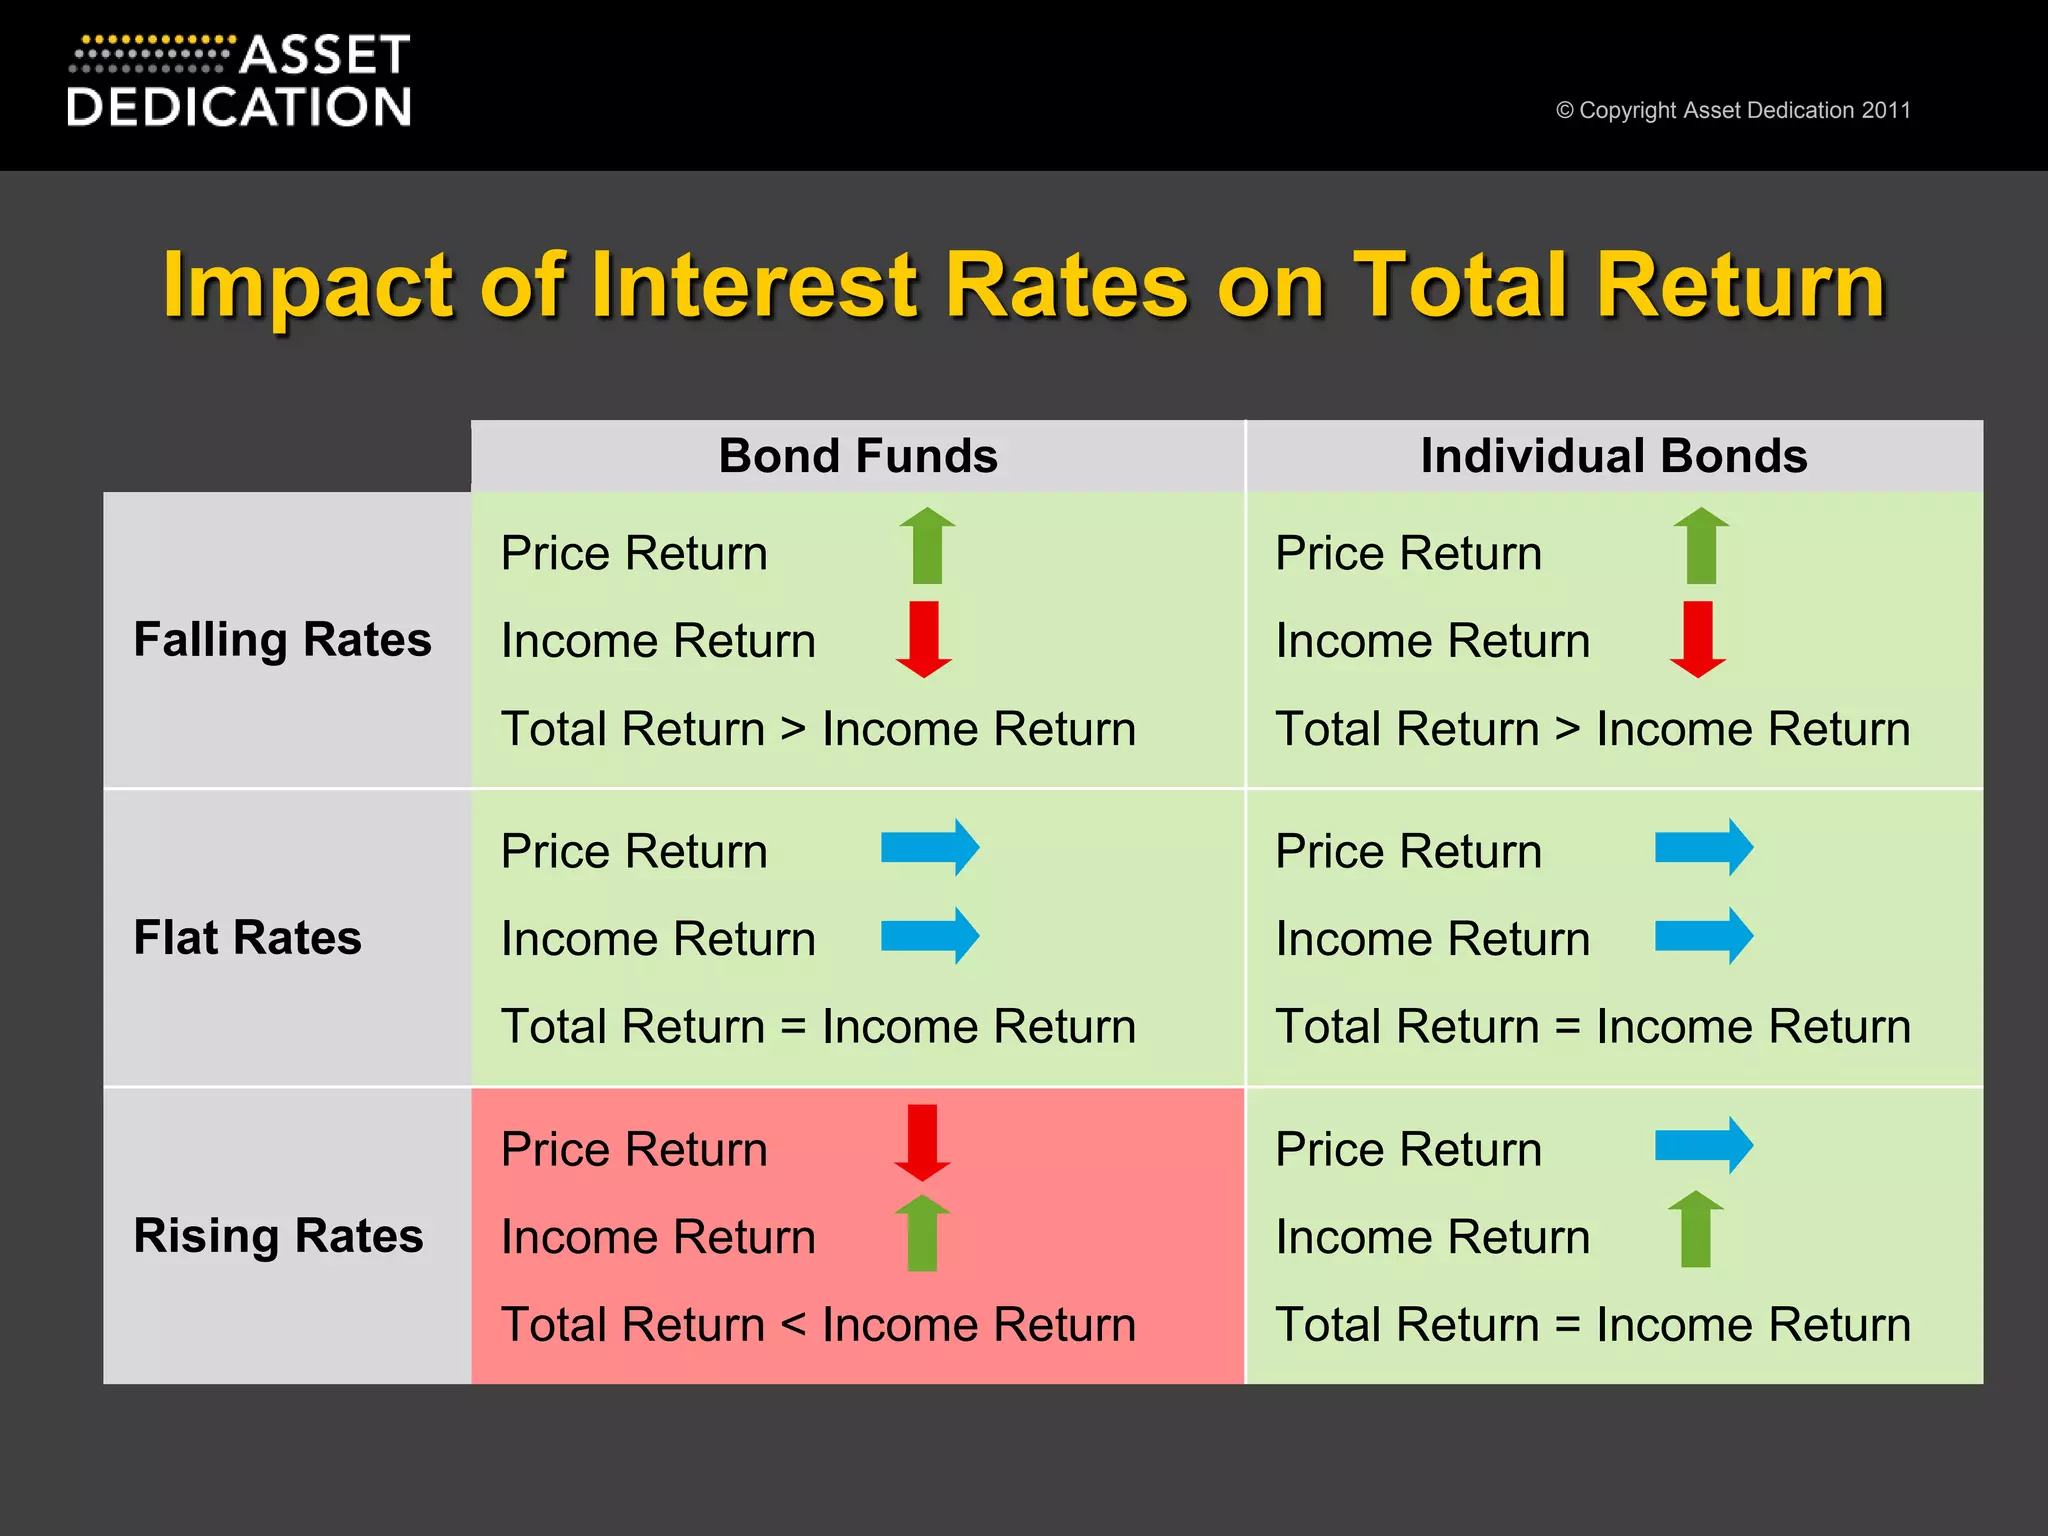
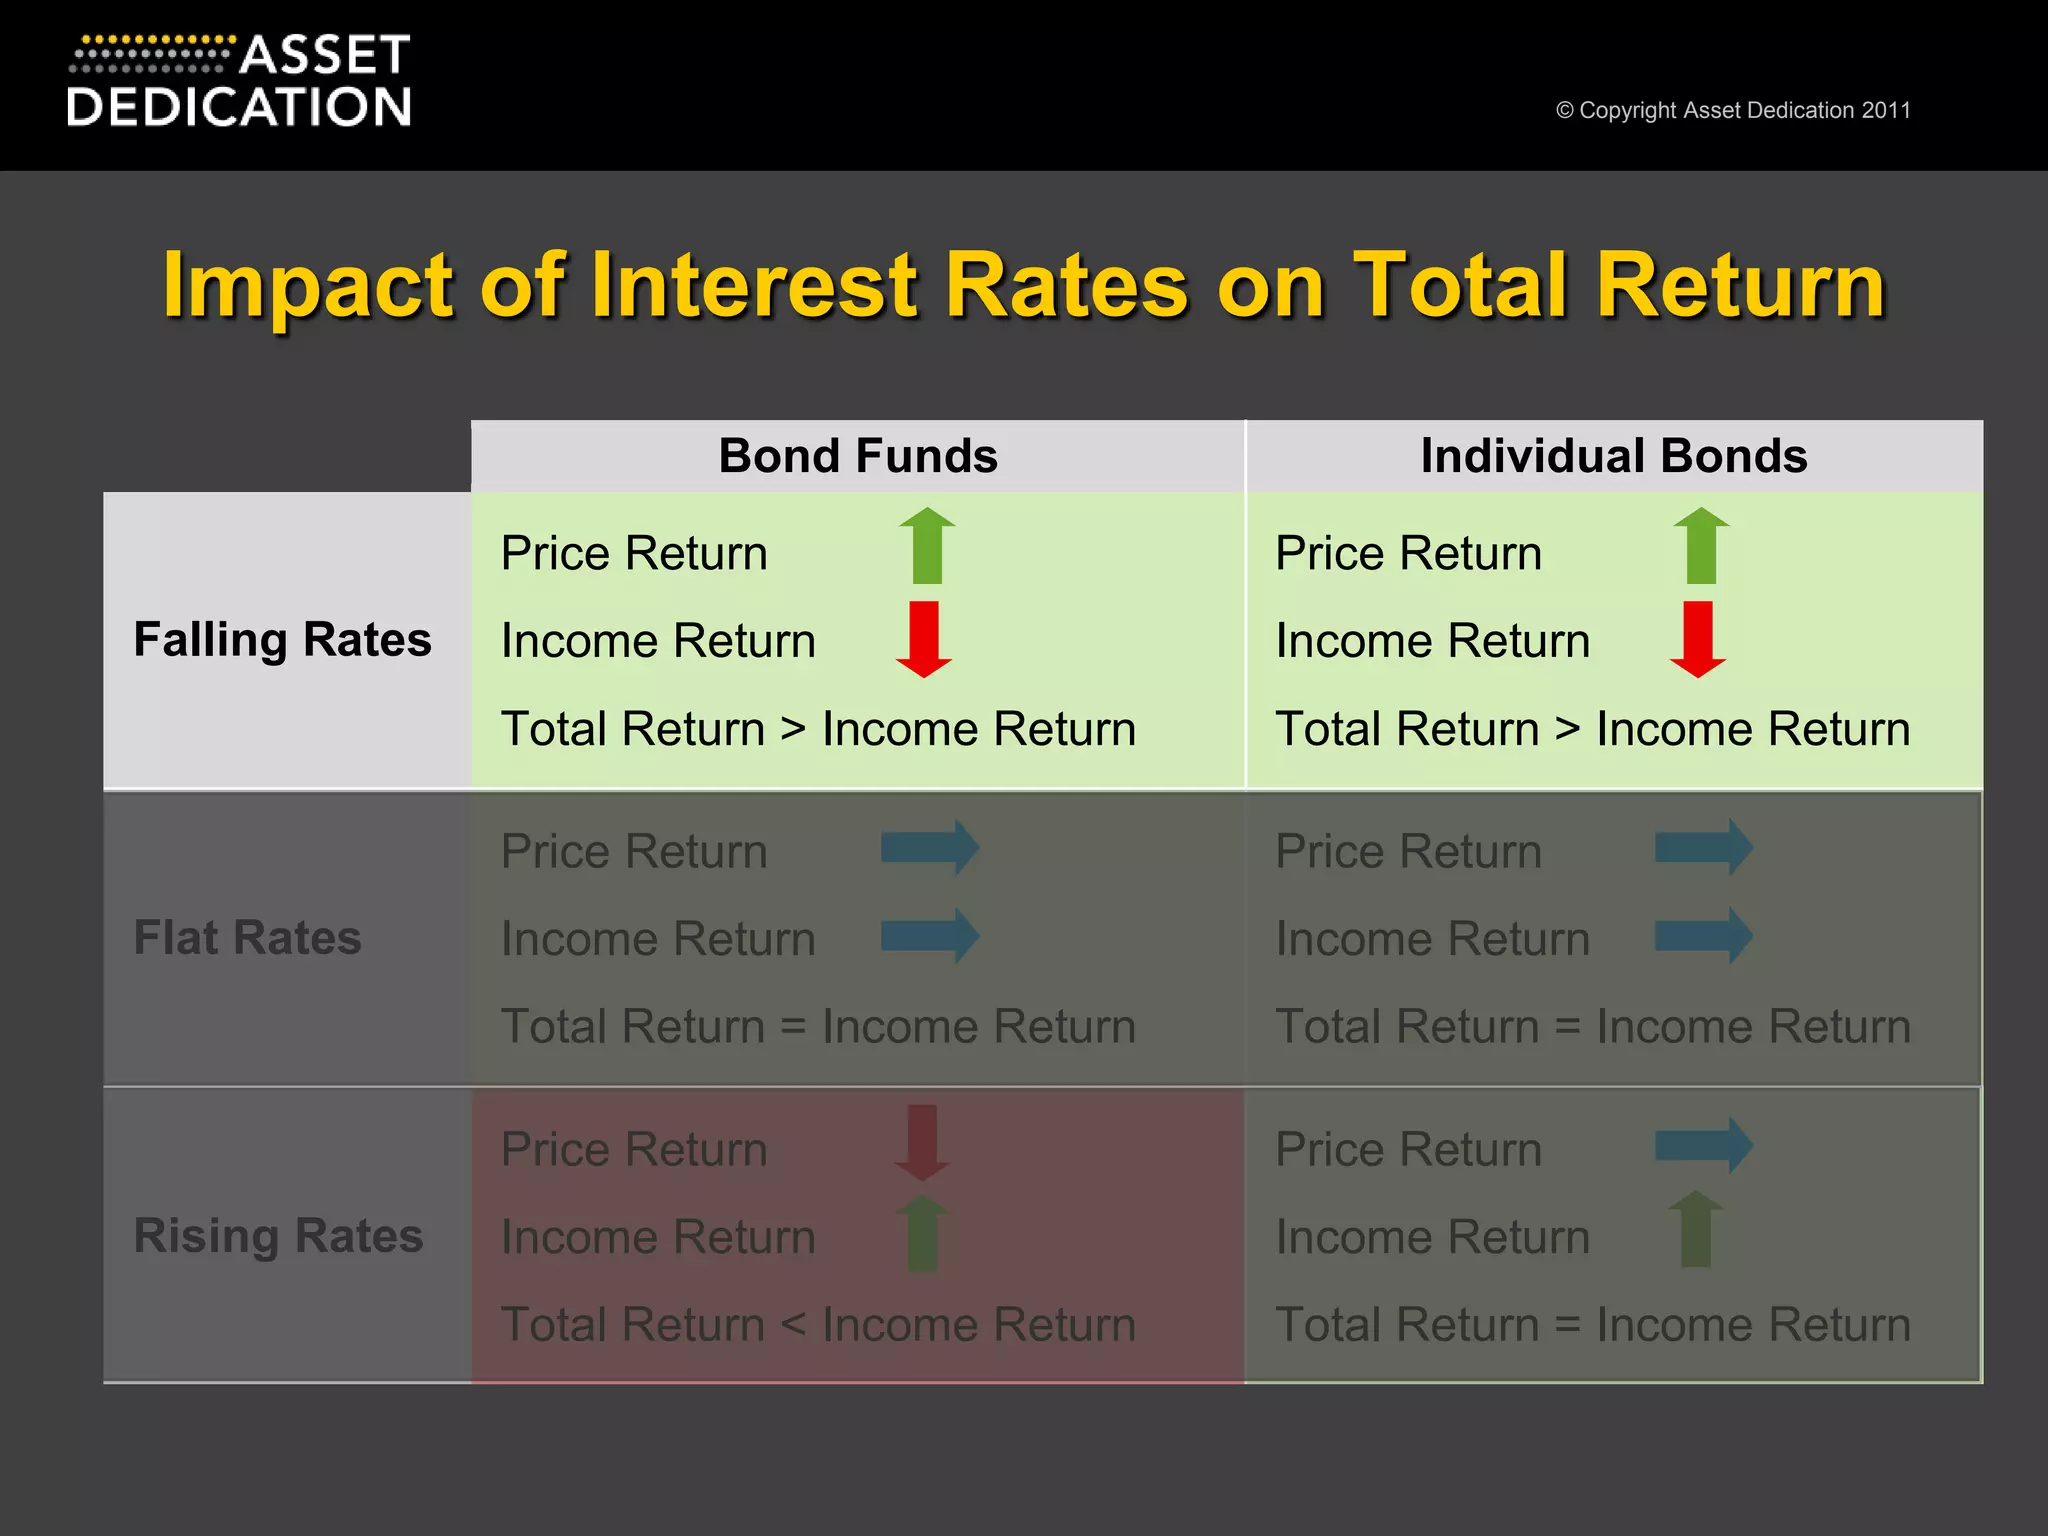
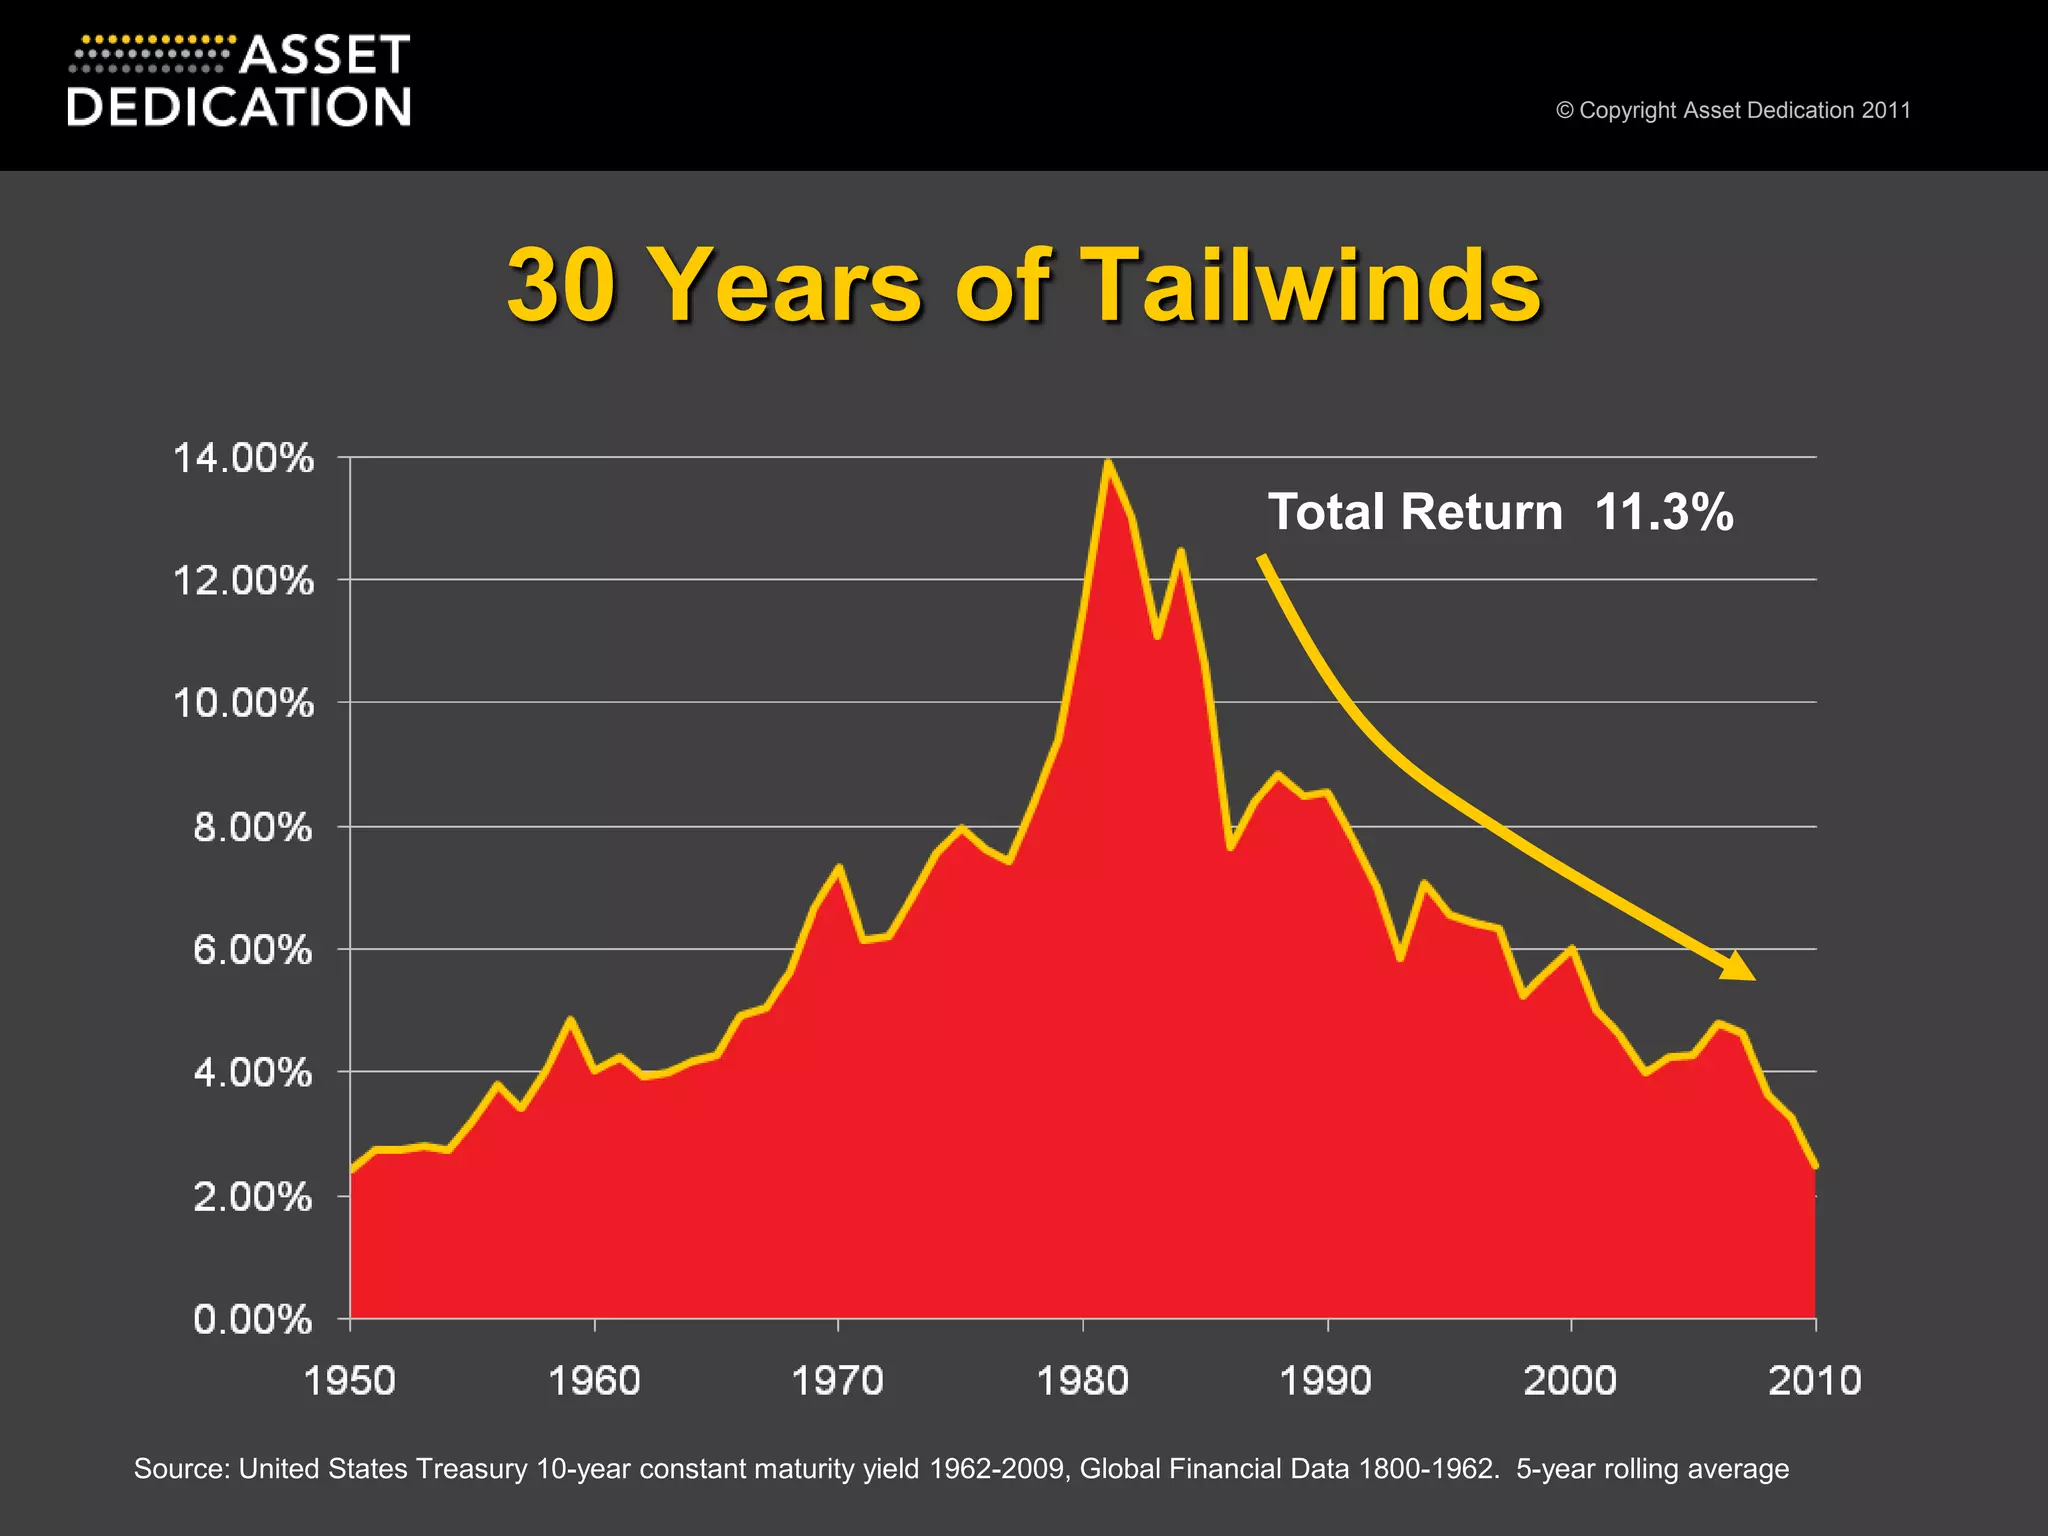
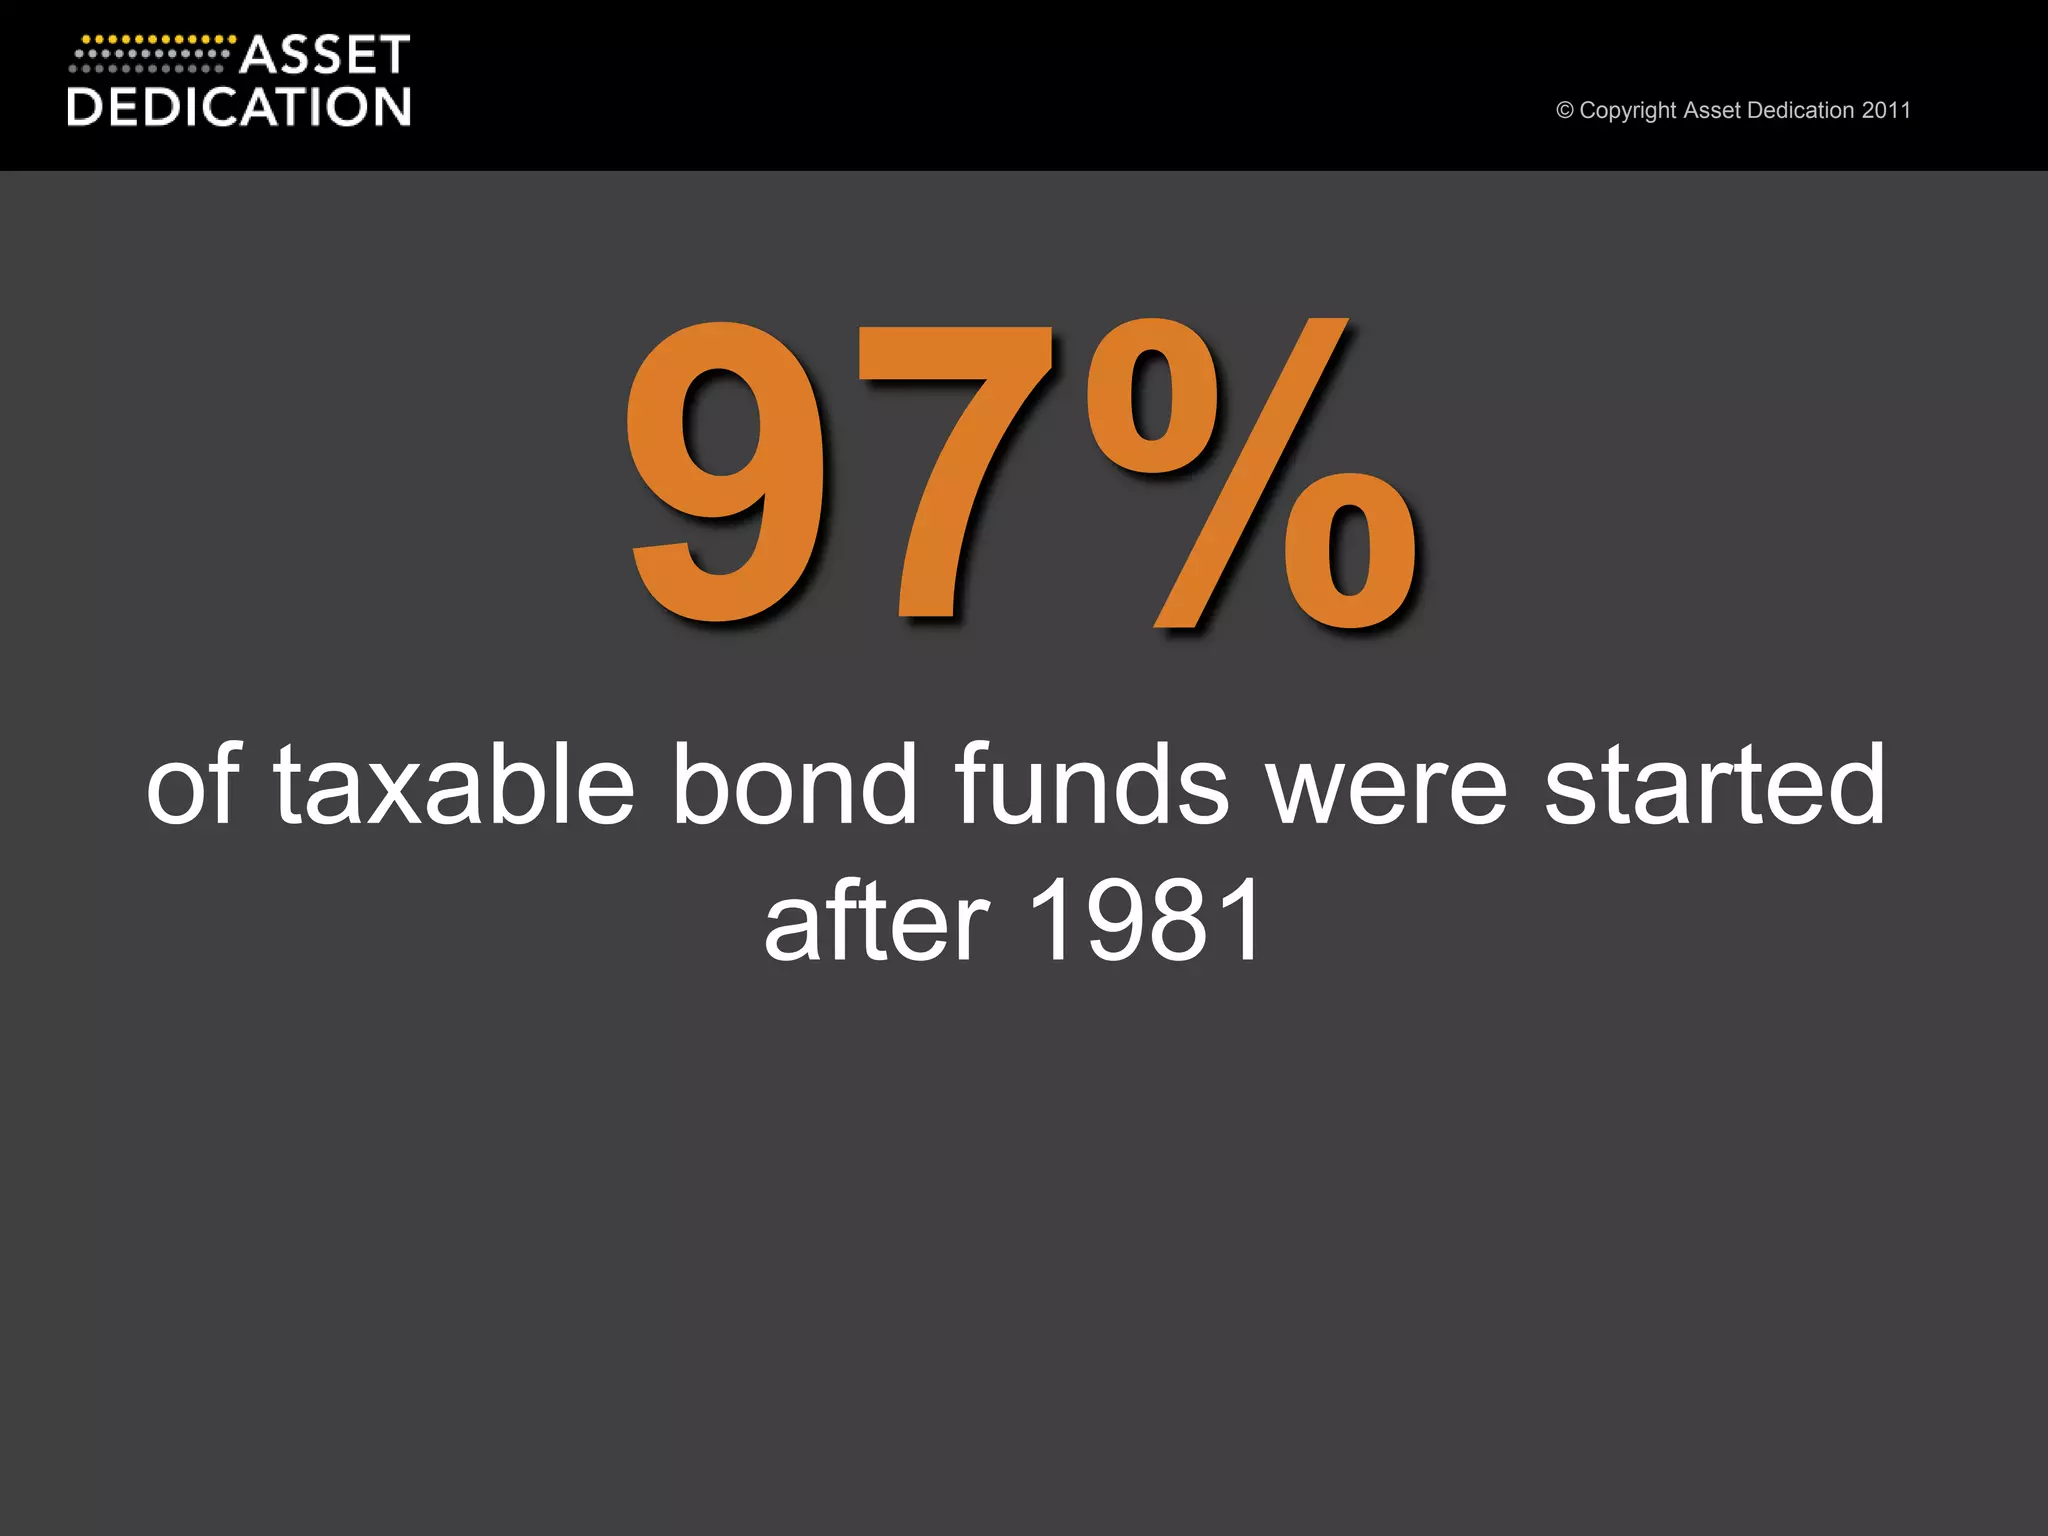
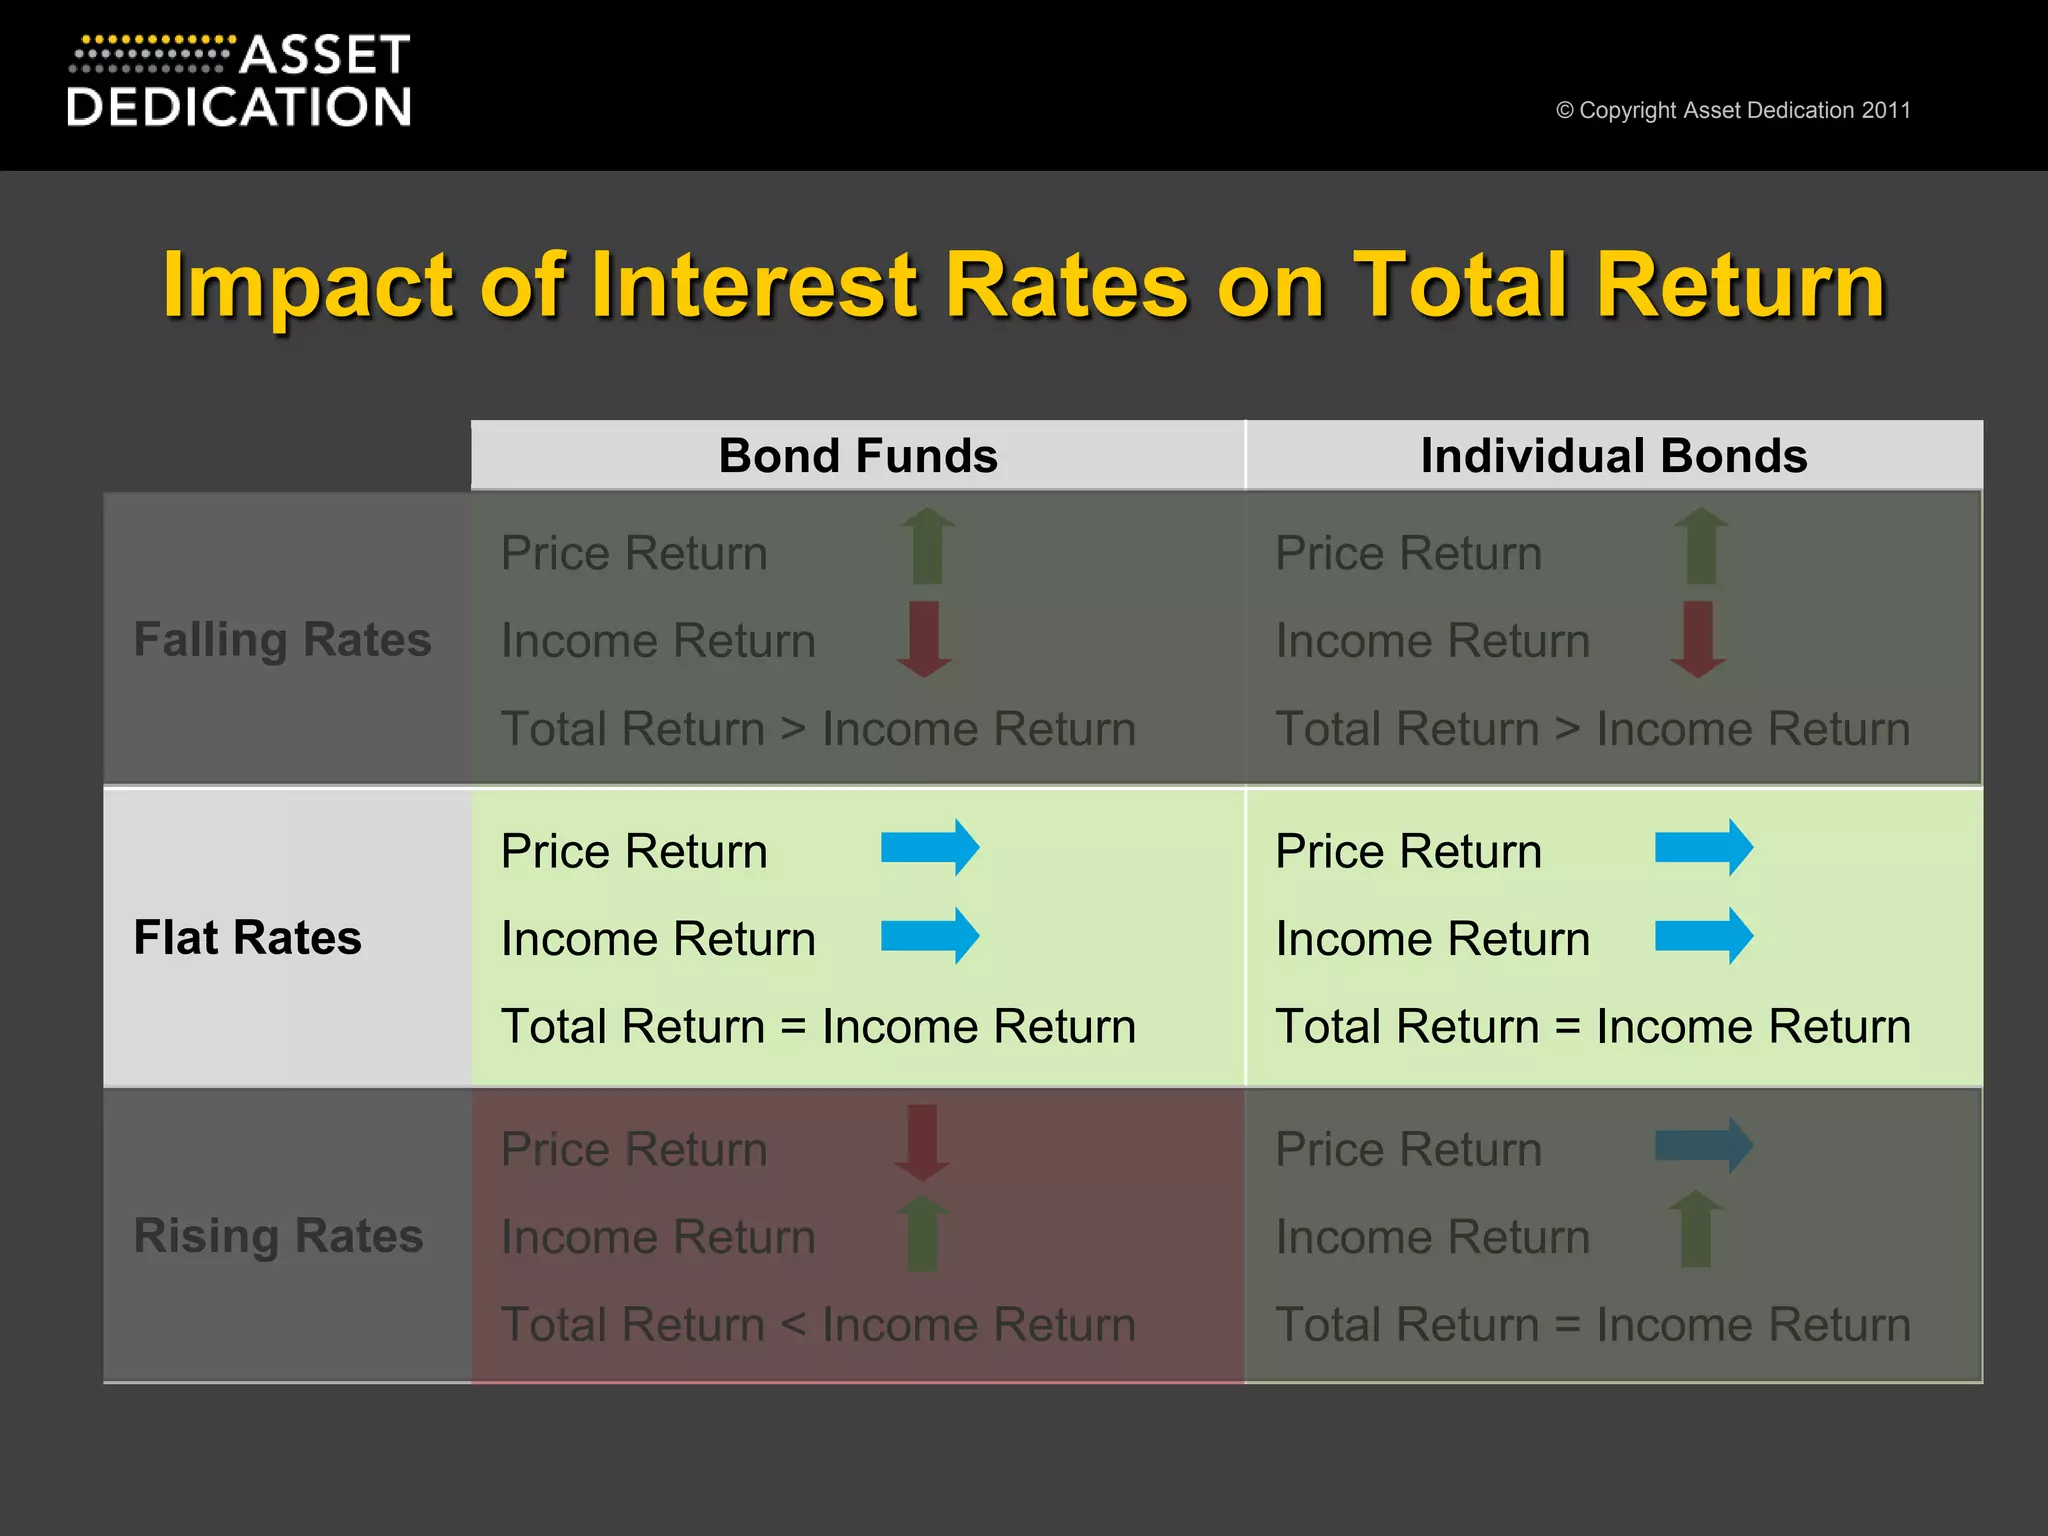
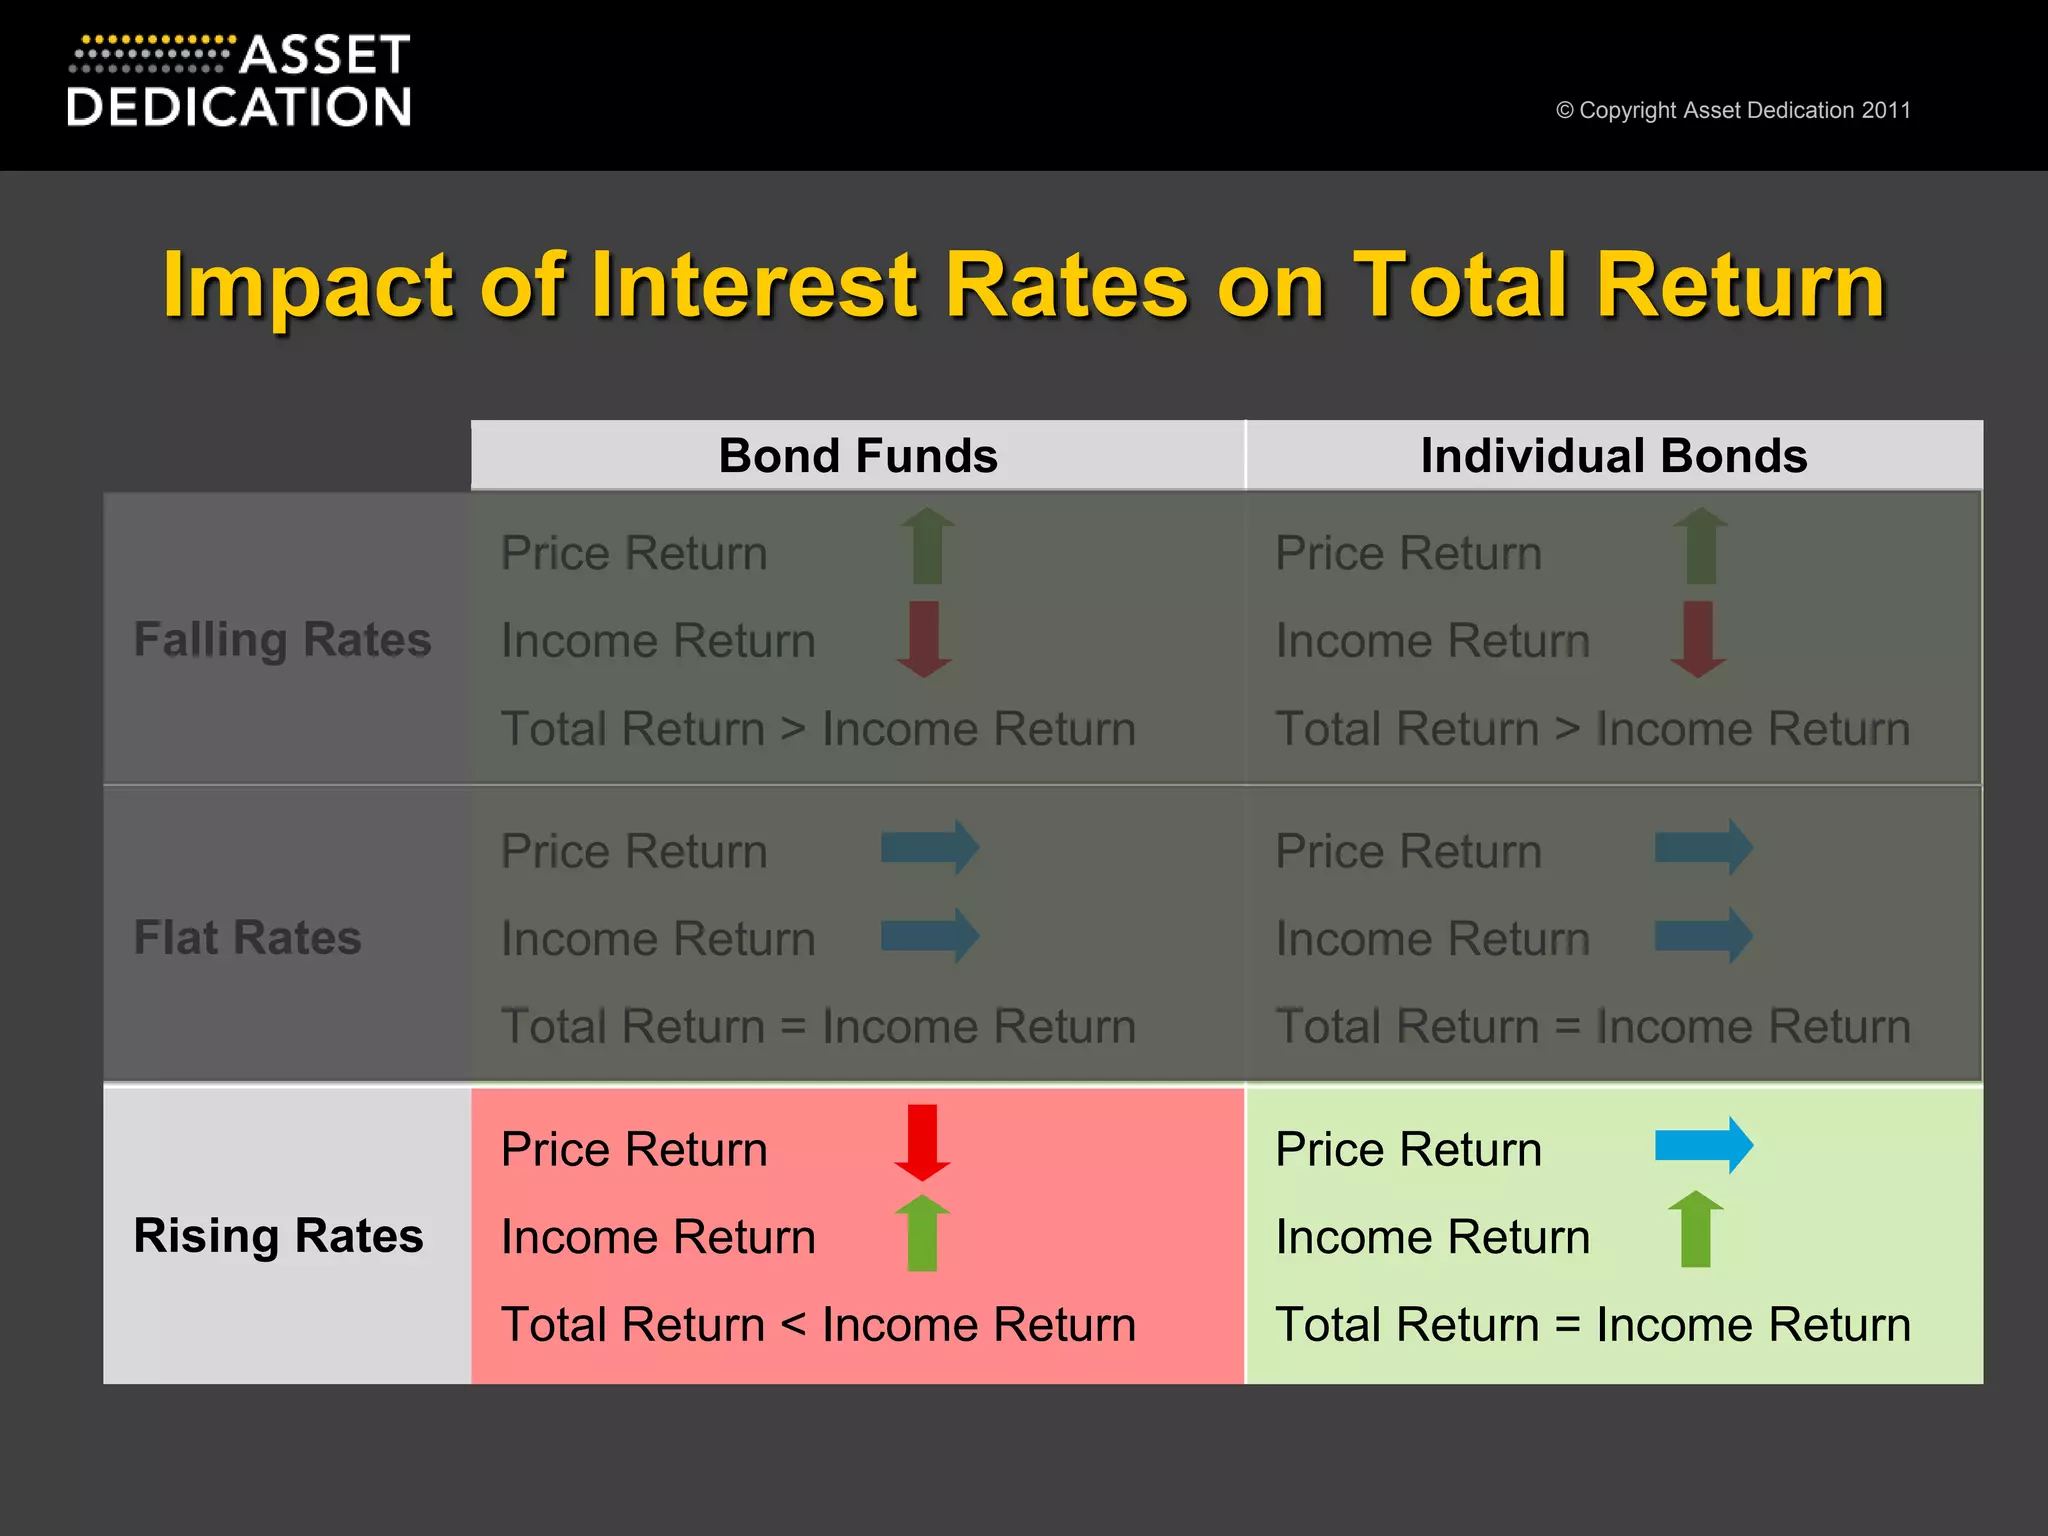
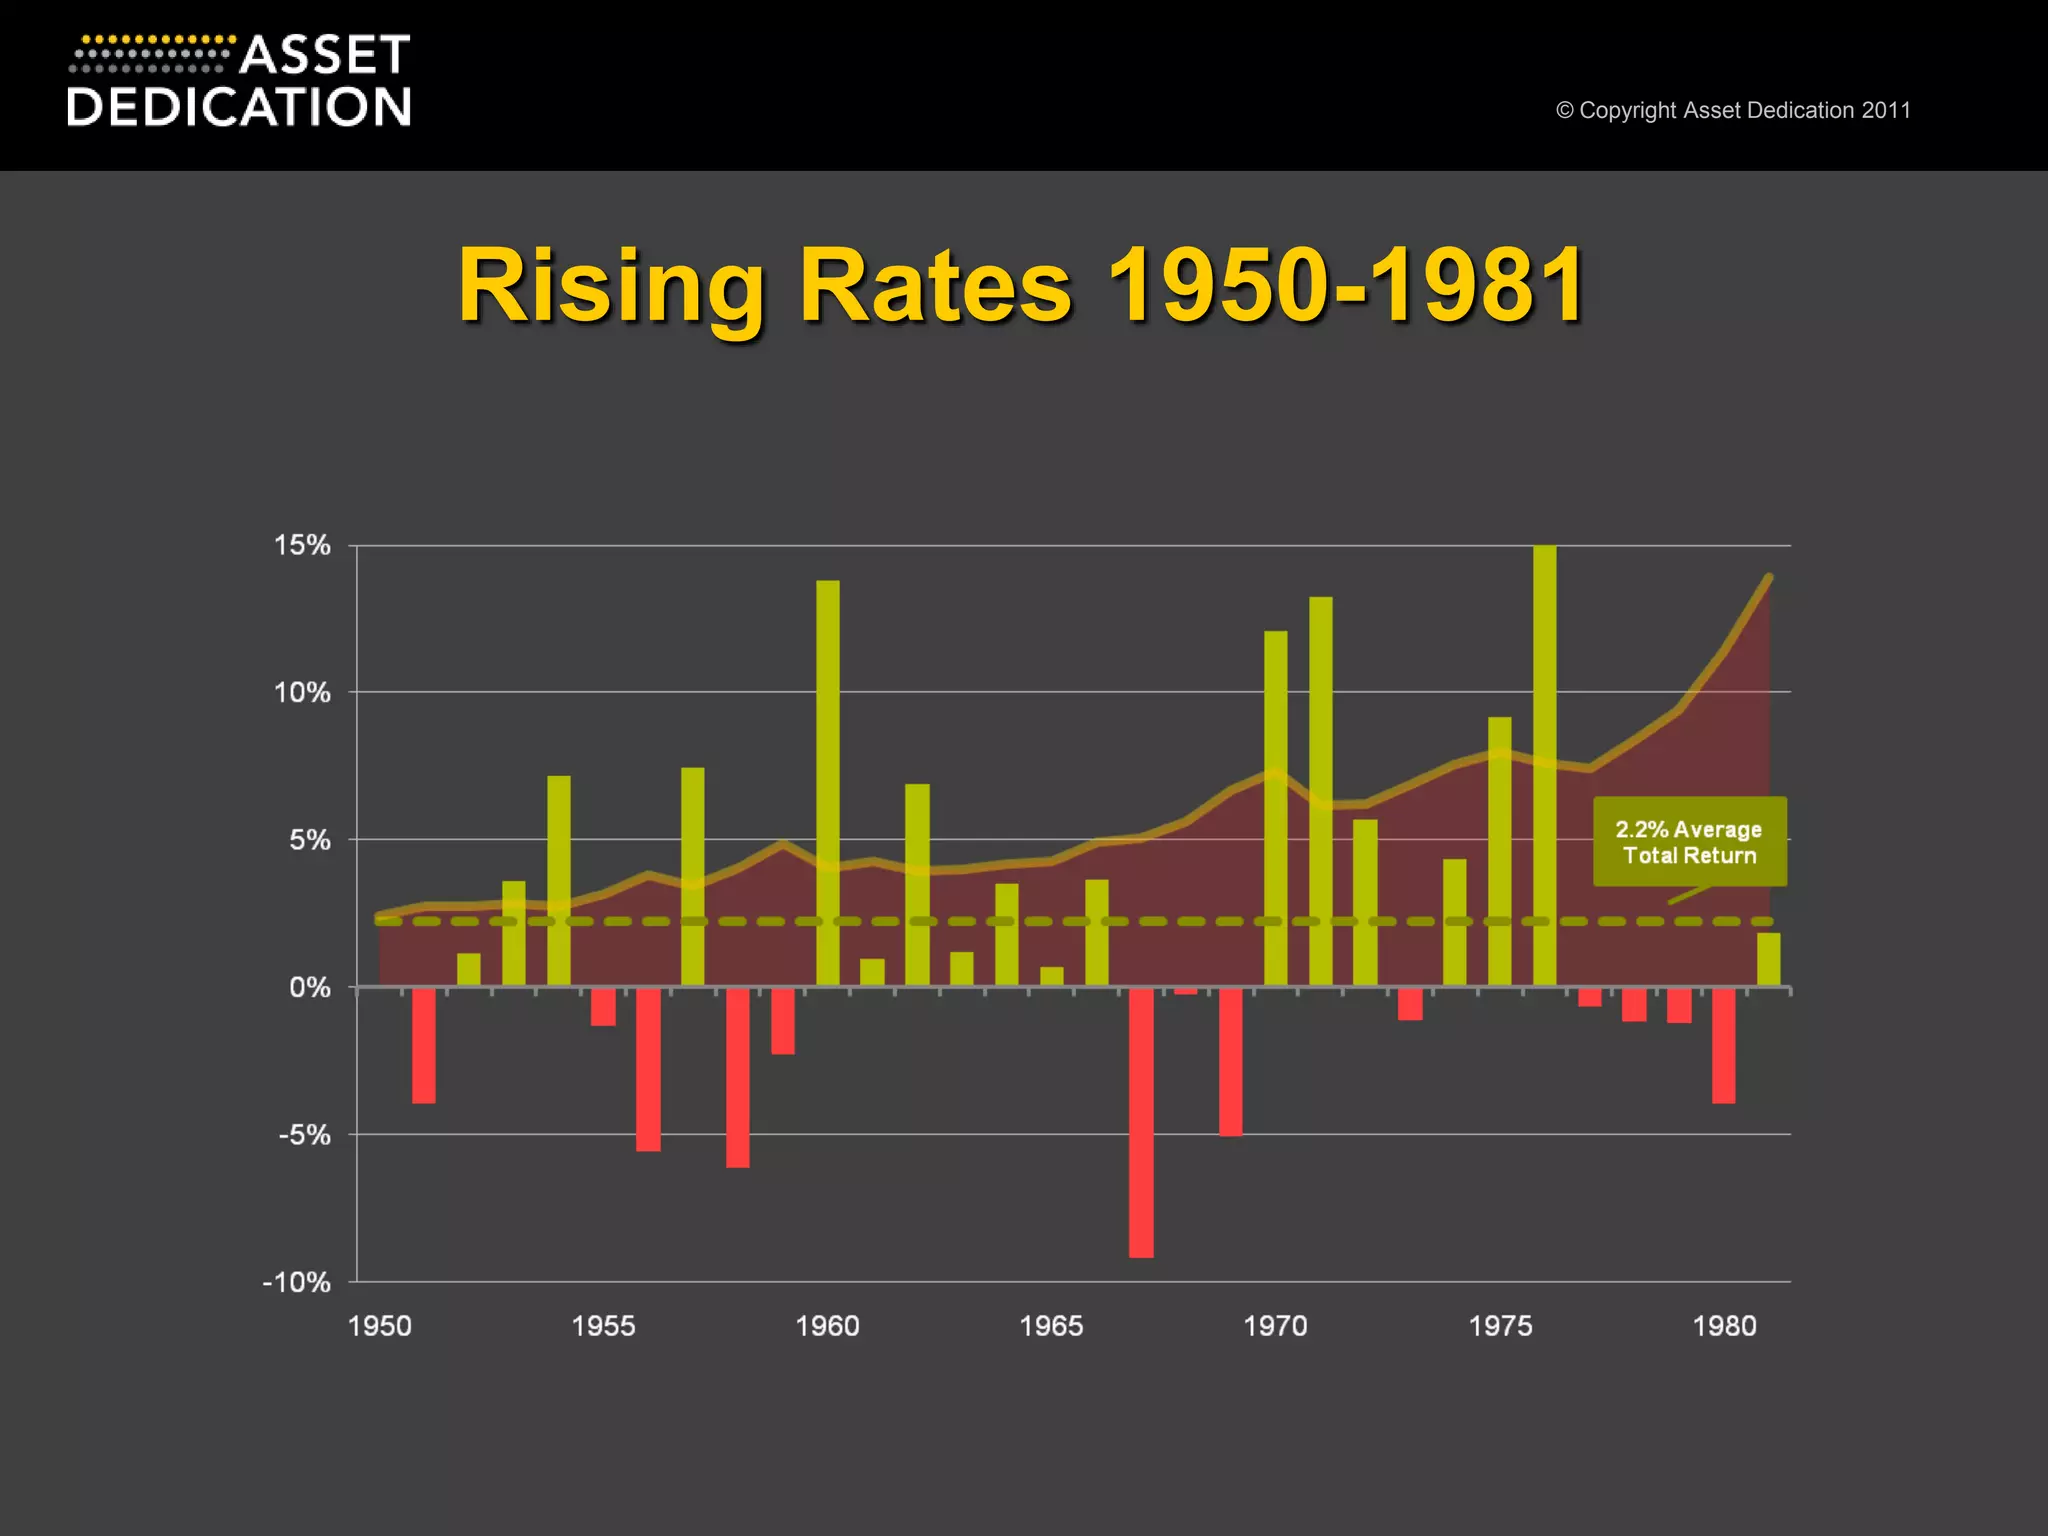
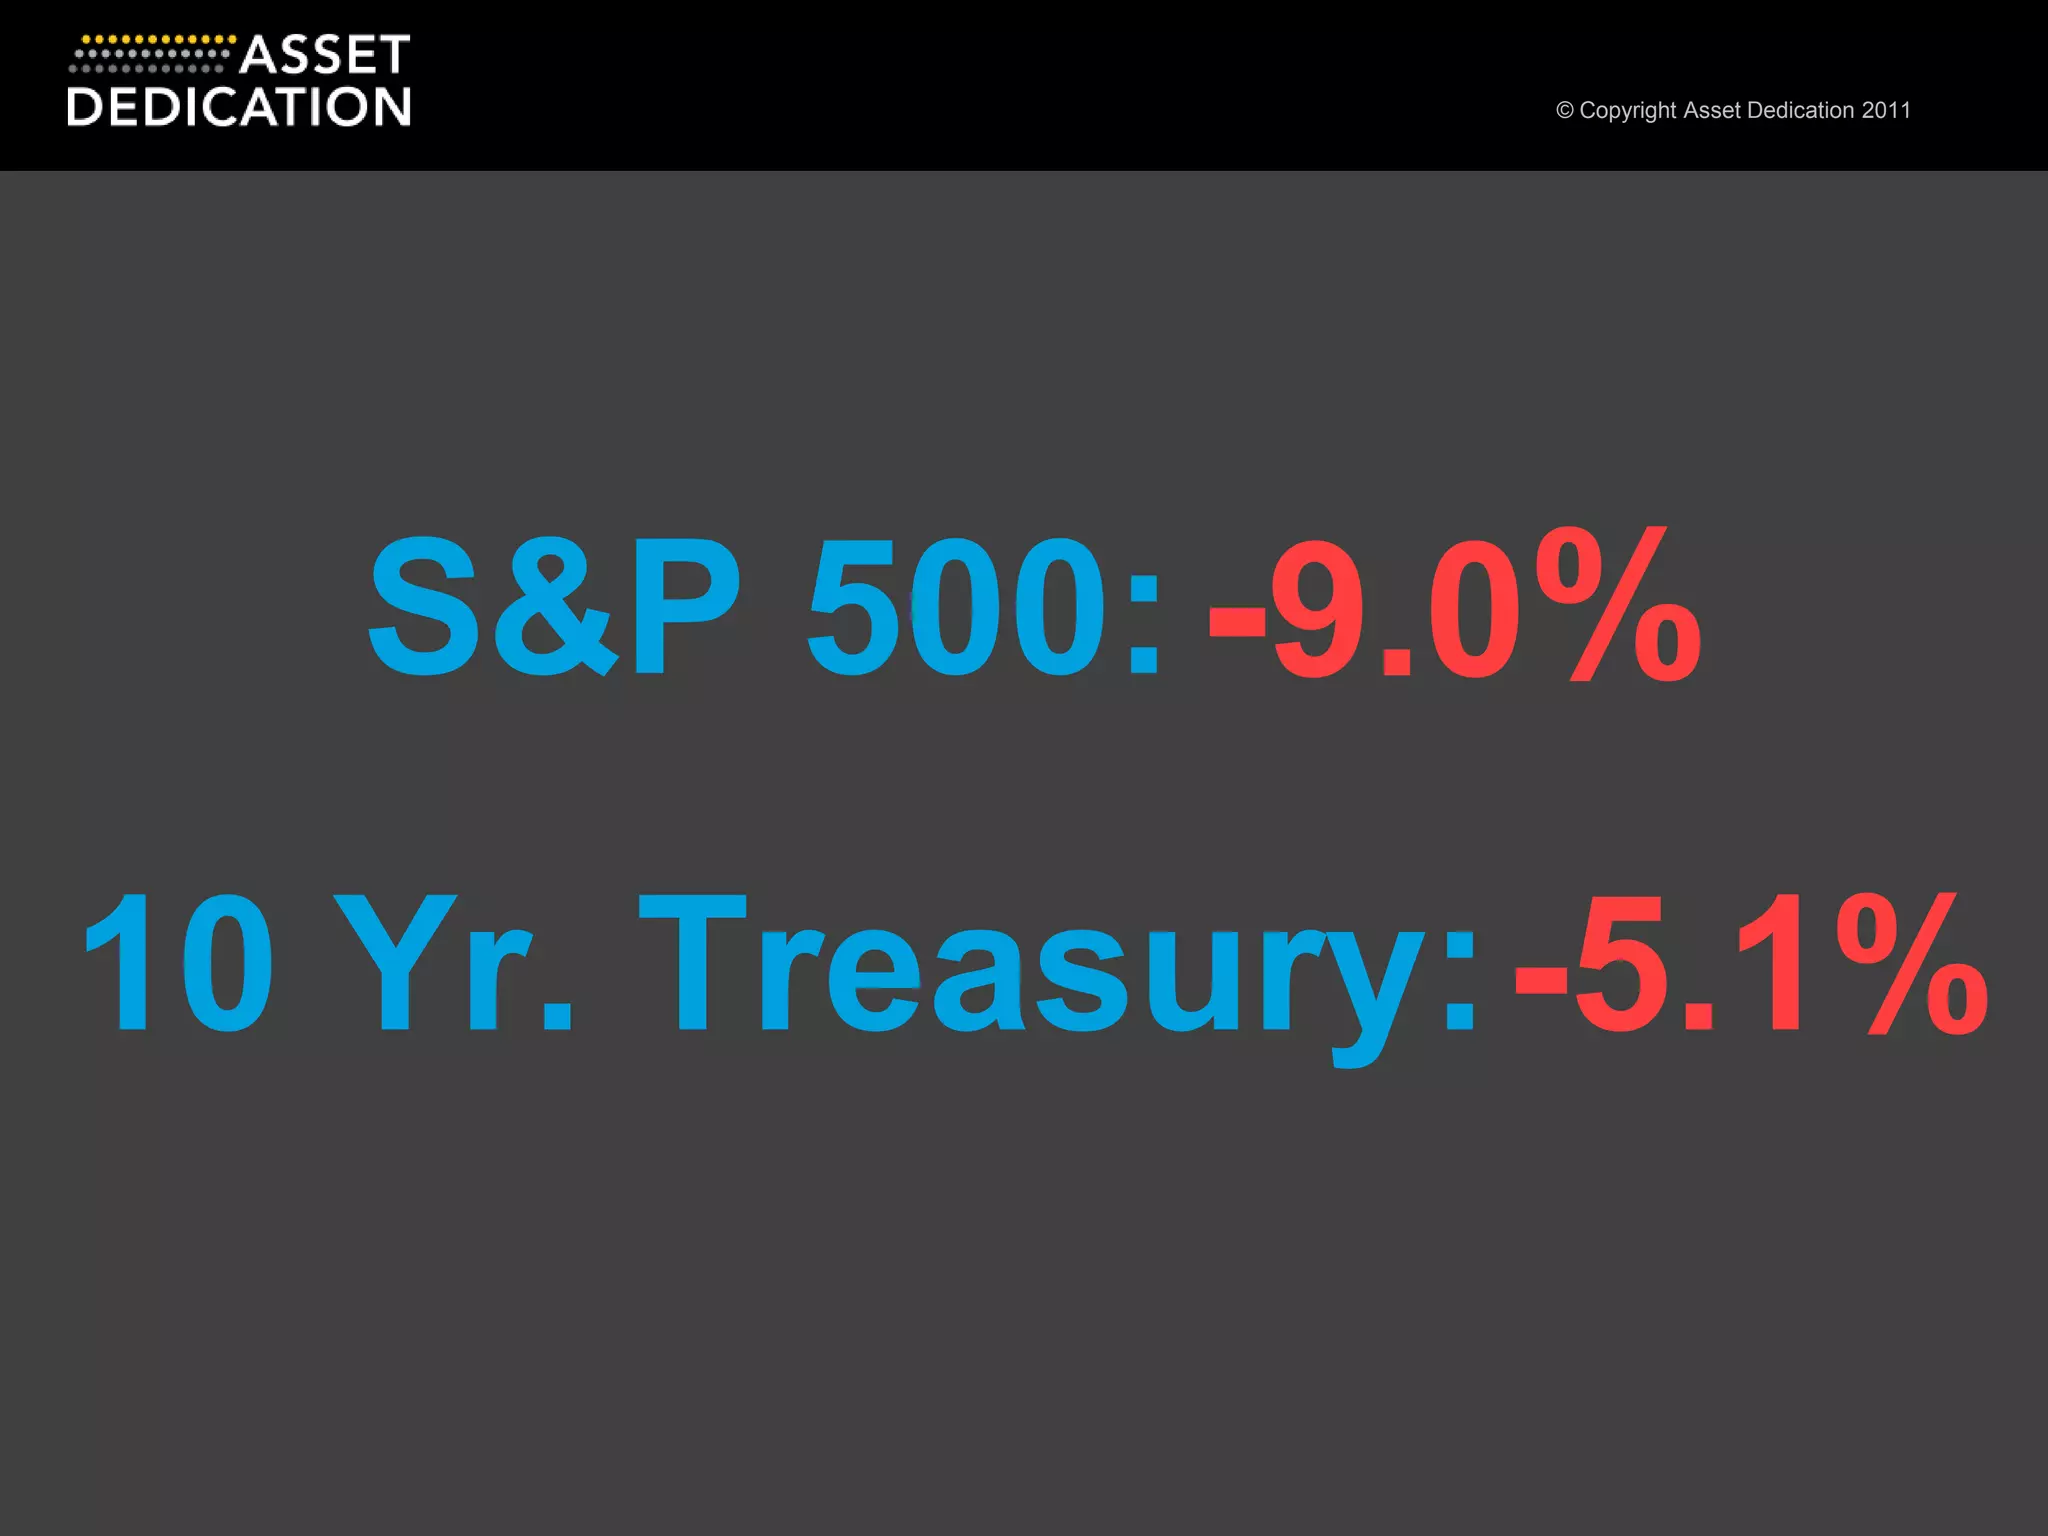
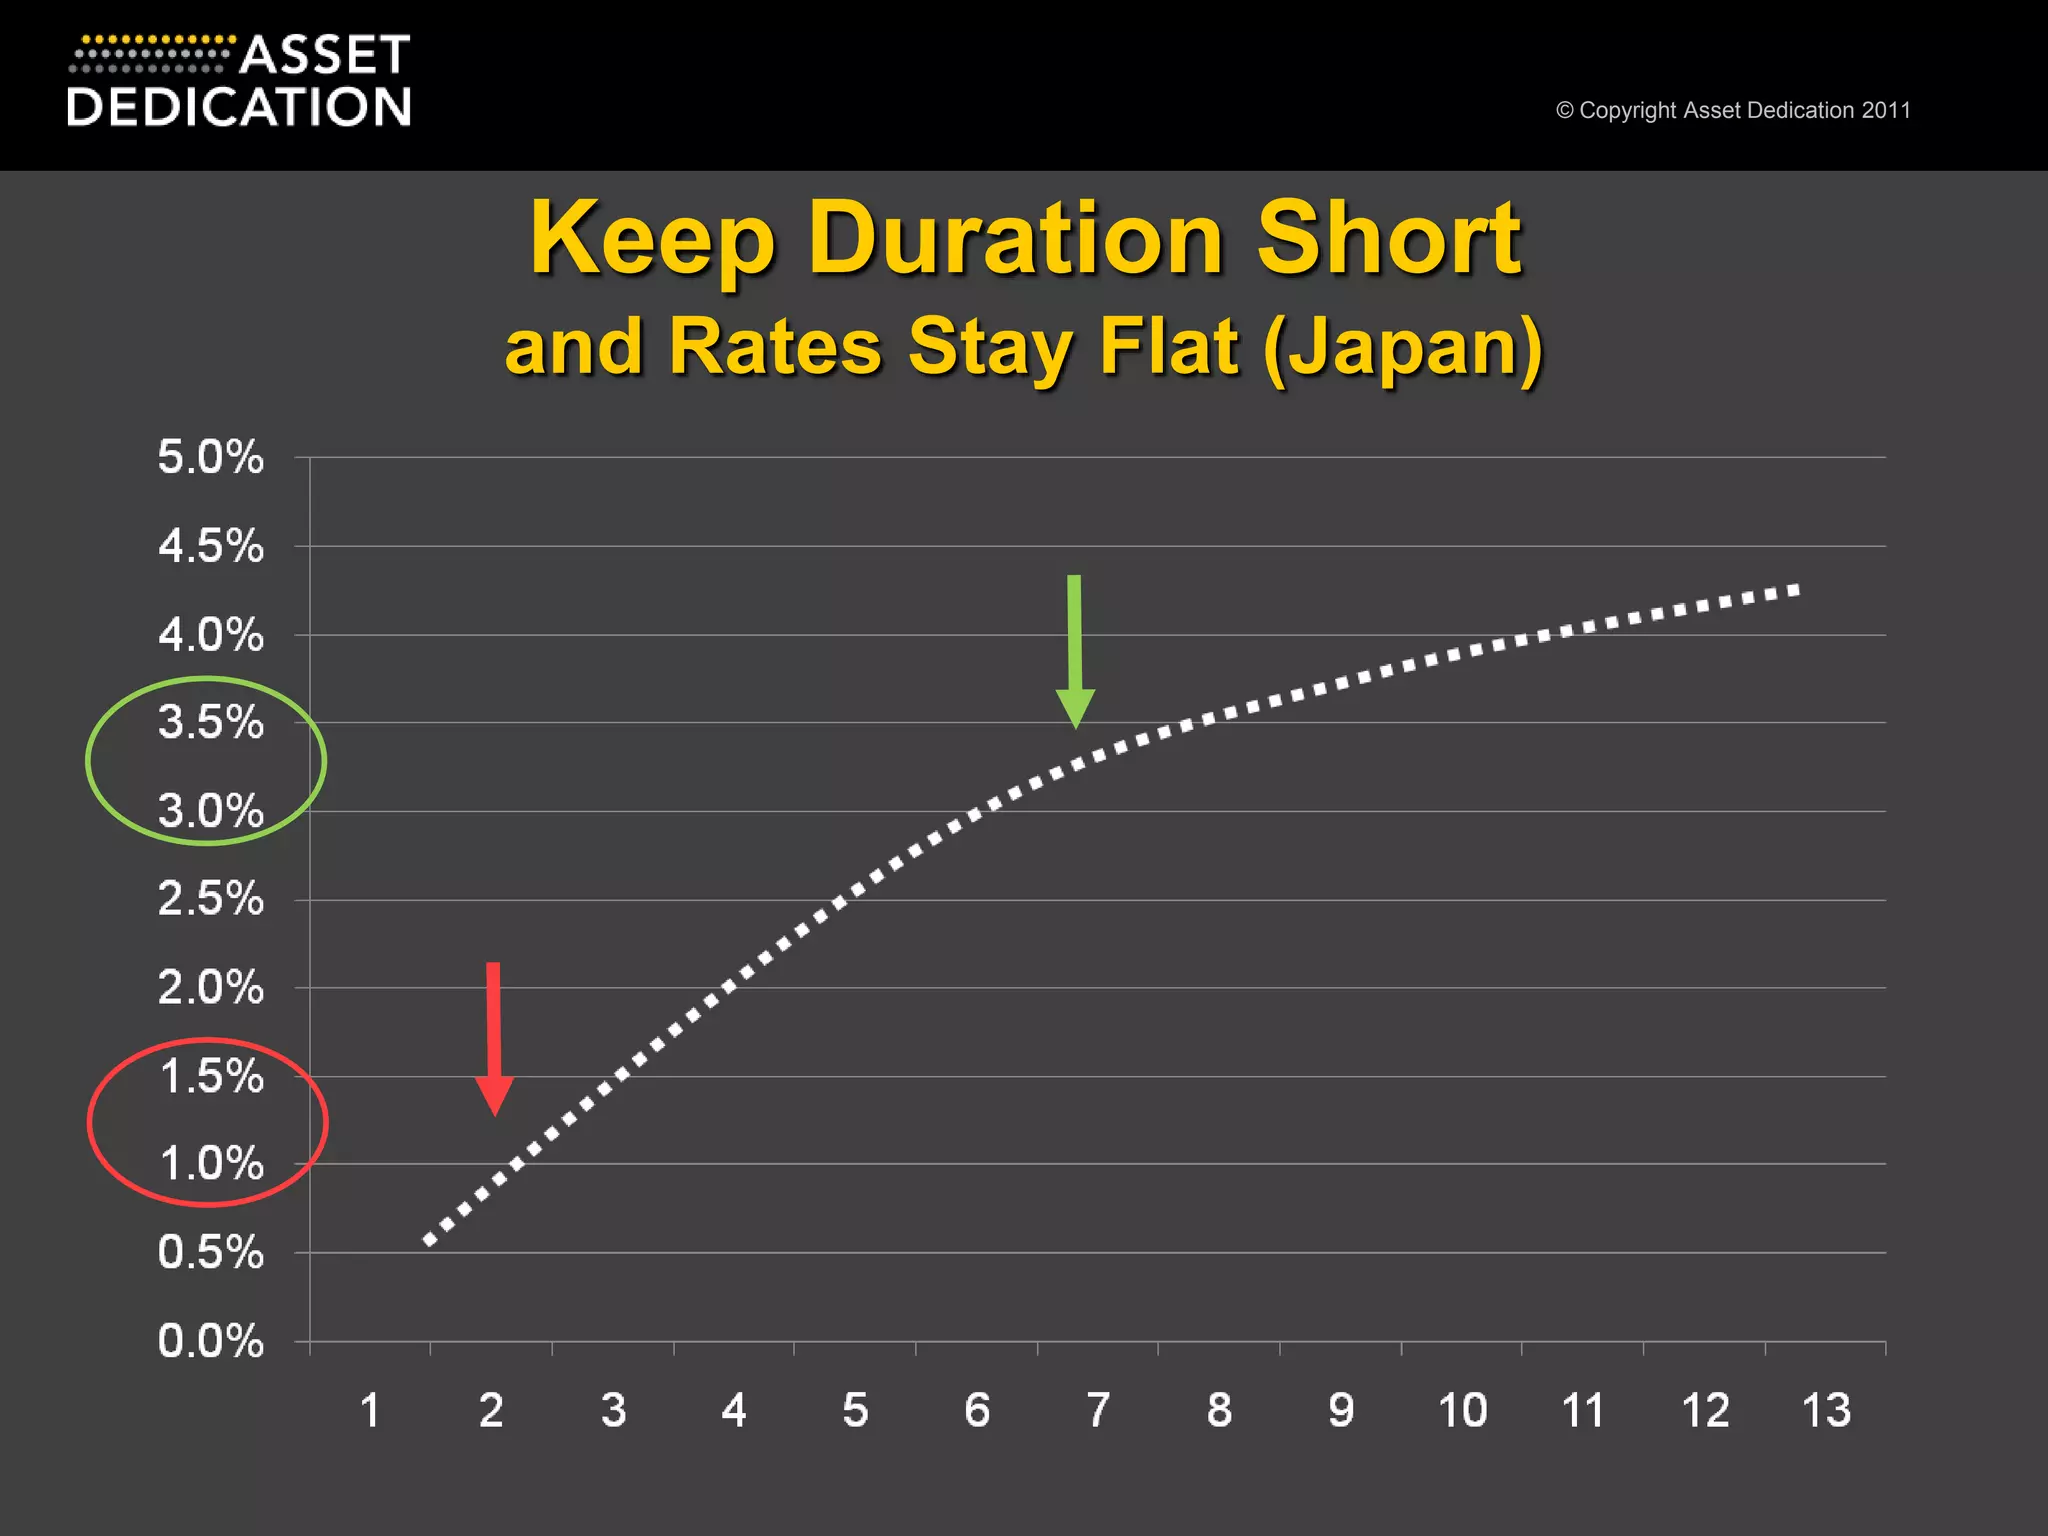
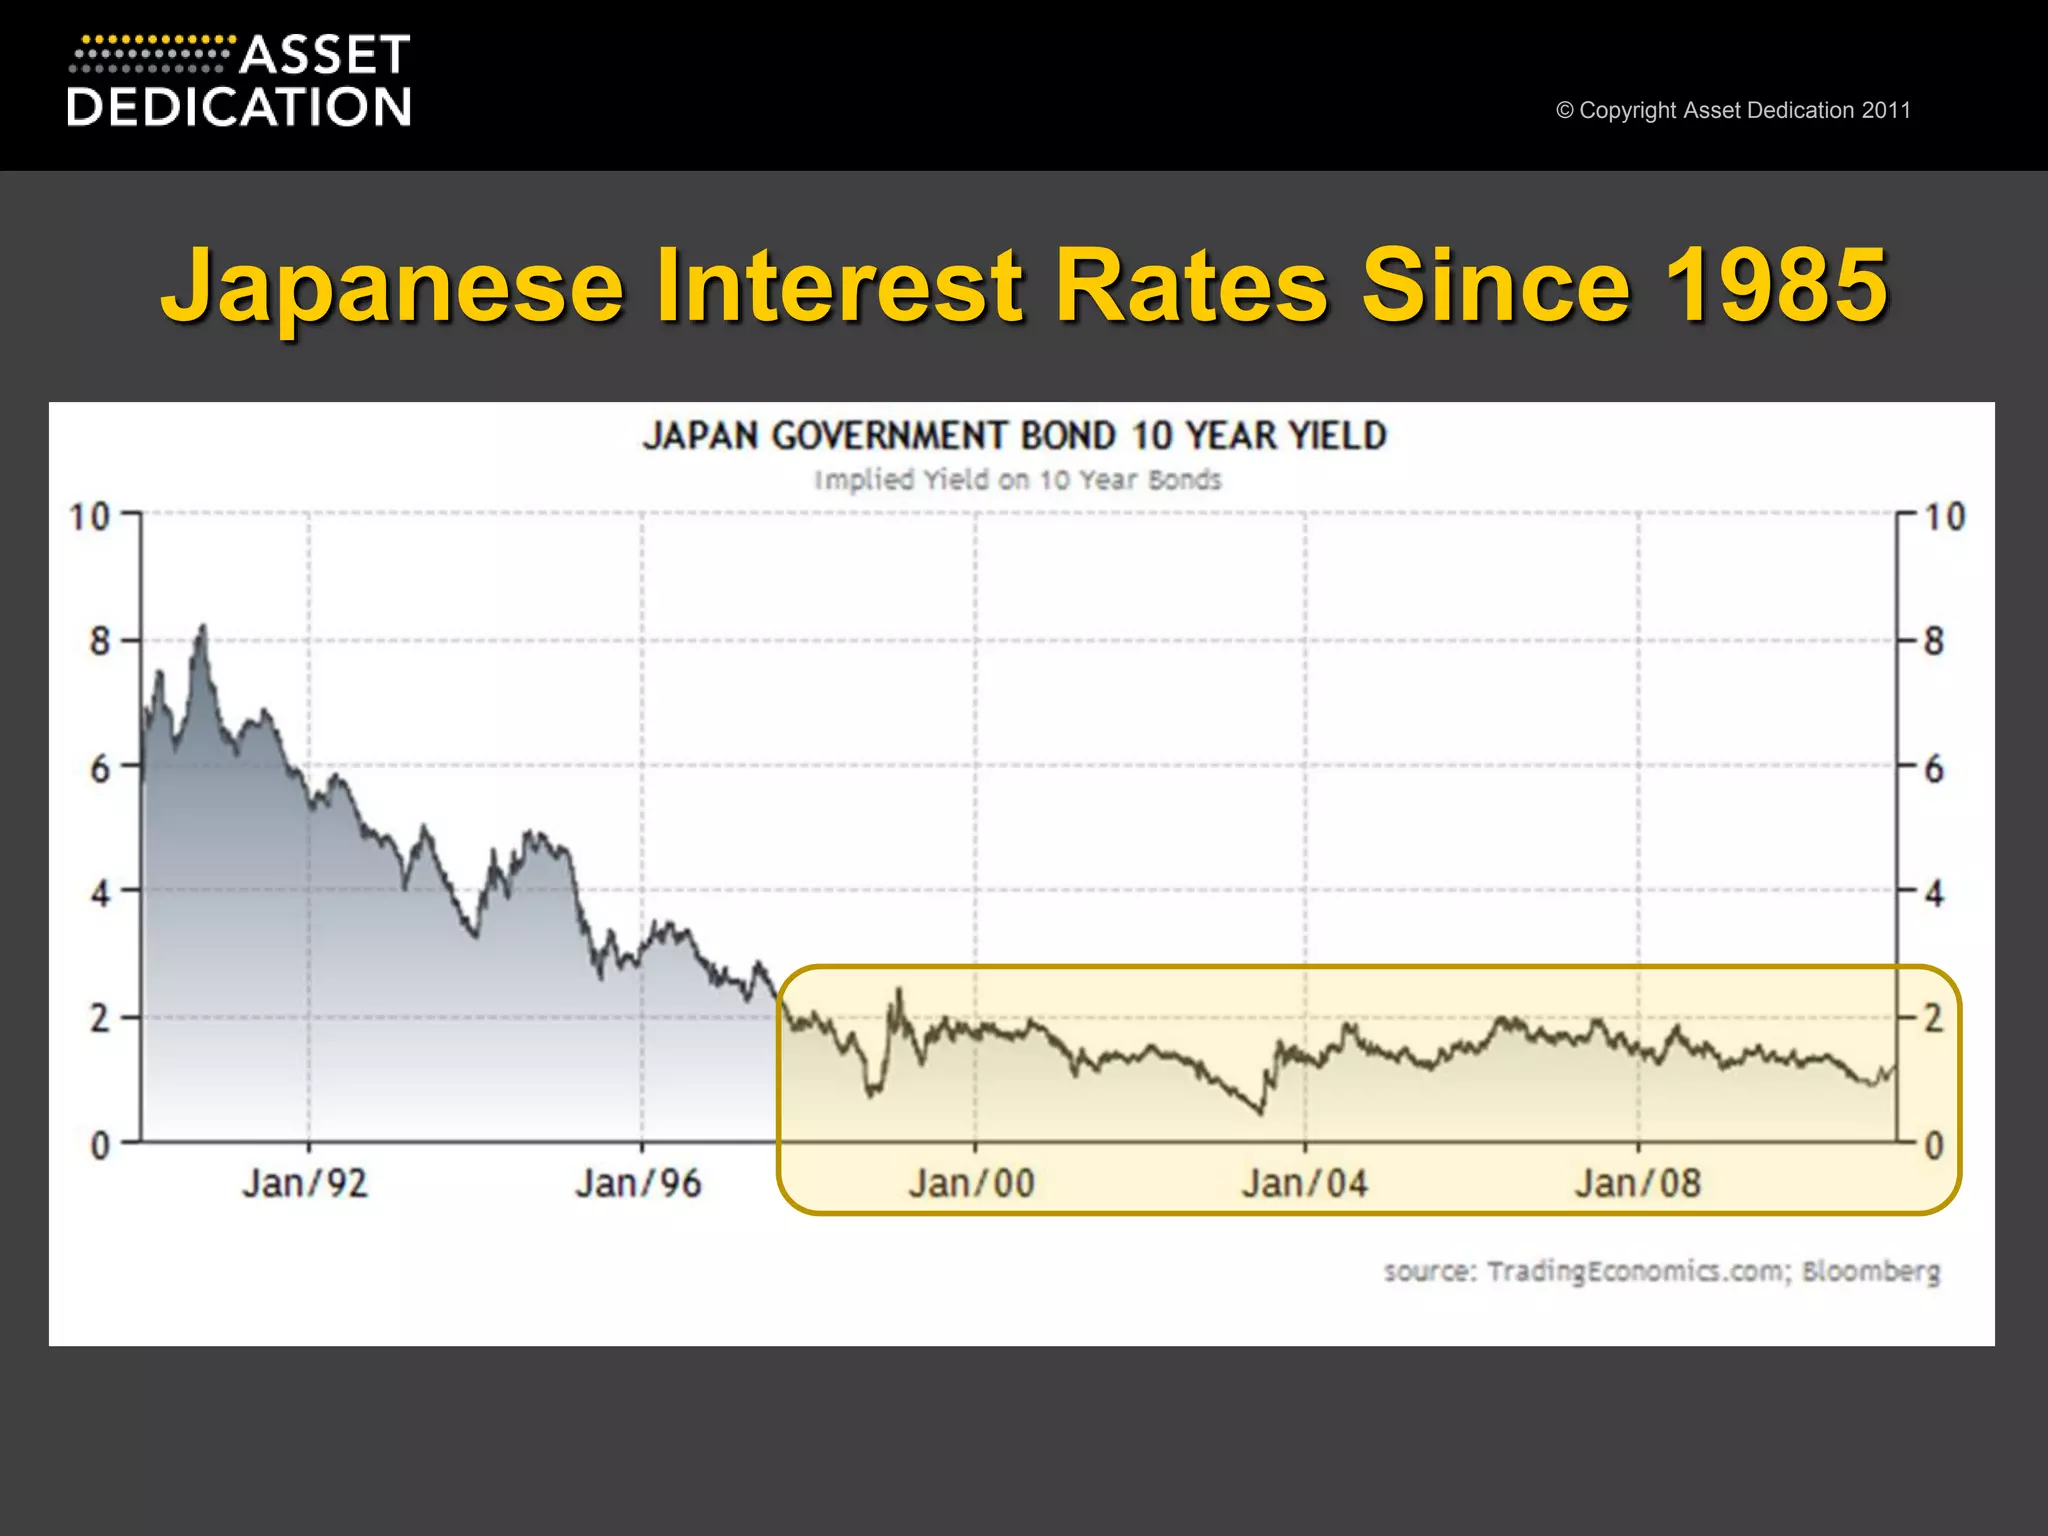
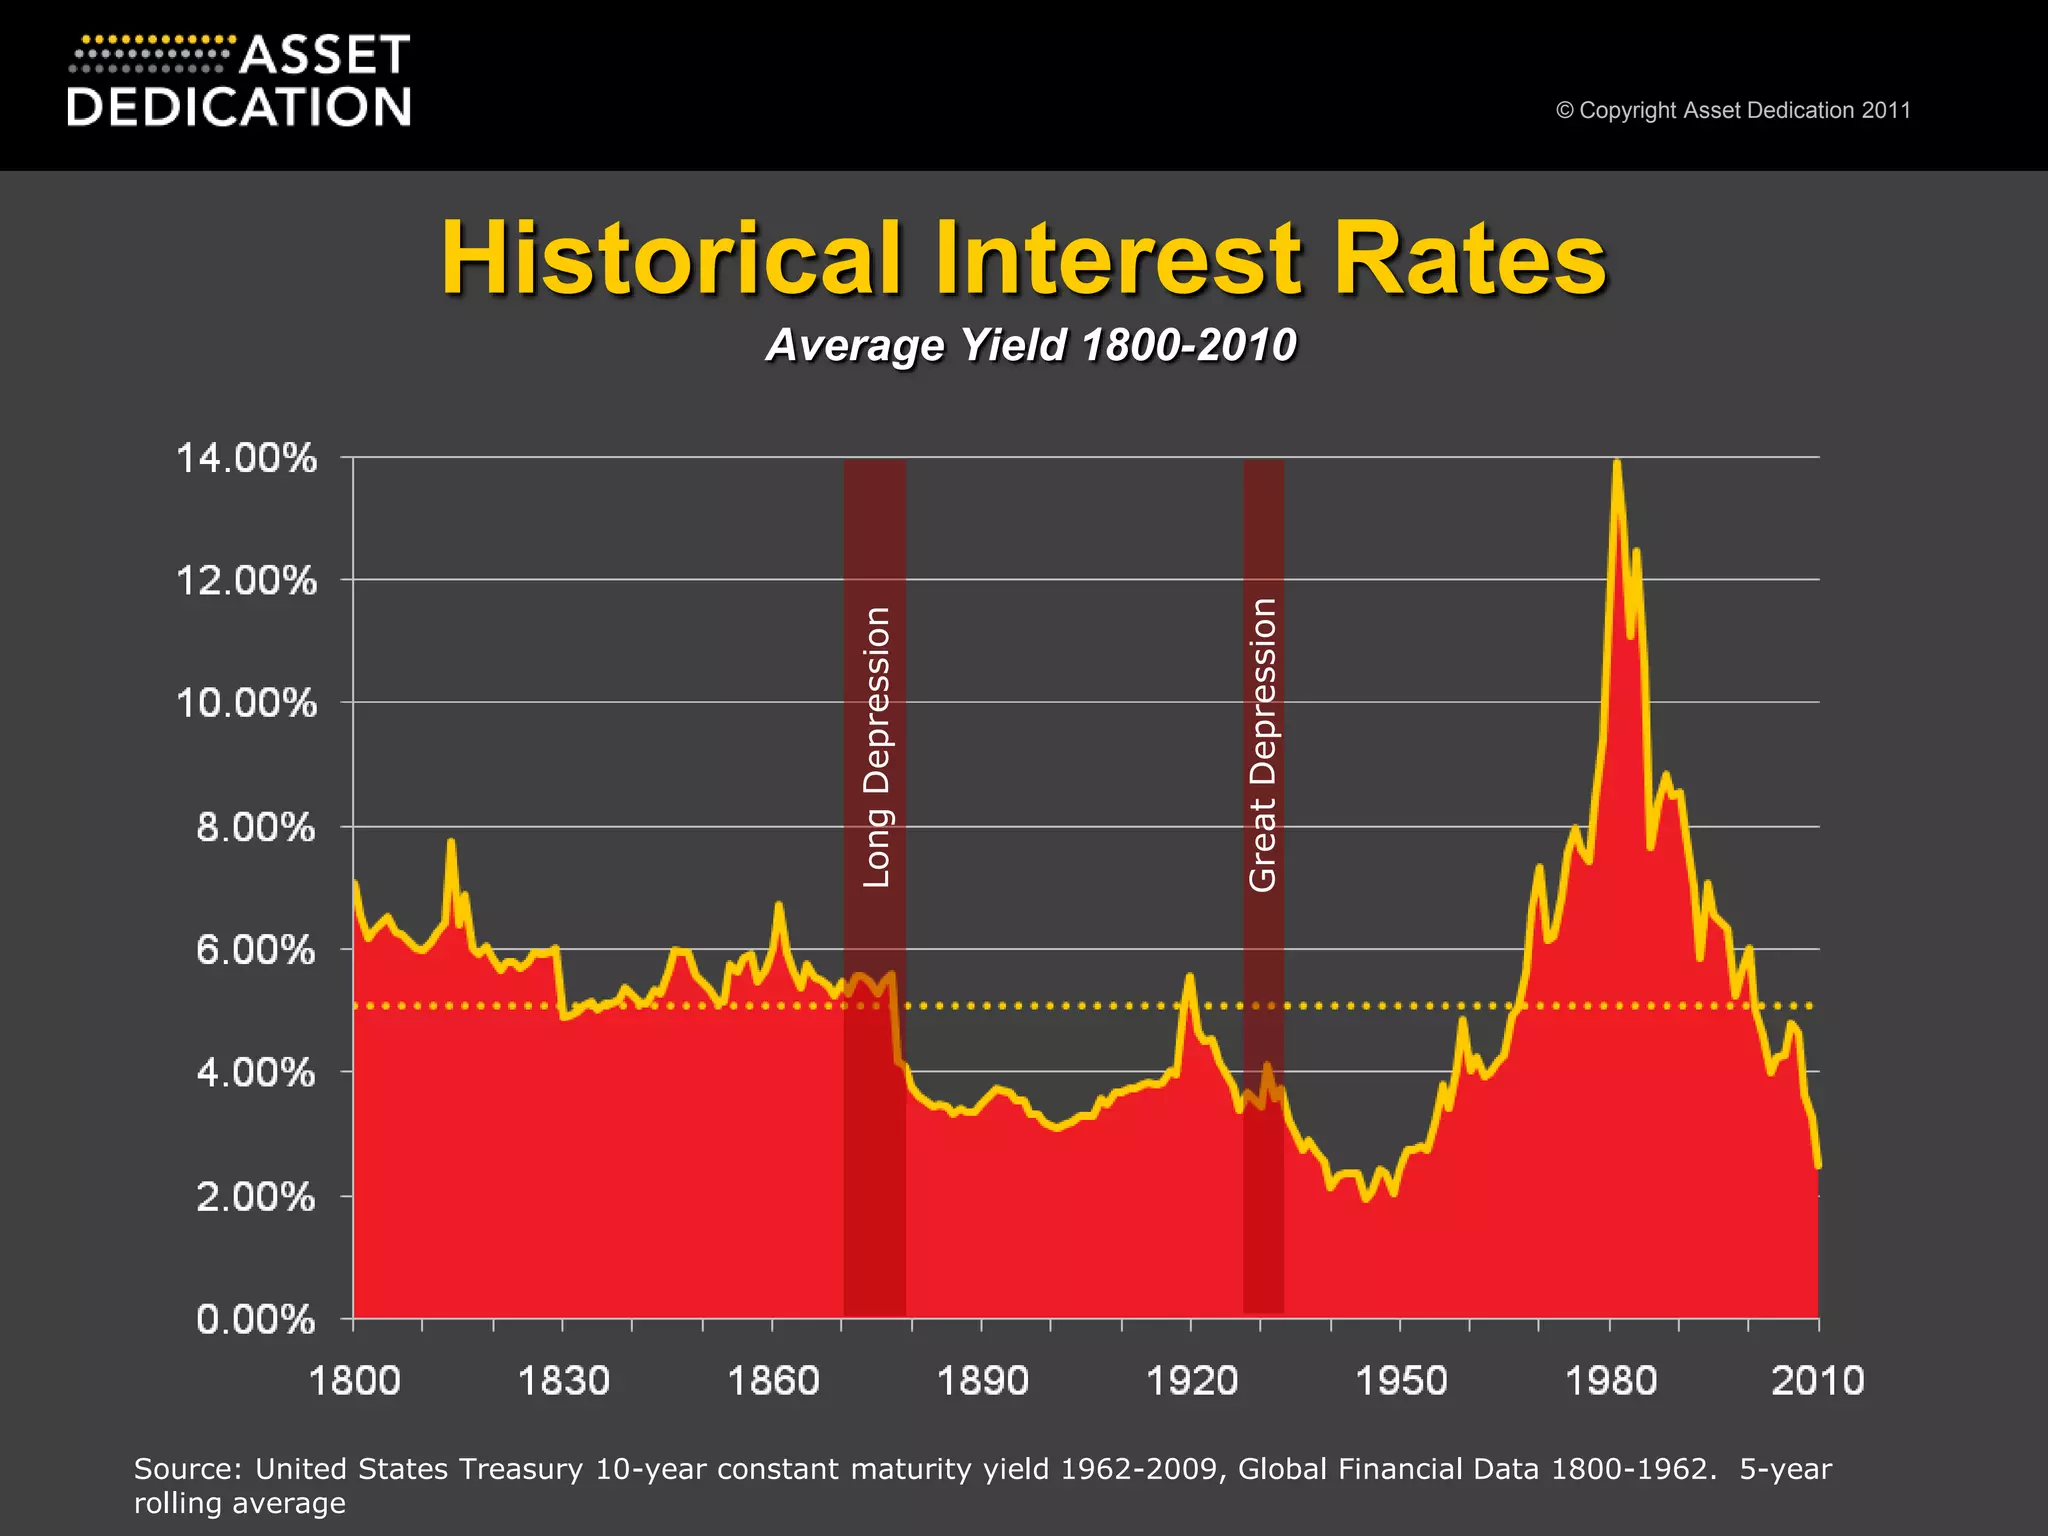
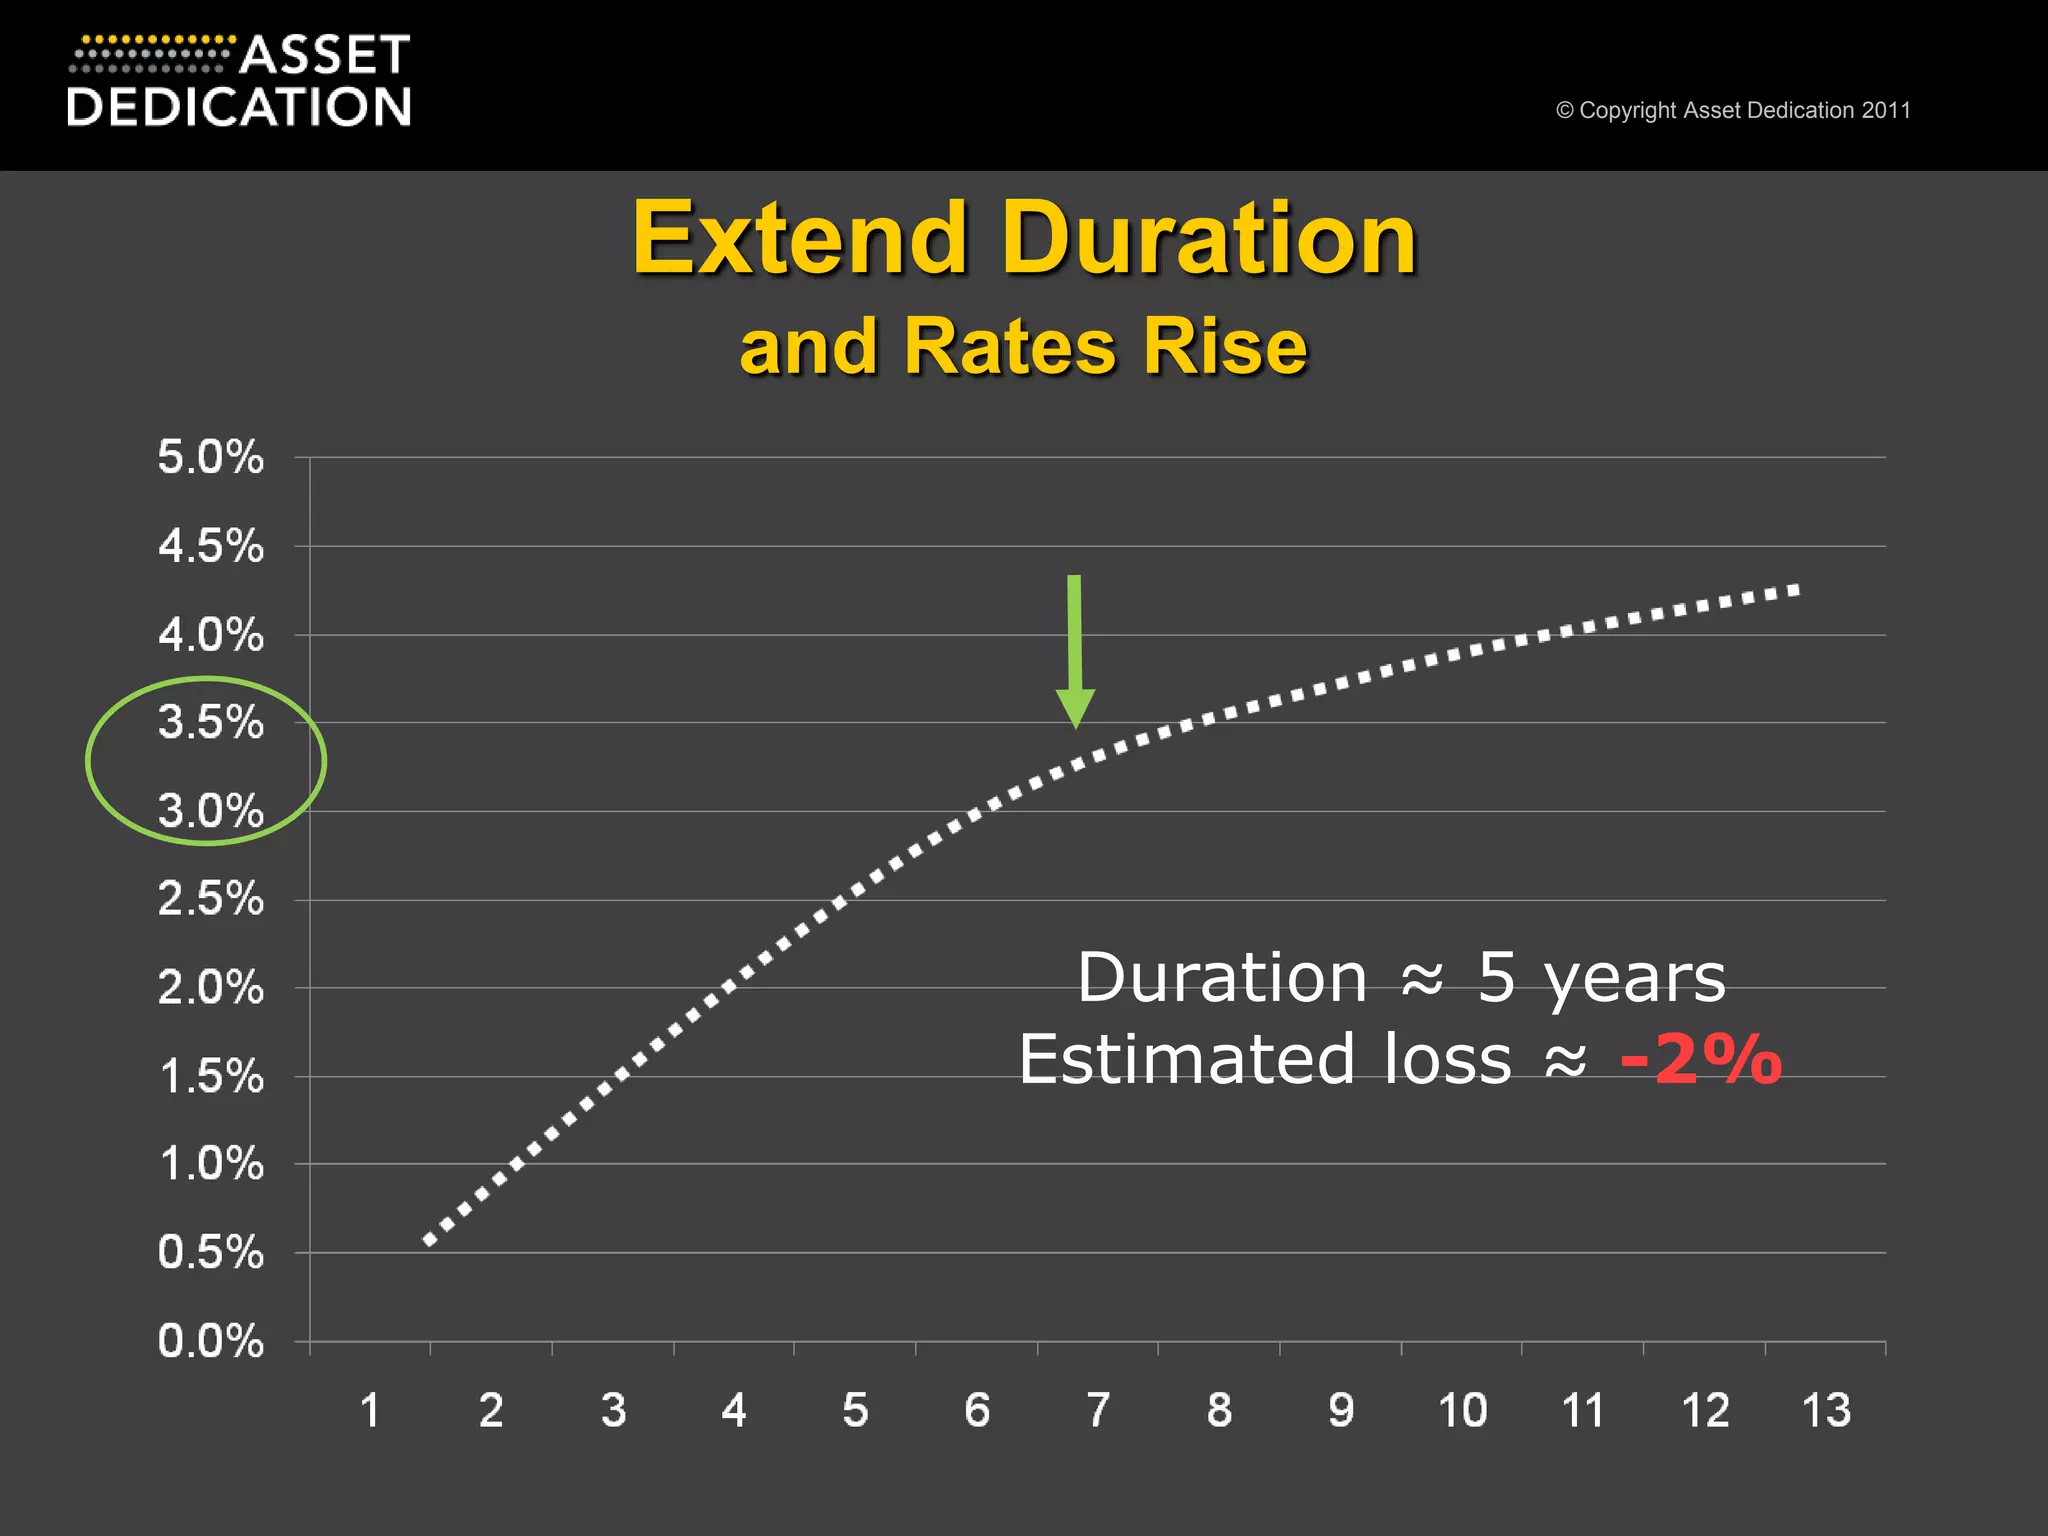
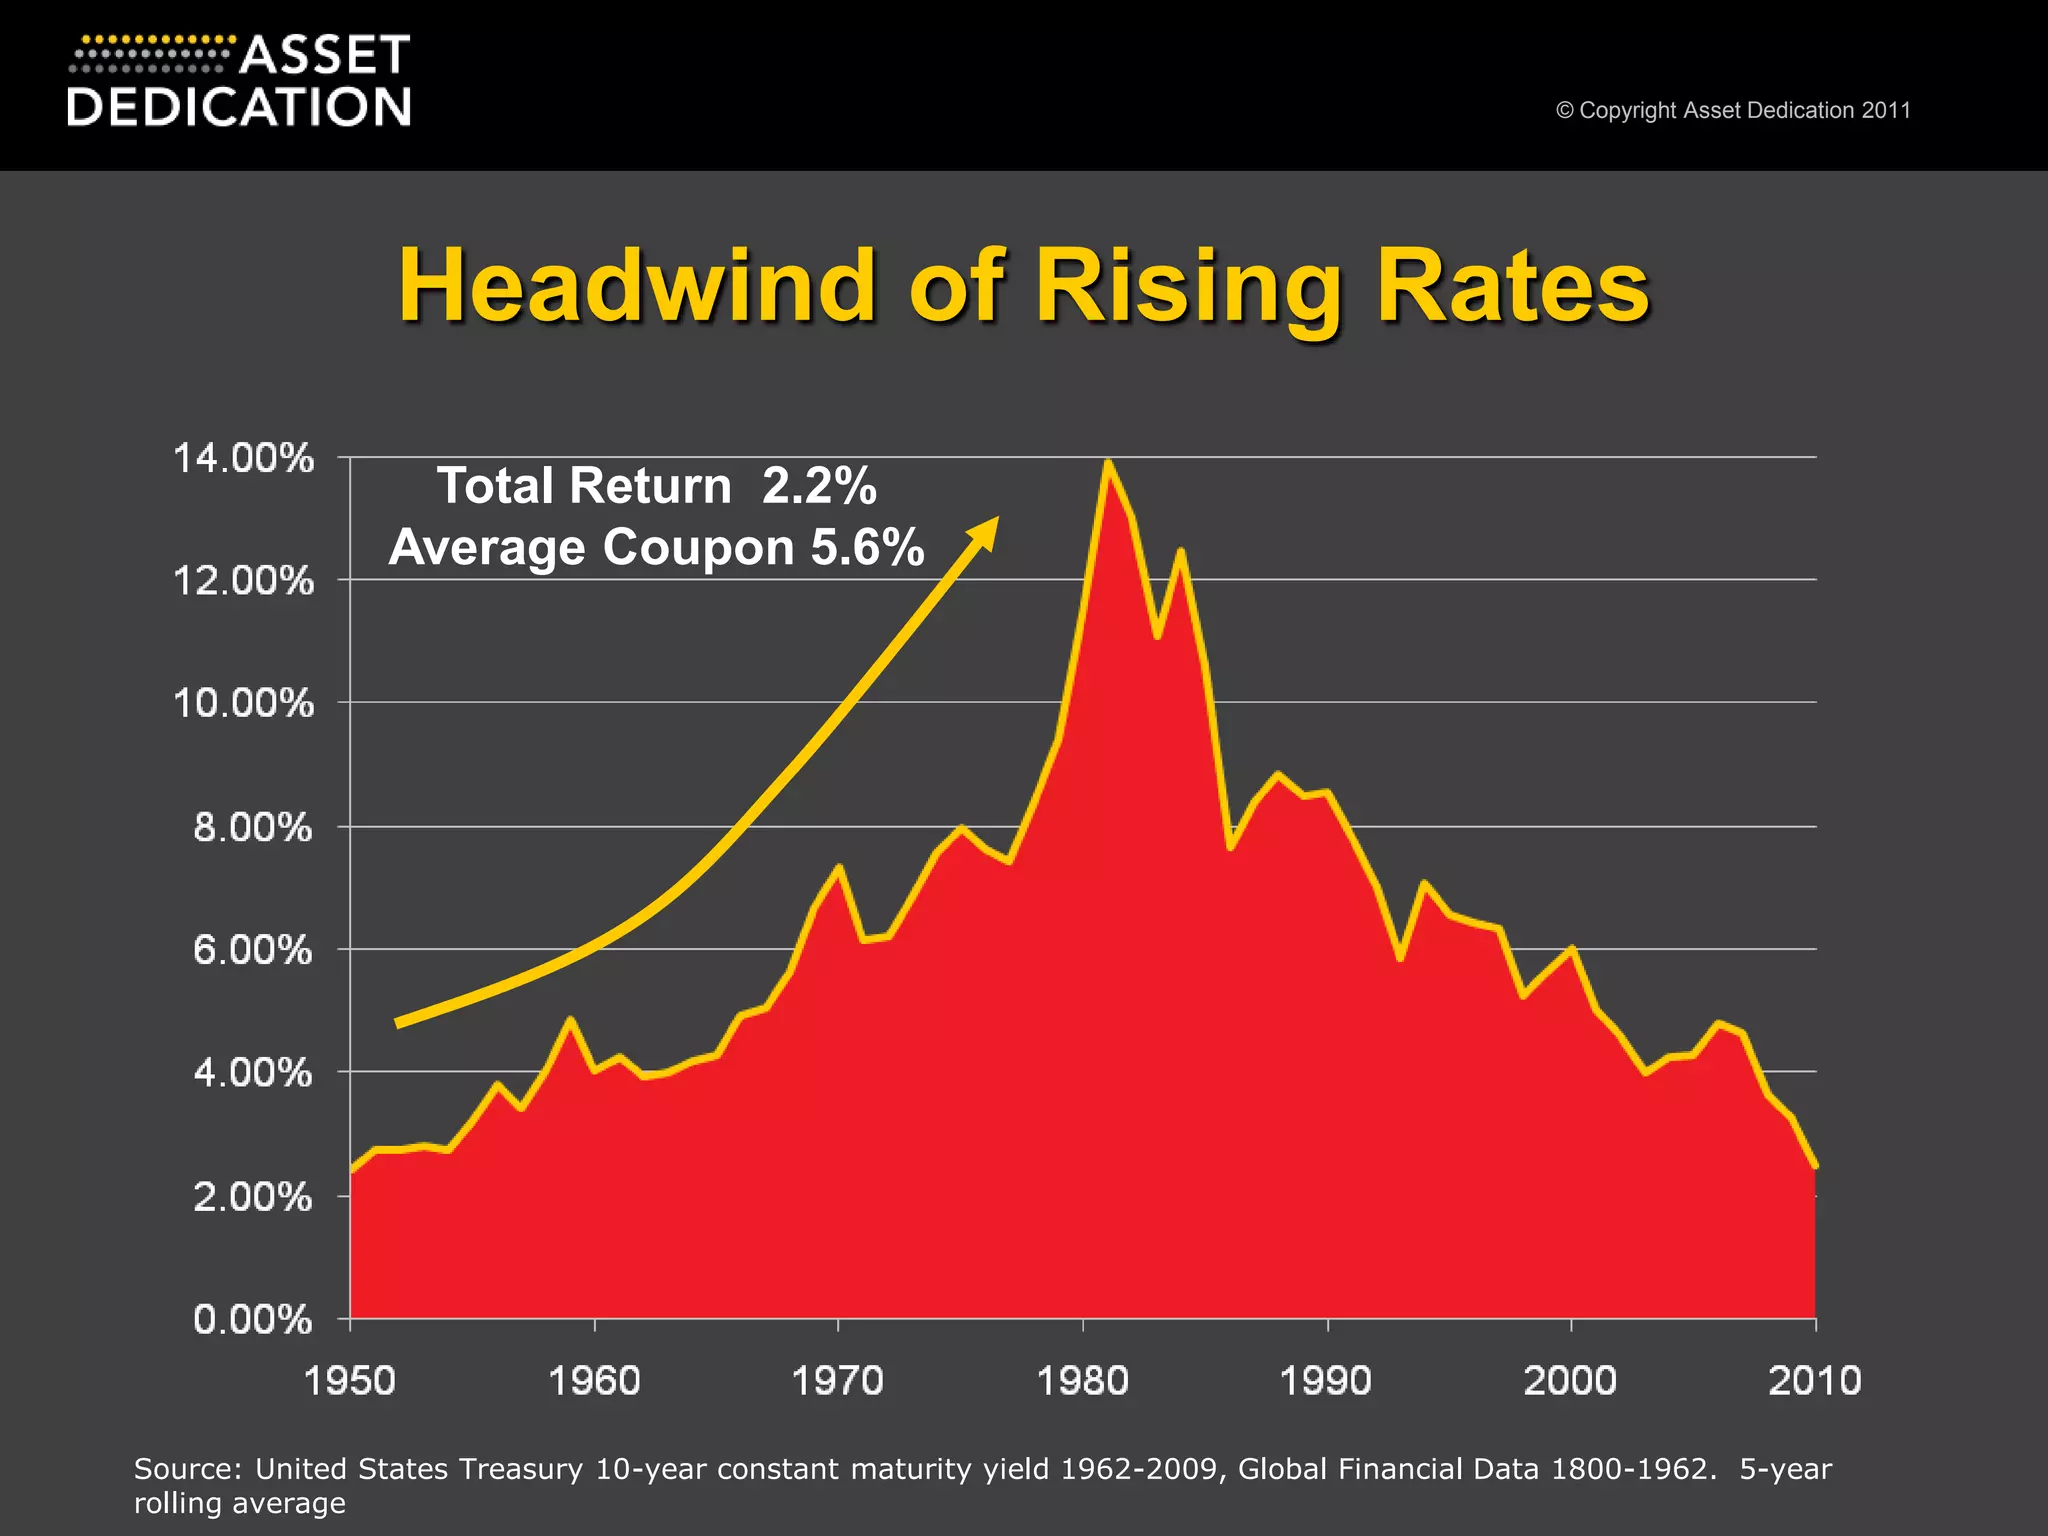
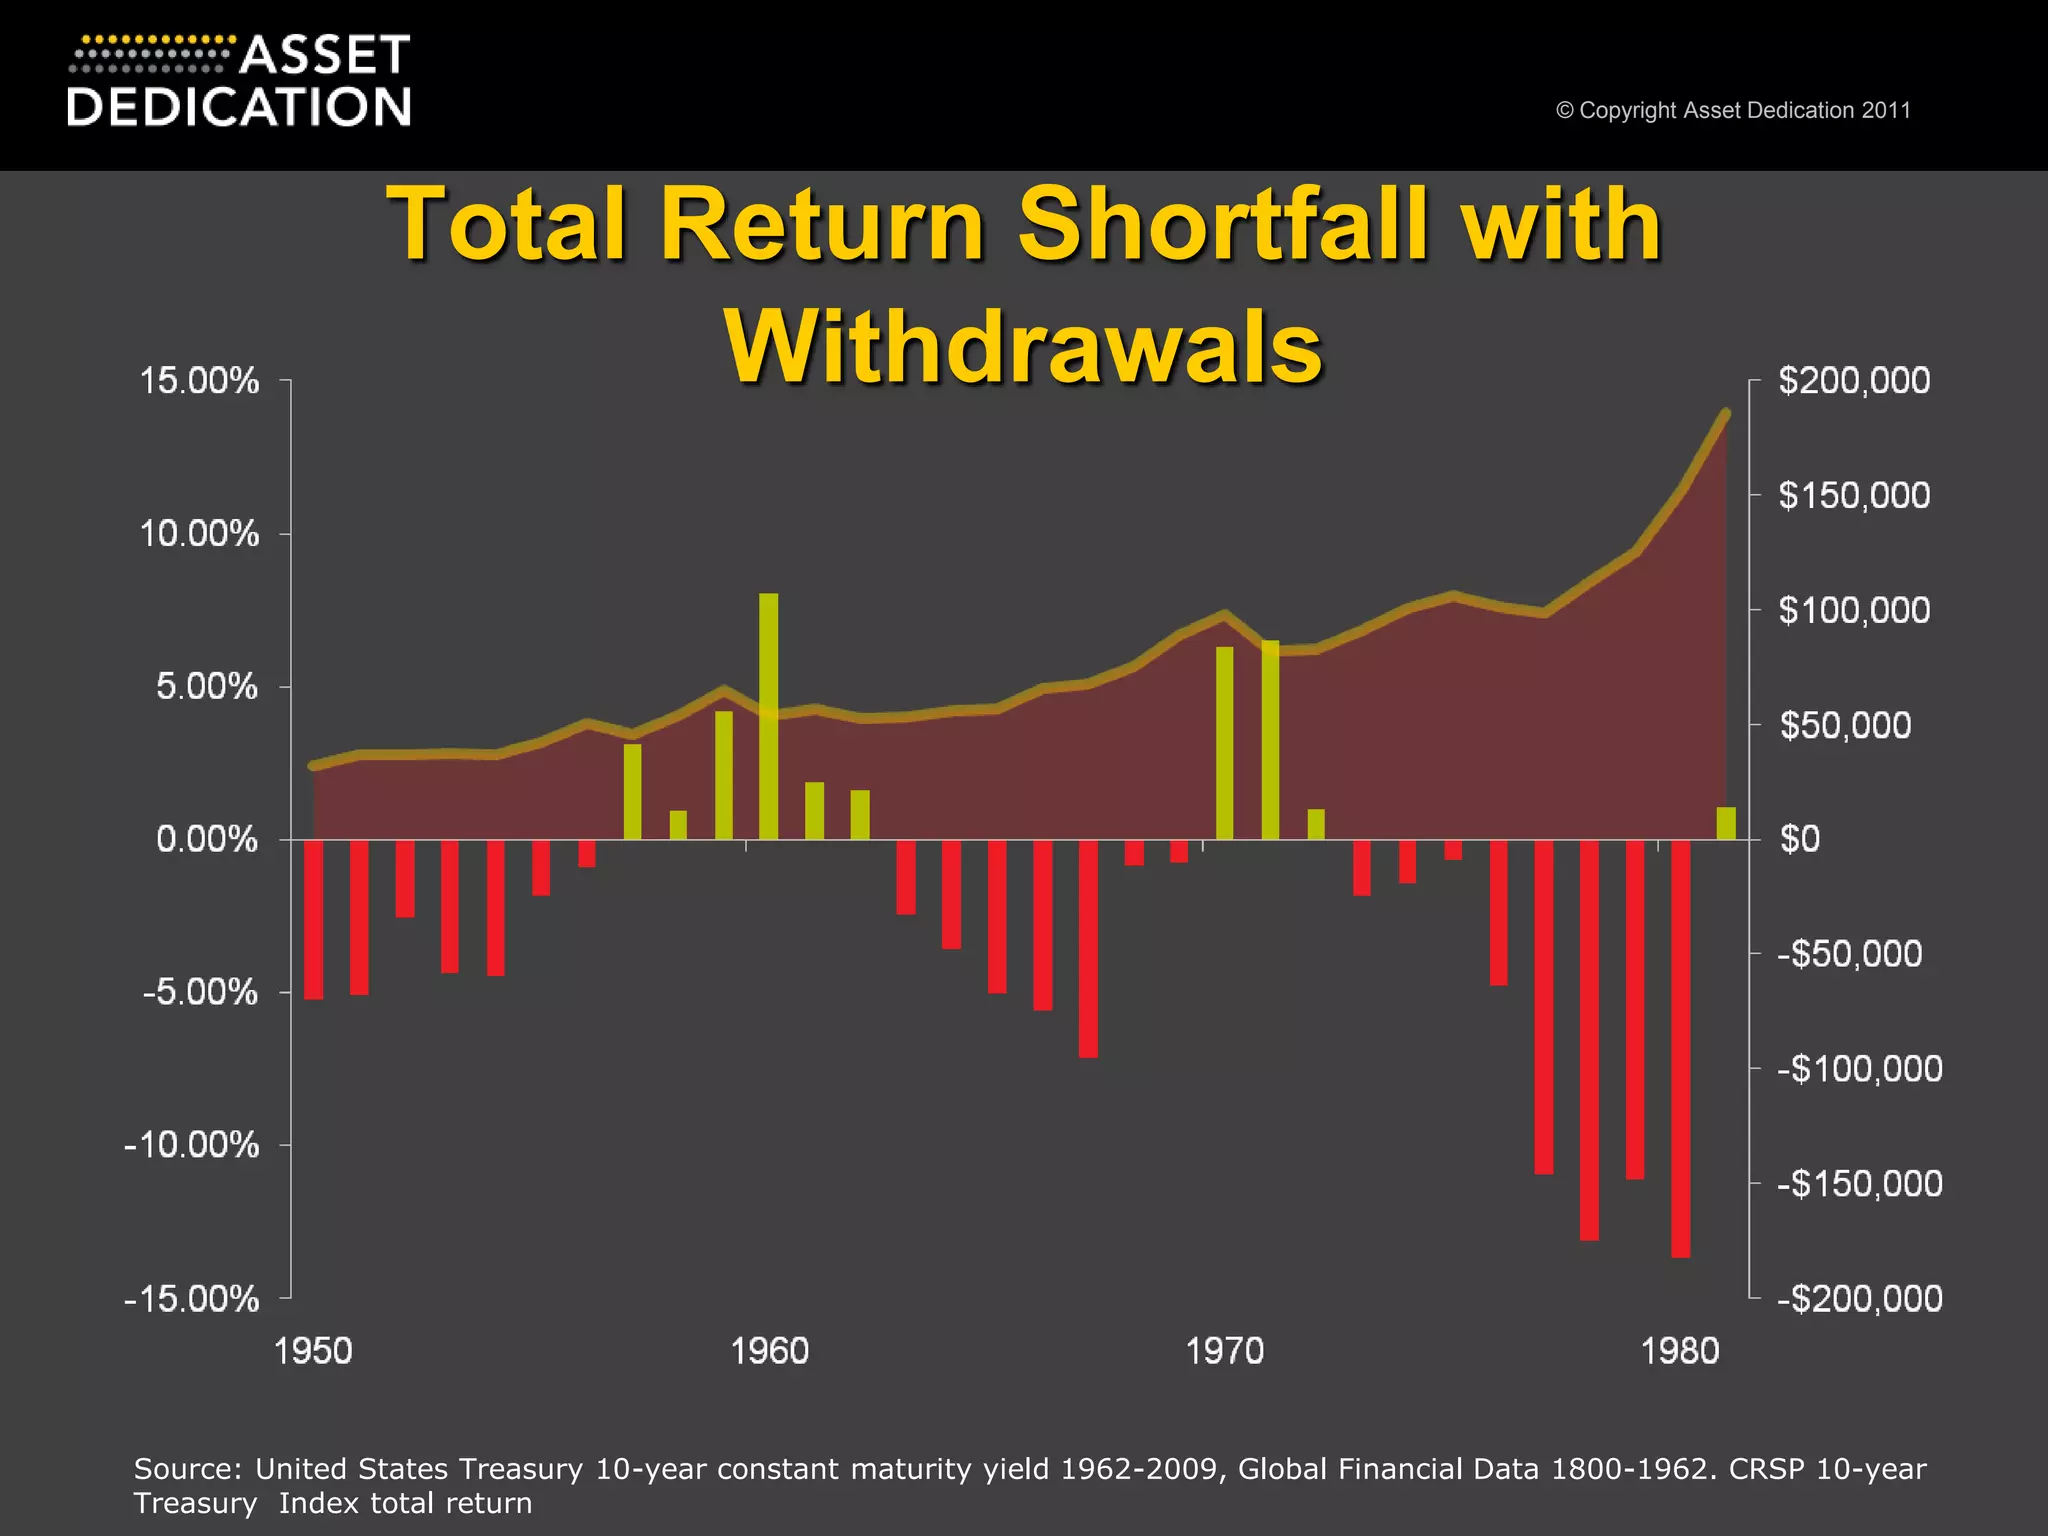
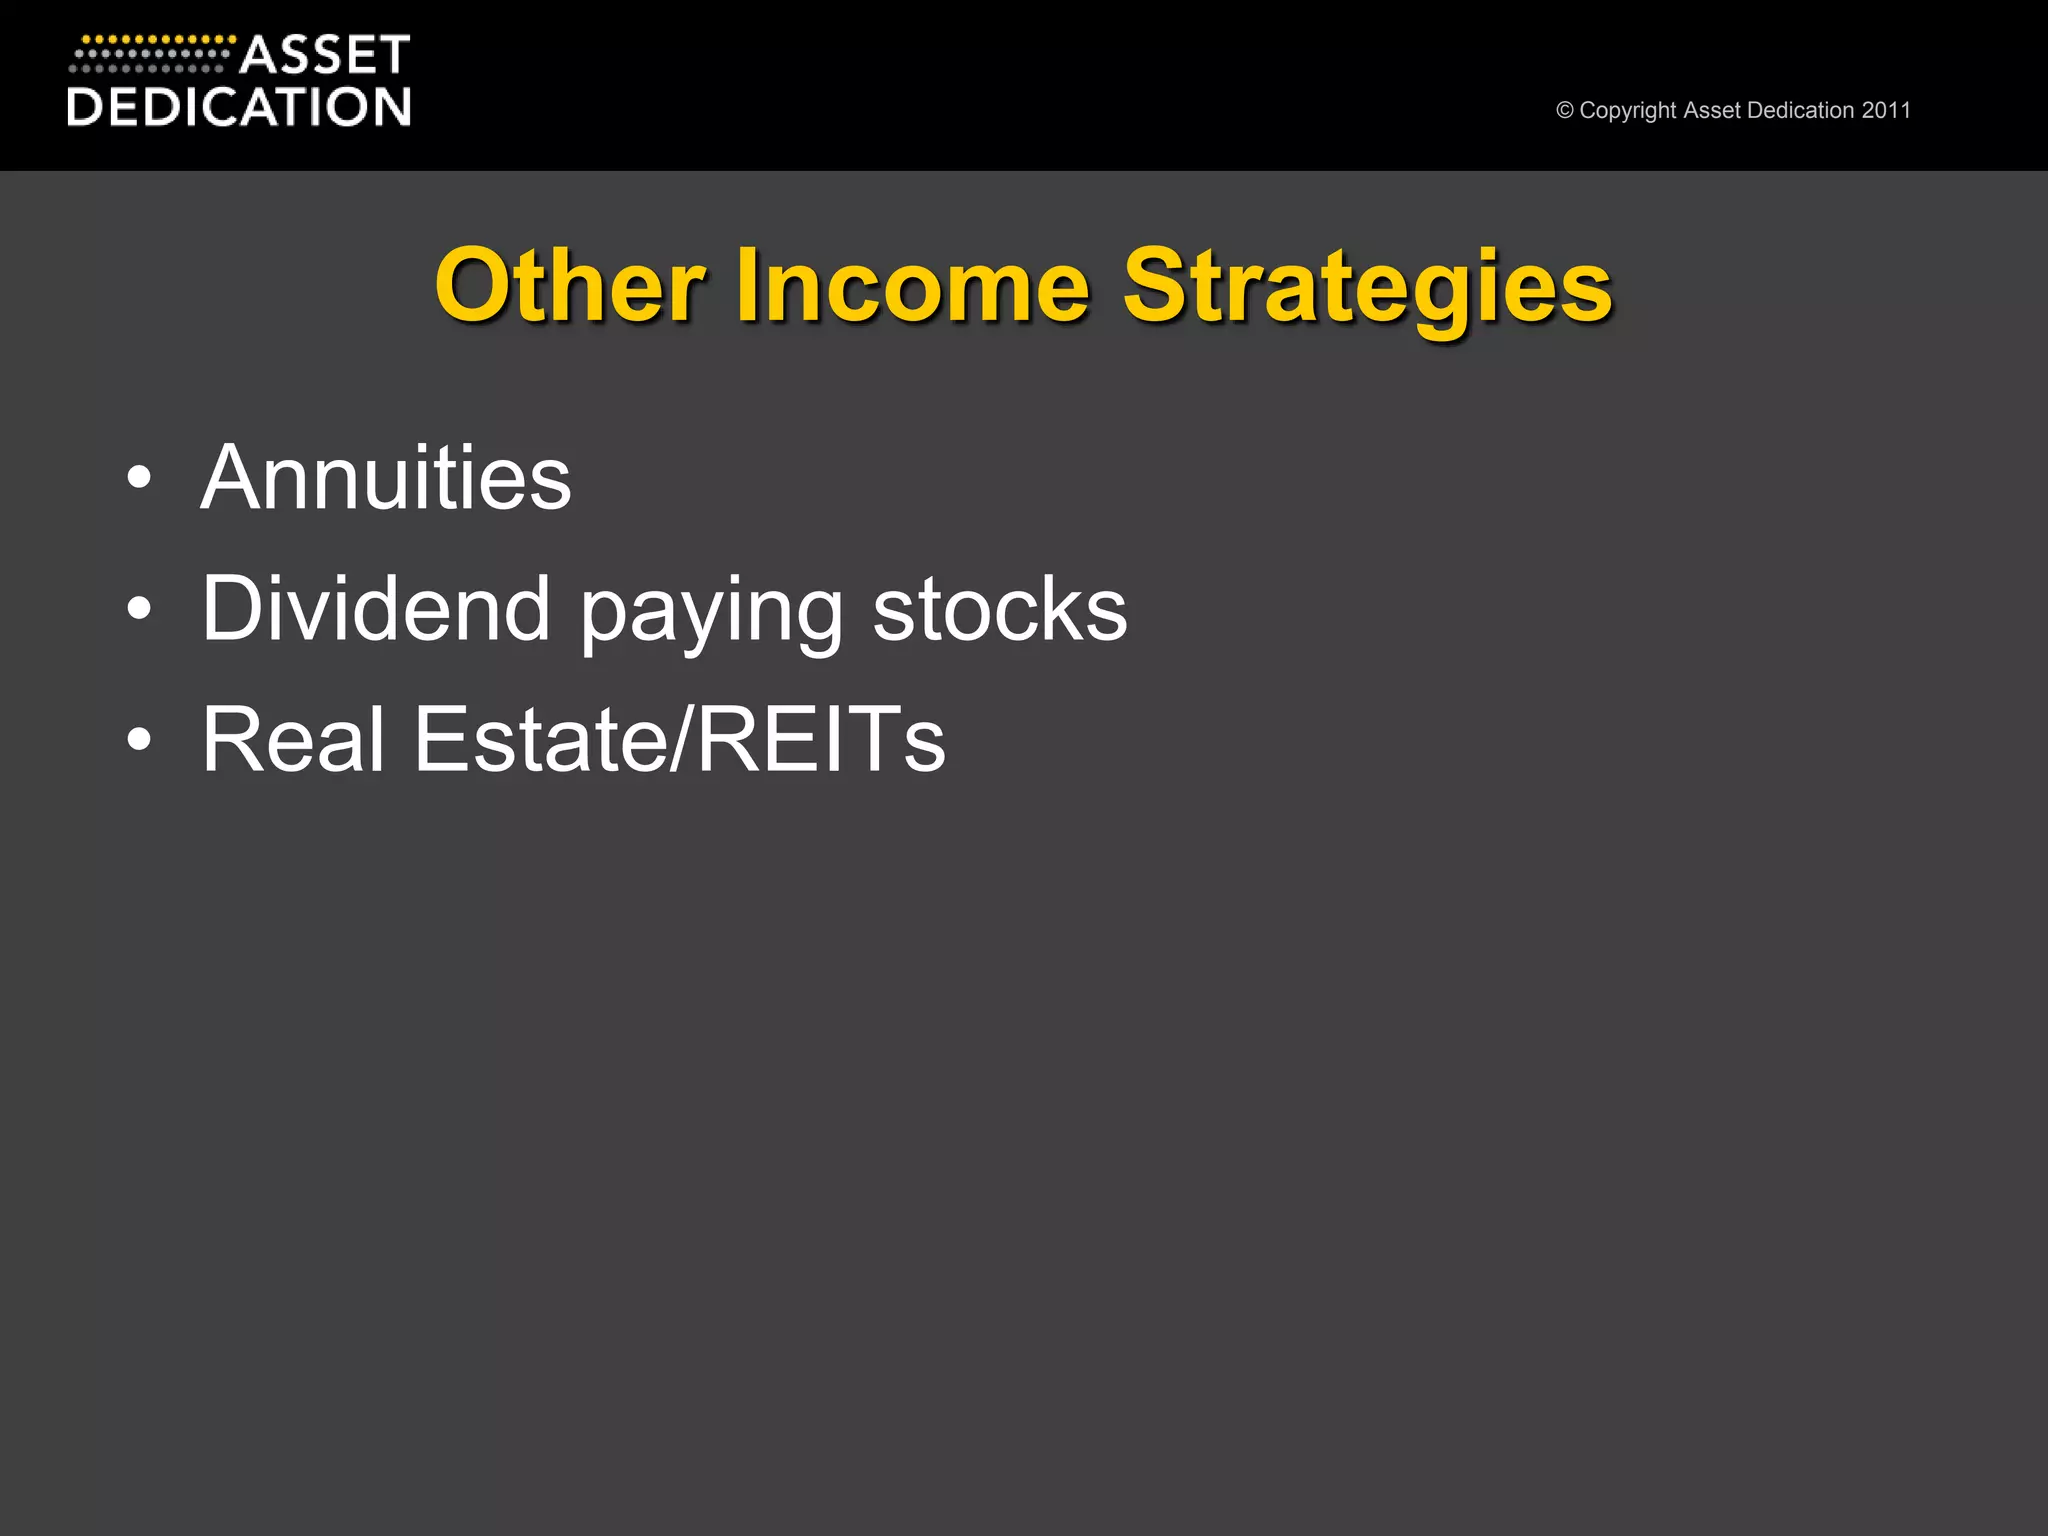
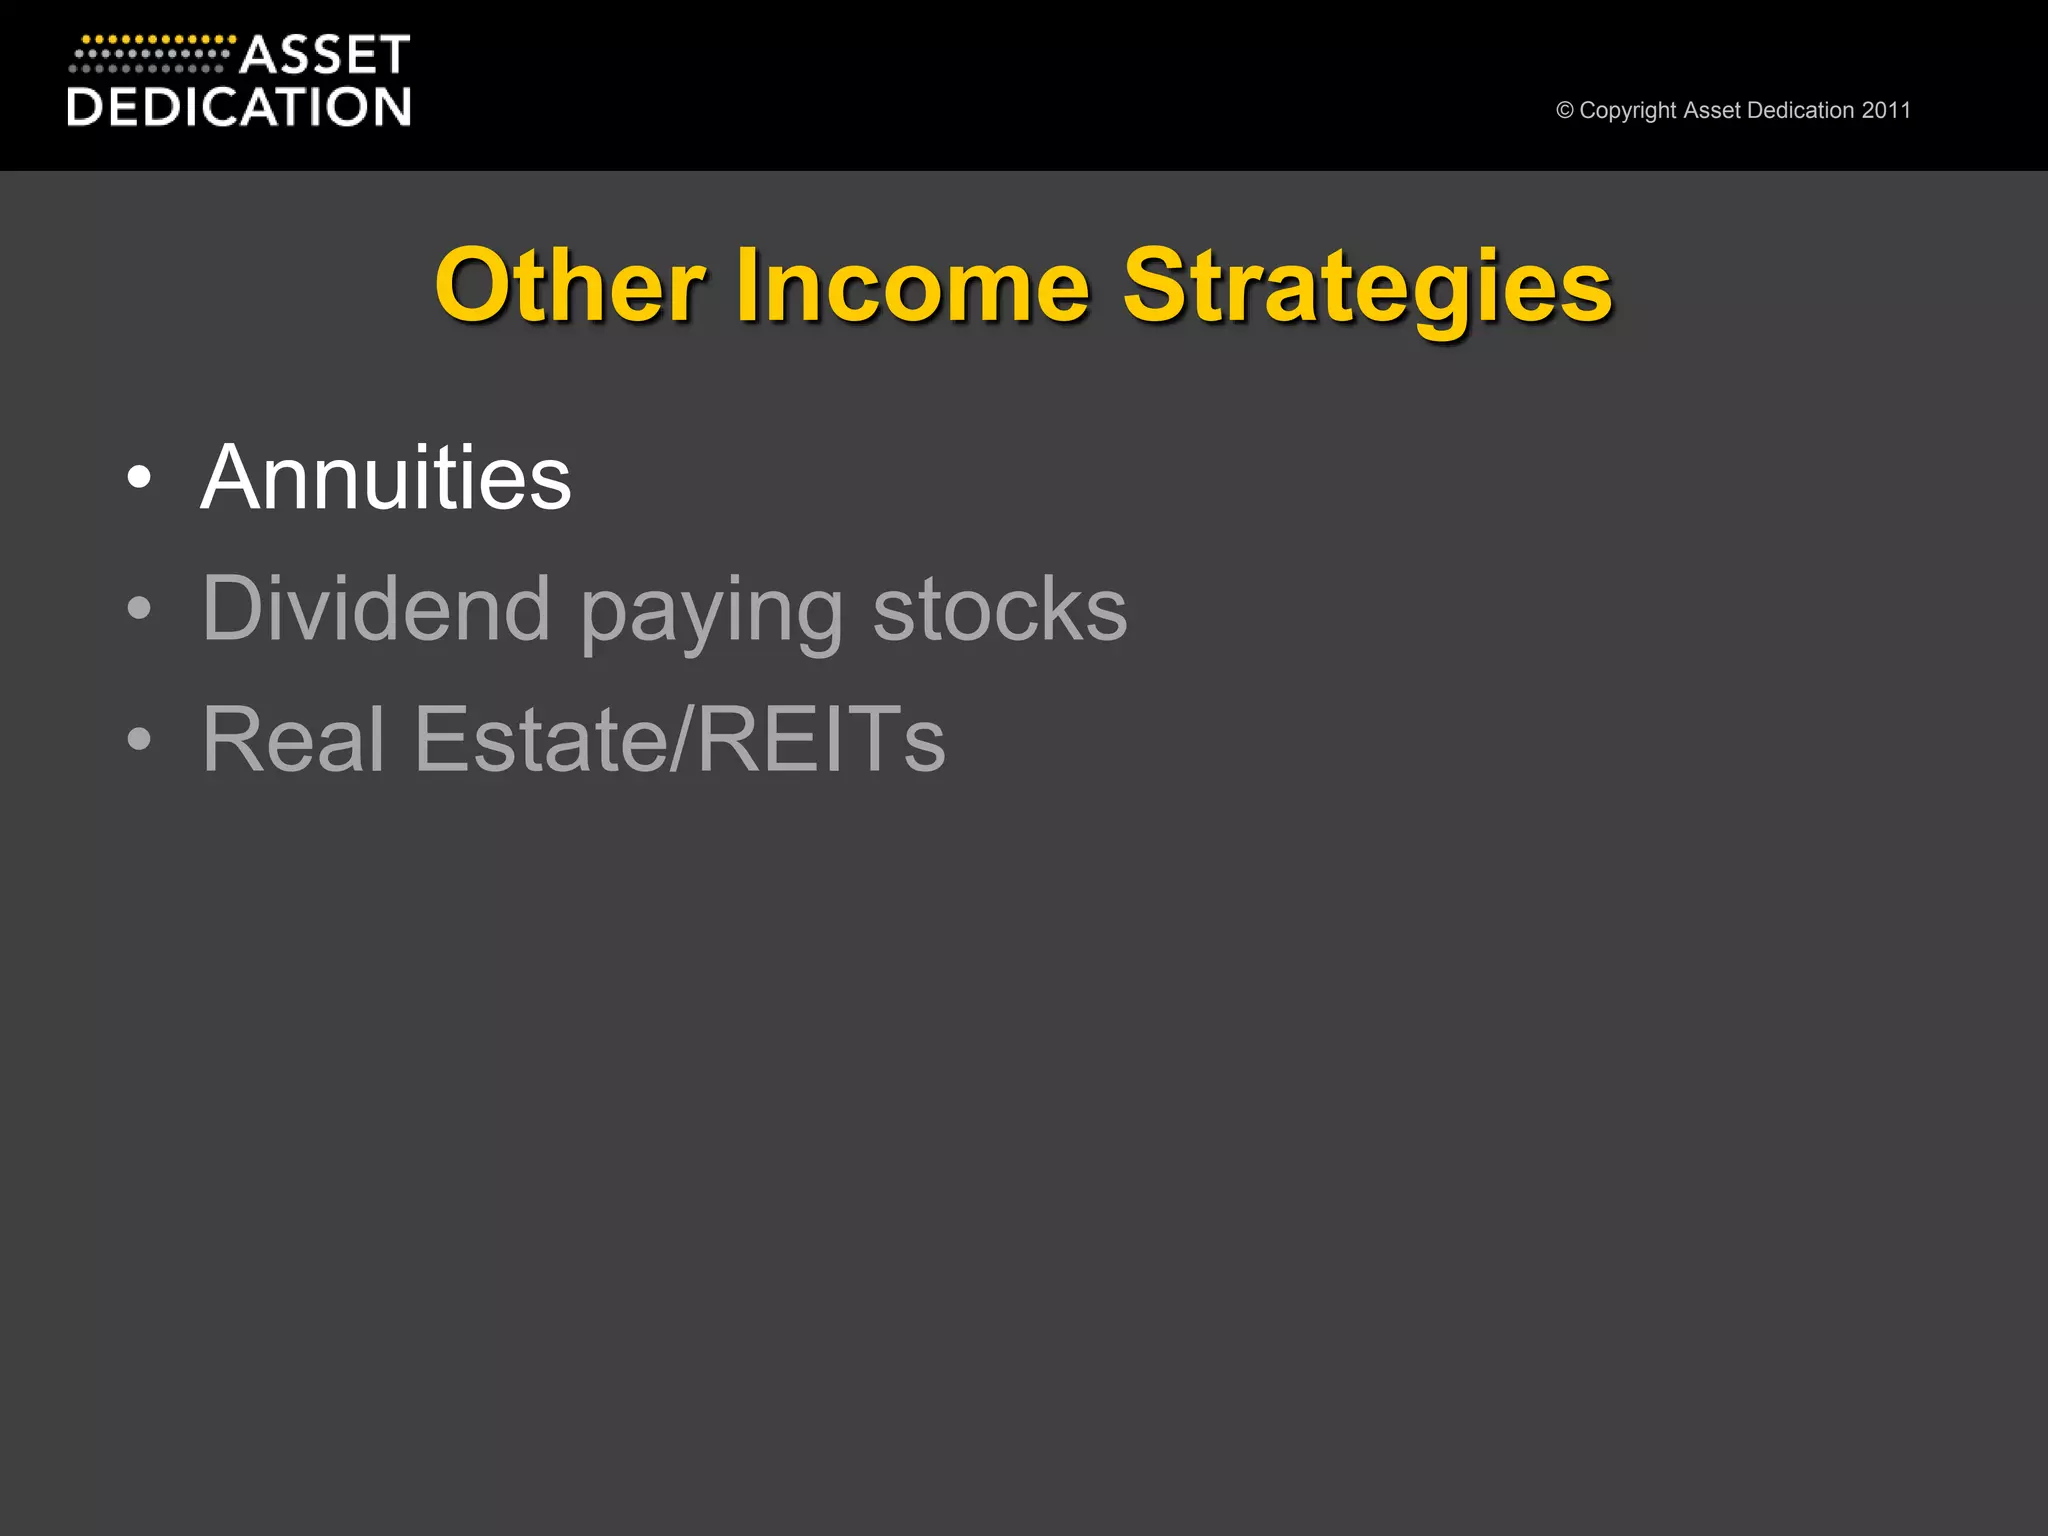
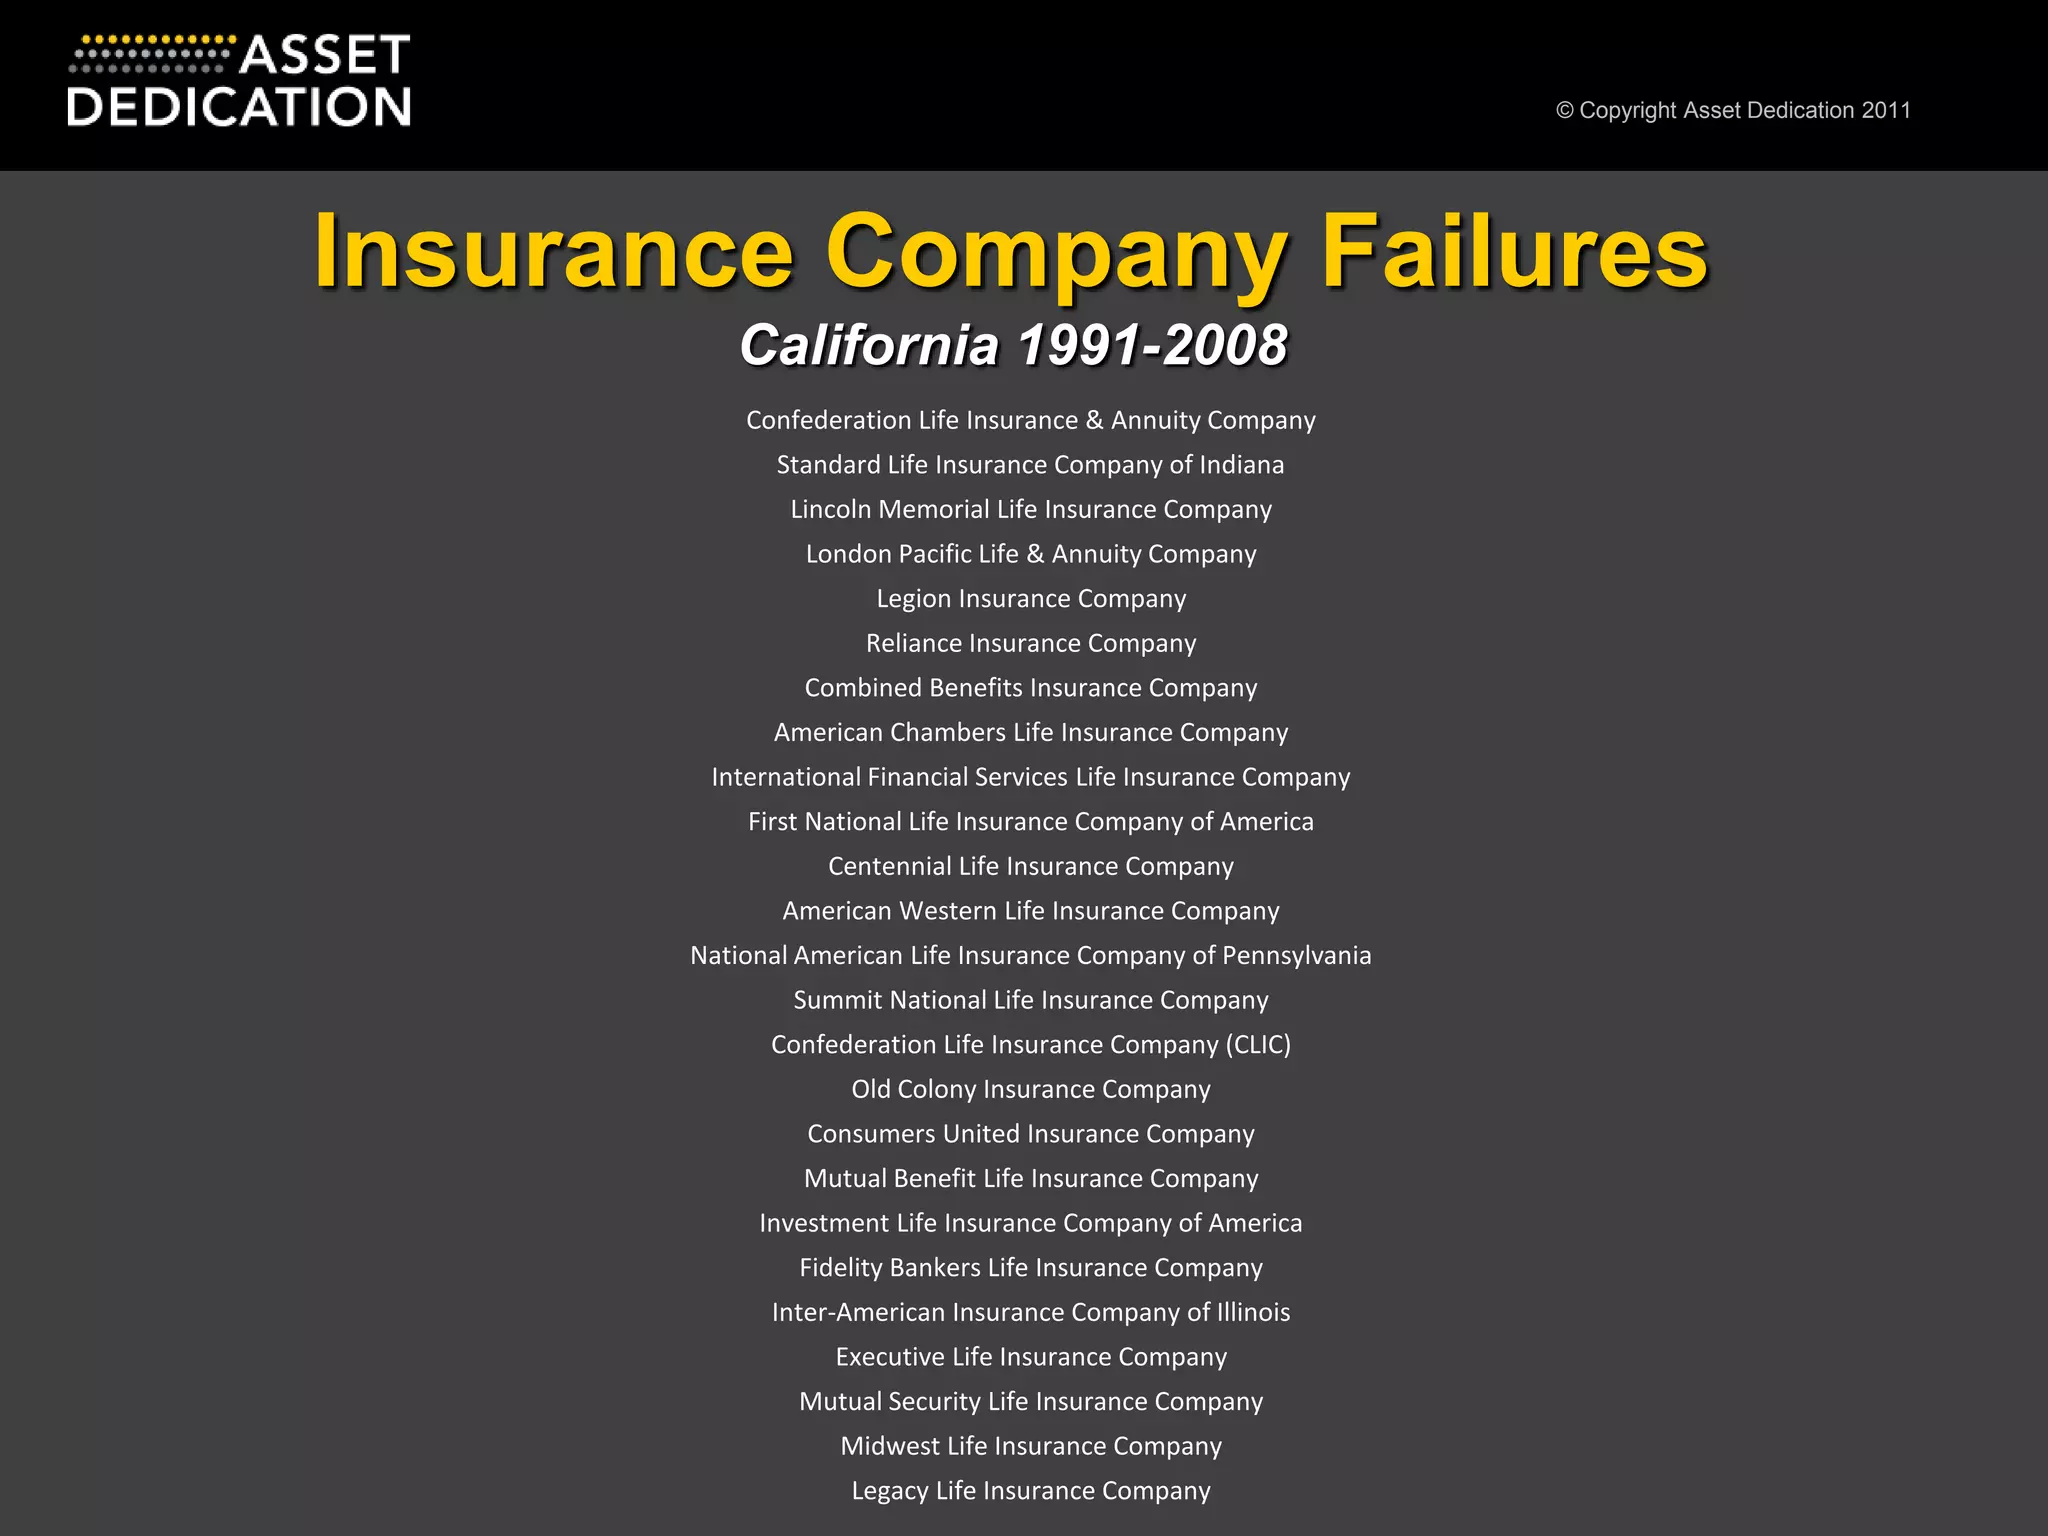
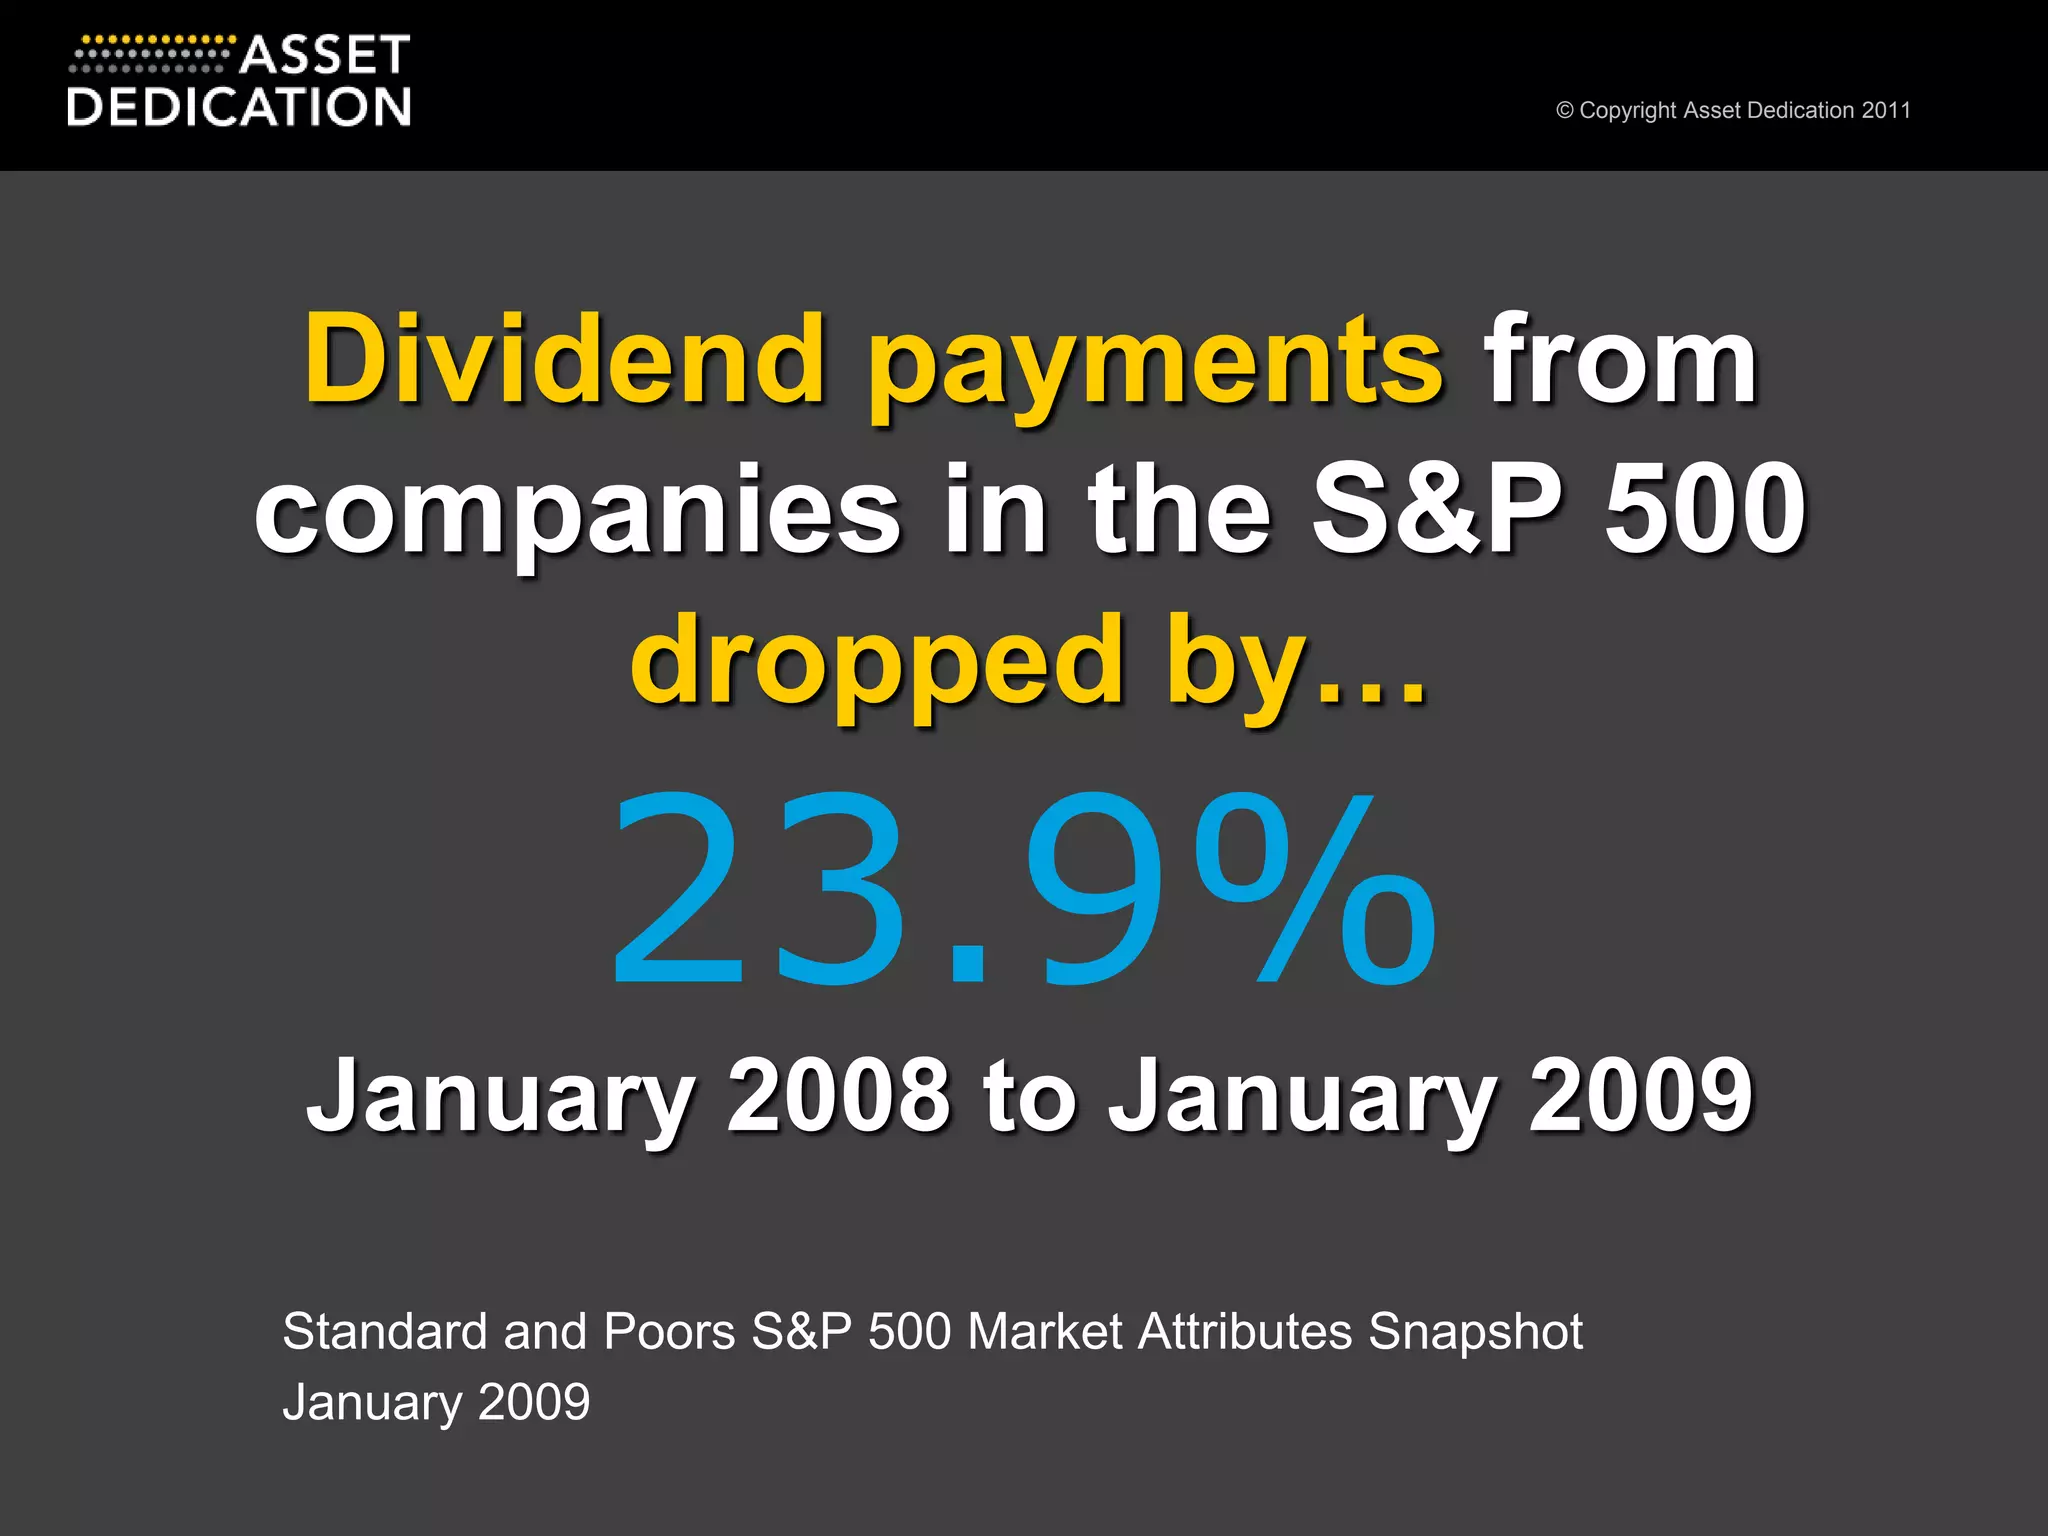
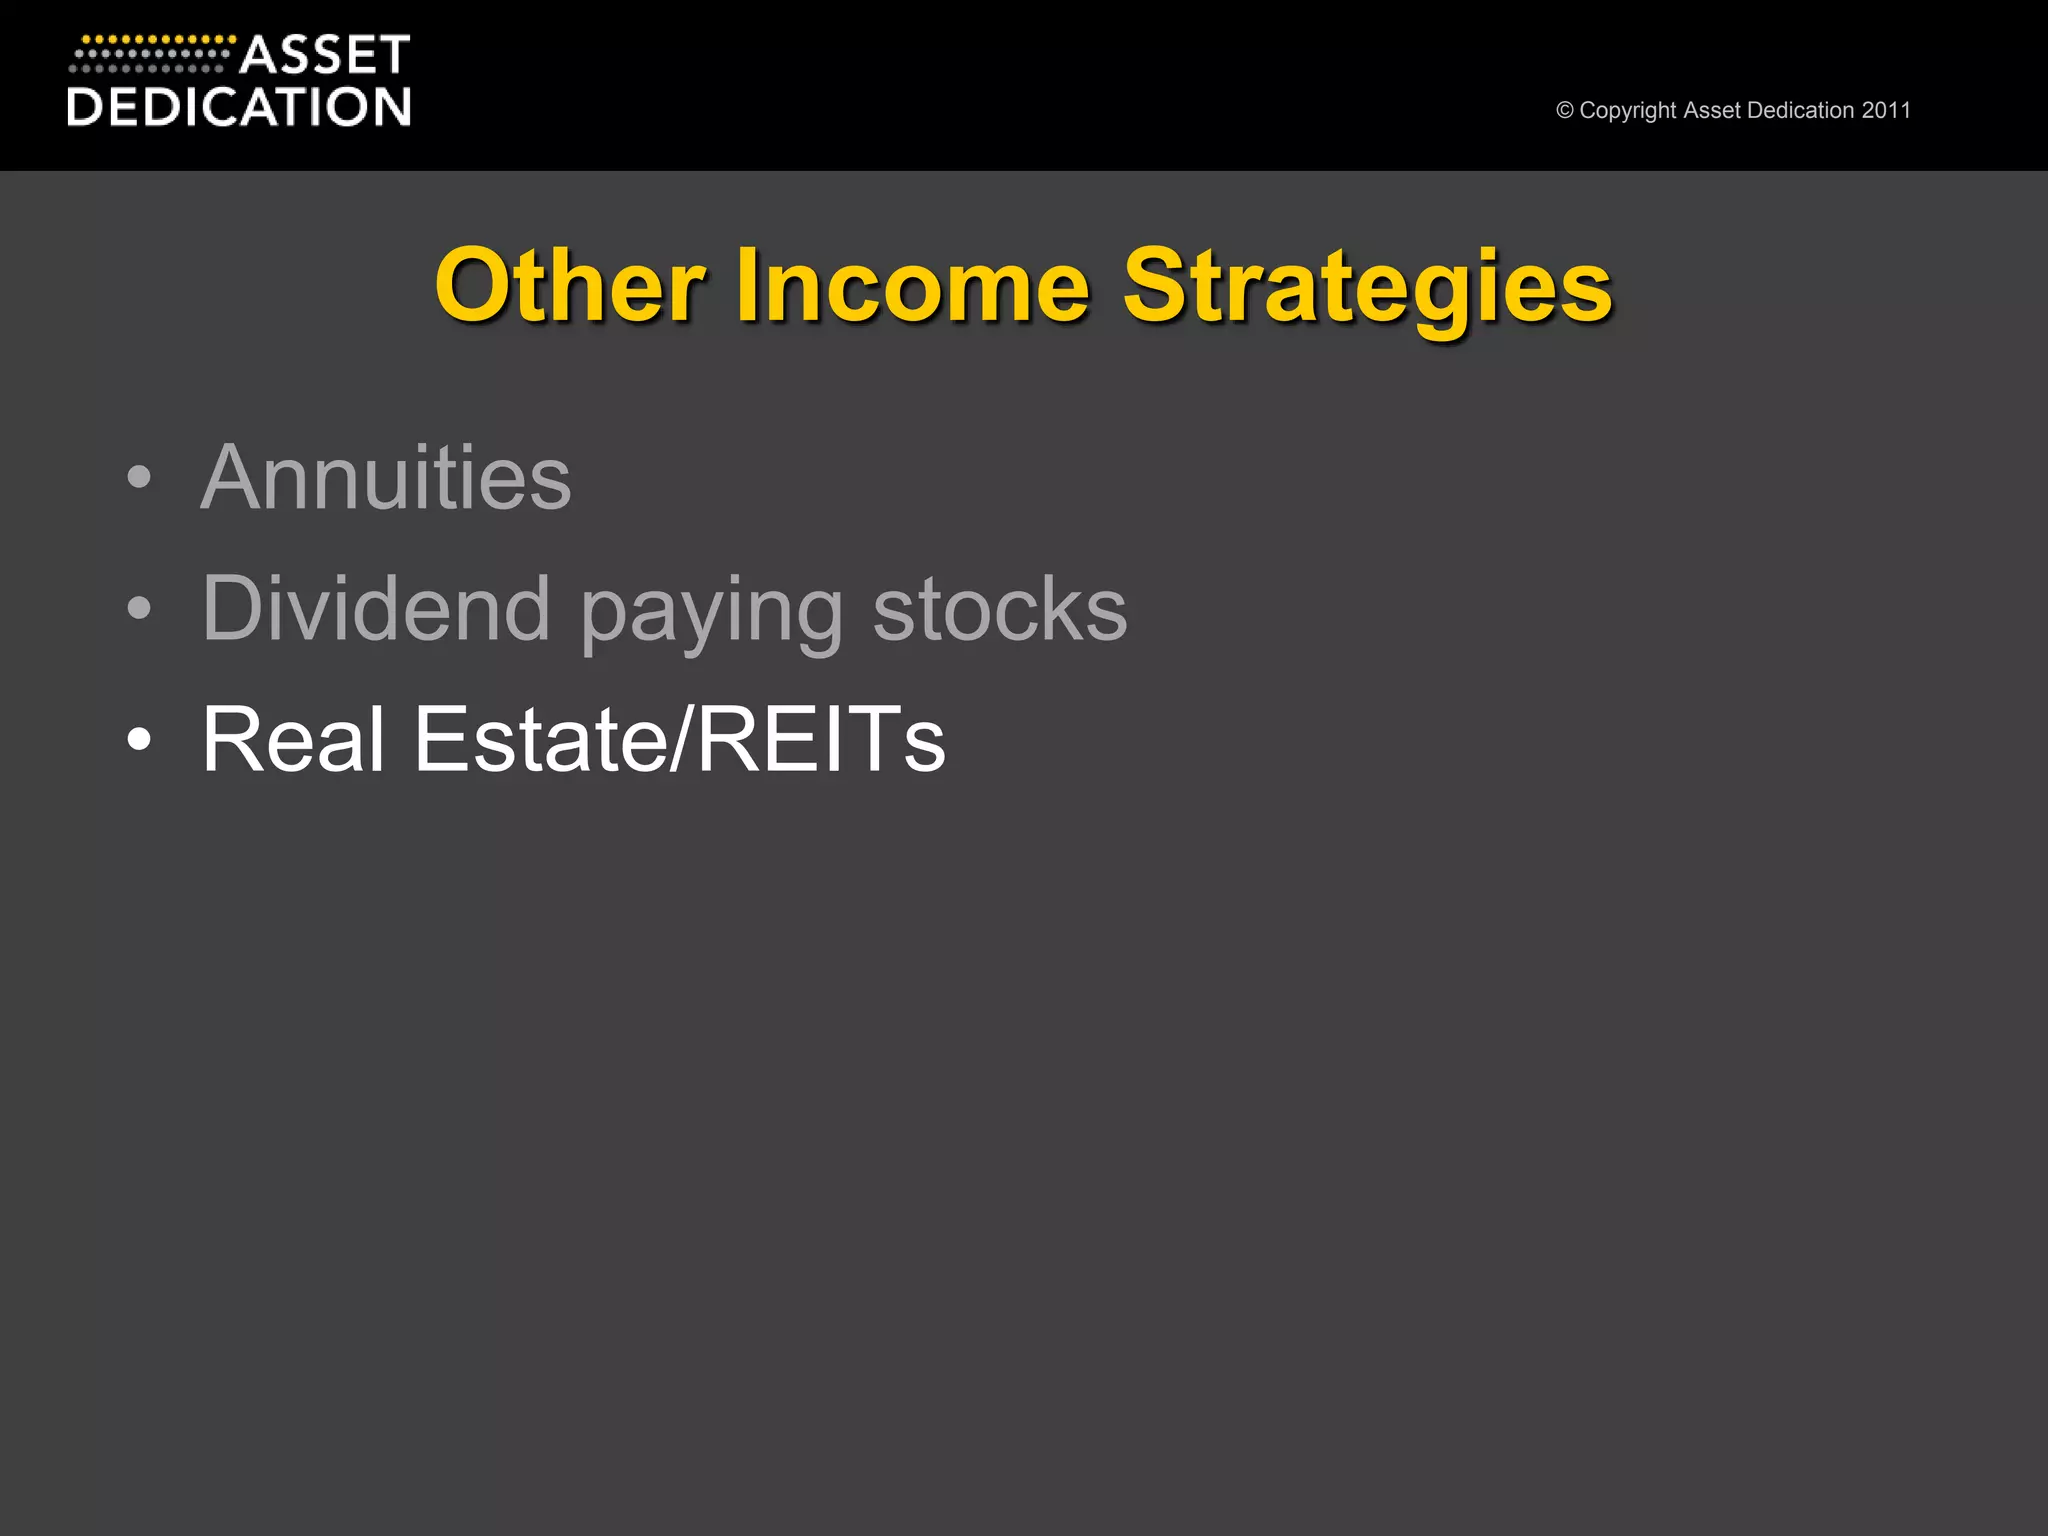
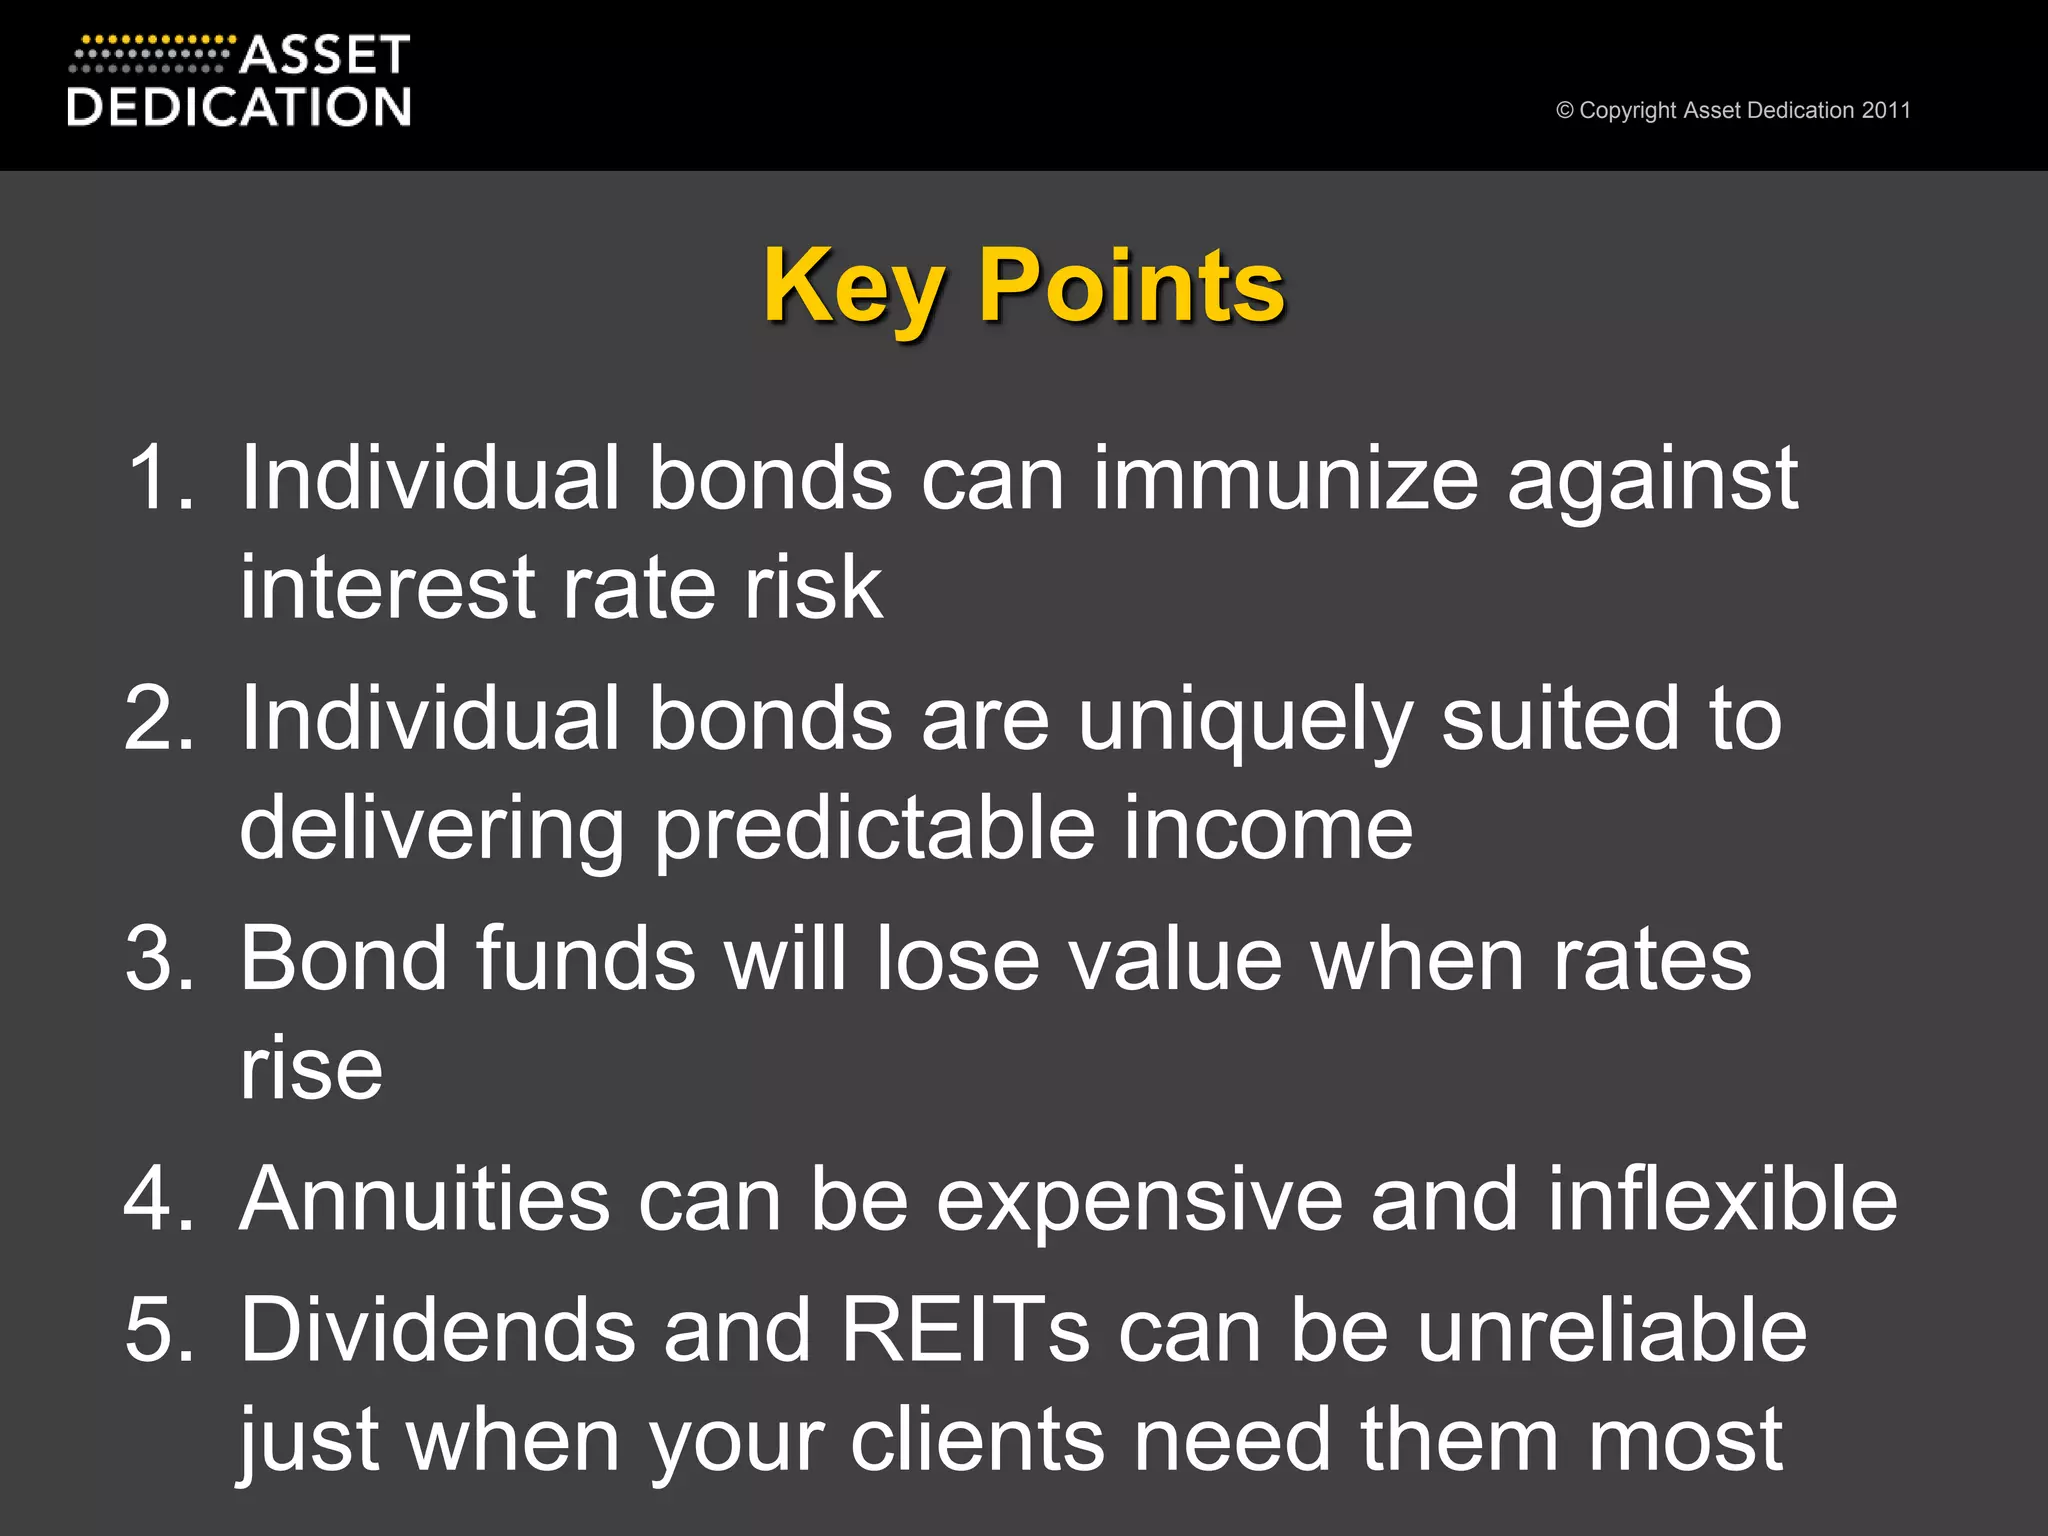
This document presents an alternative investment strategy called income matching using individual bonds. It describes how this strategy can provide predictable income streams through building portfolios of individual bonds that match a client's future cash flow needs. This strategy aims to immunize clients against interest rate risk by constructing bond portfolios with specific durations tailored to the timing of a client's expected expenses. It argues that individual bonds are better suited than bond funds or annuities for delivering reliable income due to risks such as fluctuating dividends, counterparty risk, and losses during periods of rising interest rates.
11. Liability-driven investing (LDI) is an investment strategy of a company or individual based on the cash flows needed to fund future liabilities Source: Wikipedia cash flows future liabilities
13. Clients with multiple goals and varying timelines have trouble relating to stocks, bonds and cash are blended into a single portfolio. People tend to use mental accounts to manage various goals in their head. A pure Total Return approach creates a single portfolio that isn’t intuitively linked to the underlying goals.
14. Client Needs Liquidity for current expenses Predictable near-term cash flows to cover near-term expenses (usually 8-10 years for those in retirement) Long-term growth to ensure sufficient growth to cover future needs
16. Splitting assets into multiple sub-portfolios helps clients better understand and stick to an allocation strategy. Bonds are specifically allocated to predictable current or future income (LDI). Equities are dedicated to long term growth, but are given time to ride through bad markets (long-term total return). Each asset class is dedicated to the function it best serves.
17. Total Portfolio Split into sub-portfolios to serve different purposes Bonds Stocks Total Return Liability Driven Investing
18. Asset Allocation and Time HorizonUsing Asset Classes That Fit How Clients Think About Their Money Stocks Bonds Cash 8 Years – Prefers predictable bonds Today - Prefers liquidity of money market 9 Years – Prefers higher return prospects of stocks Next Year – Prefers predictable bonds 7 Years – Prefers predictable bonds Time
19. Parallels Between MPT and DPT Modern Portfolio Theory Dedicated Portfolio Theory Risk-free asset = T-bills Risk-free asset = Fully immunized cash flow stream Return Return Risk Risk
20. How Often Bonds Beat Stocks S&P 500 and Intermediate Treasury Bond Index 1927-2009
21. Worst and Average Spread S&P 500 and Intermediate Treasury Bond Index 1927-2009
23. Income-Matching “Paycheck” Portfolios Immediate Income Portfolio – Cash flows begin now Deferred Income Portfolio – Cash flows begin later, when the client retires
27. Immunization Definition “When a bond portfolio is immunized, the investor receives a specific rate of return over a given time period regardless of what happens to interest rates during that time.” Morningstar Bond Course 104
31. Double Duty From Bonds Standard Benefits Beta exposure to fixed income Diversification Dampen volatility Unique LDI Benefits Predictable cash flows Immunization from rising interest rates 8 Years of Income
32. Source: Asset Dedication, 2009. Data set 1927-2008. Indices used for comparison: Equities (both models)—Standard and Poors 500 Index; Total Return Fixed Income Allocation—Barclays Capital US Intermediate Government Index; Asset Dedication Fixed Income—1975-2008 Treasury Bond quotes (source WSJ), 1927-1974 prices backcast against Treasury yield curve.
34. The Dynamic Dimension -“Flexible” Rolling Horizons Using time to ride out bad markets Taking more off the table when markets have been good Do Not Roll . . . Years
35. Immediate vs. DeferredIncome Portfolios Immediate Income Portfolio – Cash flows begin now DeferredIncome Portfolio – Cash flows begin later, when the client retires
46. Decomposing Bond Fund Total Return Income Return Income return represents the sum of portfolio’s coupon payments Income is never negative Price Return Bond prices are inversely related to interest rates Bond prices fall as rates rise
49. 30 Years of Tailwinds Total Return 11.3% Source: United States Treasury 10-year constant maturity yield 1962-2009, Global Financial Data 1800-1962. 5-year rolling average
53. Rising Rates 1950-1981 Source: United States Treasury 10-year constant maturity yield 1962-2009, Global Financial Data 1800-1962. 5-year rolling average
64. Historical Interest Rates Average Yield 1800-2010 Long Depression Great Depression Source: United States Treasury 10-year constant maturity yield 1962-2009, Global Financial Data 1800-1962. 5-year rolling average
66. Headwind of Rising Rates Total Return 2.2% Average Coupon 5.6% Source: United States Treasury 10-year constant maturity yield 1962-2009, Global Financial Data 1800-1962. 5-year rolling average
67. Total Return Shortfall with Withdrawals Source: United States Treasury 10-year constant maturity yield 1962-2009, Global Financial Data 1800-1962. CRSP 10-year Treasury Index total return
68. “People have unrealistic expectations of what a portfolio manager can do in a rising-rate environment.” Jim Jessee, president of MFS Fund Distributors Inc. Investment News mutual fund round table in New York on Feb. 9, 2010
71. Based on the Treasury yield curve and standard mortality tables, annuitants can expect to only receive 81%-85% of their premium in return. Annuities for an Ageing World, Olivia S. Mitchell and David McCarthy, June 9, 2002
72. Challenges for Annuities Passing assets on to heirs Managing inflation Flexibility Expenses, commissions, and fees Counterparty risk
75. Dividend payments from companies in the S&P 500 dropped by…January 2008 to January 2009 23.9% Standard and Poors S&P 500 Market Attributes Snapshot January 2009
77. 70% of REITs followed by Morningstar cut or suspended their dividends in 2009 Morningstar Industry Report 2010
78. Key Points Individual bonds can immunize against interest rate risk Individual bonds are uniquely suited to delivering predictable income Bond funds will lose value when rates rise Annuities can be expensive and inflexible Dividends and REITs can be unreliable just when your clients need them most
80. Disclosures Past performance may not be indicative of future results. Therefore, no current or prospective client should assume that future performance of any specific investment or investment strategy (including the investments and/or investment strategies recommended or undertaken by Asset Dedication) made reference to directly or indirectly by Asset Dedication in their literature or otherwise will be profitable or equal the corresponding indicated performance level(s). Different types of investments involve varying degrees of risk, and there can be no assurance that any specific investment will either be suitable or profitable for a client or prospective client’s investment portfolio. Historical performance results for investment indices and/or categories generally do not reflect the deduction of transaction and/or custodial charges, the deduction of an investment management fee, nor the impact of taxes, the incurrence of which would have the effect of decreasing historical performance results. Please remember that different types of investments involve varying degrees of risk, and there can be no assurance that the future performance of any specific investment or investment strategy (including those undertaken or recommended by Asset Dedication), will be profitable or equal any historical performance level(s).
Editor's Notes
BBSpeaking the same language tradeoffs in both. Slightly different approach but you can see the paralells
BBA lot of you are wondering about how the dedicated portfolio approach would have worked over time. In addition to intuitive for clients, it works. Let us show you some of the empirical research that gets us excited.