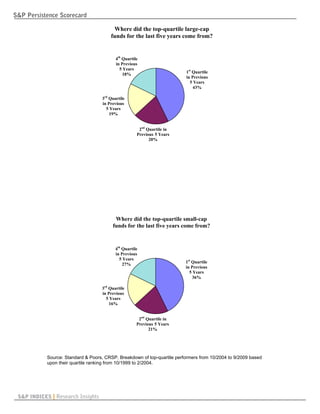
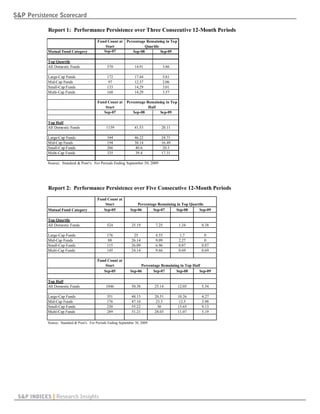
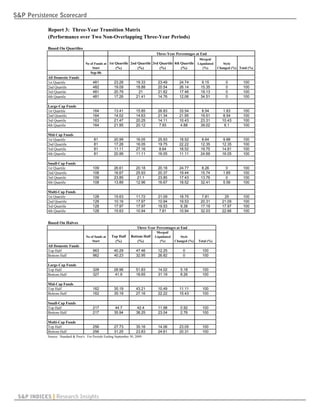
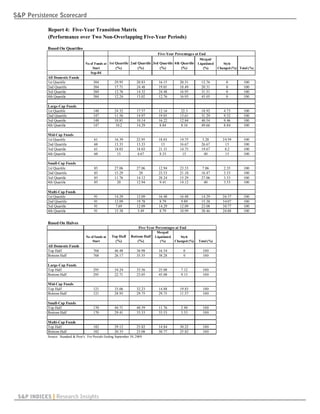
The S&P Persistence Scorecard seeks to analyze whether past mutual fund performance is indicative of future performance. It tracks the consistency of top performers over consecutive periods and measures performance persistence through transition matrices. The key findings are that very few funds consistently repeat top-half or top-quartile performance over consecutive periods. Additionally, screening for only top-quartile funds may be inappropriate as a healthy number of future top performers come from the second and third quartiles in prior periods. The bottom quartile funds have a high probability of being merged or liquidated and screening these out may be reasonable.
The document summarizes the Standard & Poor's Mutual Fund Performance Persistence Scorecard for year-end 2006. The key findings are:
1) Very few funds consistently maintain top half or top quartile performance over long periods, with only 13.2% of large-cap funds repeating top half performance over 5 years.
2) Looking at longer timeframes, only 17.3% of large cap funds in the top quartile from 2001 remained there in 2006.
3) Bottom quartile funds have over a 40% chance of disappearing due to mergers or liquidations, compared to under 10% for top funds.
This document summarizes a study examining 125 equity mutual funds that closed to new investment between 1993 and 2004. The study tests three hypotheses about why funds close: 1) The "good steward" hypothesis argues funds close to restrict inflows and maintain performance, and will perform well after reopening. 2) The "cheap talk" hypothesis posits closing has no real cost if fees increase and existing investors contribute, compensating managers. 3) The "family spillover" hypothesis claims closing diverts attention to other funds in the same family. The study finds little support for good steward performance, but evidence managers raise fees consistent with cheap talk, and little family benefit except briefly around closure.
Insight Summit 2017: Intelligent Risk Taking - Active vs passive investing
Money management in equilibrium - Jonathan Berk, A.P. Giannini Professor of Finance, Graduate School of Business, Stanford University
Presented at the third annual Insight Summit conference held on 7 November 2017 by London Business School’s AQR Asset Management Institute.
The Truth about Top-Performing Money Managers - Dec. 2011RobertWBaird
Virtually all top-performing money managers experience periods where they underperform their benchmarks and peers, especially over periods of 3 years or less. The study found that 85% of top managers underperformed by at least 1% over a 3-year period at some point, and 81% fell below their peer median as well. However, sticking with top managers pays off long-term - investors who abandon managers after short-term underperformance miss out on future gains, as many managers recover to outperform again. The study shows investors would have earned higher returns by staying invested after periods when managers fell from high ratings, rather than abandoning them.
Parametric provides strategies for exploiting increased market volatility, including rebalancing portfolios and using options strategies. Rebalancing reduces concentration risks and volatility over time by selling assets that have increased in value and buying those that have decreased, capturing returns from volatility. Options strategies can also provide downside protection for portfolios while retaining upside potential. Parametric implemented an options overlay for a client in 2008 that protected against a 5-20% market decline while retaining upside to 30%, balancing protection and participation in gains.
The article discusses risk parity strategies and evaluates their performance relative to a traditional 60% equity/40% bond portfolio. It finds that while risk parity funds have generally achieved attractive returns compared to the 60/40 portfolio over the past 5 years, their performance has varied. Some key points:
- Risk parity funds use leverage and derivatives to equalize risk across asset classes in order to improve risk-adjusted returns compared to traditional portfolios.
- An analysis of 12 major risk parity managers found that most outperformed the 60/40 portfolio in 2008 and 2009, though returns varied significantly between funds.
- More recently, some risk parity funds have experienced negative returns as rising interest rates became a headwind for their fixed income
In All About Factors, we cover the basics of what factors are, where we expect them to derive their excess returns from, their advantages and disadvantages and if there is indeed any merit to this approach or if it just another Wall Street marketing gimmick.
After covering the commonly accepted factors basics, we discuss expectations for factor investing, the theory as to why short-term pain must be present for long-term return, and some key considerations in moving from the academic research to creating investible portfolios.
Also explored is the current on-going debate between industry titans Rob Arnott (Research Affiliates) and Cliff Asness (AQR) as to the efficacy of using valuation-based spreads to time factor exposures.
Lastly, we look at some different methods that a retail investor can utilize smart-beta investing, by highlighting some of the current industry techniques for diversifying factor exposures and building a multi-factor portfolio.
optimisation of portfolio risk and returnGARGI RAI
The document is a research report submitted by Gargi Rai to Dr. A.P.J. Abdul Kalam Technical University. It discusses portfolio construction and evaluation over three years for three portfolios consisting of public sector companies, private companies, and foreign collaborations. It presents the companies in each portfolio, calculates the holding period returns for each stock in each portfolio over the three years, and evaluates portfolio performance using Sharpe's and Treynor's measures under total and market risk.
2012 what drives value tilt portfolios overperformanceFrederic Jamet
- Value tilt portfolios that invest in stocks with low valuations like price-to-book ratios have historically outperformed the overall market. There are various methods to construct value tilt indexes and ETFs.
- There are rational explanations for the outperformance like receiving higher returns for bearing additional market risk, as well as behavioral explanations involving investor overreaction. However, some argue the outperformance could be coincidental and may not continue in the future.
- The document discusses several well-known value indexes from providers like MSCI, FTSE, and Russell, and analyzes the characteristics of a hypothetical value tilt portfolio that outperformed with similar risk to the overall market.
2015 why low beta (and not low volatility) outperformsFrederic Jamet
This document discusses why low beta strategies outperform compared to low volatility strategies. It provides 7 theoretical arguments for why low beta stocks are underpriced, including behavioral biases that push investors towards high beta stocks and rational constraints that limit arbitrage of the low beta anomaly. Empirically, it shows that both low beta and low volatility strategies have outperformed the market, but the outperformance is better explained by the low beta feature rather than just low volatility. Low beta strategies tend to have lower skewness, which makes them less risky and more attractively priced by rational investors.
1) The growth of passive investing has significantly impacted the fixed income landscape. Passive investors now account for nearly 30% of taxable bond investments, up from under 20% three years ago. This has increased demand for Treasury bonds, which make up a larger portion of major bond indexes than in actively managed funds.
2) As the Federal Reserve eventually stops reinvesting maturing bonds, passive investors will automatically allocate to the growing supply of Treasuries entering the market. This will provide an unexpected source of demand as the Fed withdraws support, allowing for a more orderly reduction of its balance sheet.
3) Index construction rules and flexibility could result in new types of Treasury bonds being added that passive investors may need to
Book presentation: Excess Returns: a comparative study of the methods of the ...Frederik Vanhaverbeke
This is a pdf presentation of the book Excess Returns: a comparative study of the methods of the world's greatest investors. The presentation explains the various topics that are discussed in the book and show plenty of practical examples to understand the main points. It challenges the Efficient Market Hypothesis by showing some extraordinary track records in the investment world. It explains where top investors look for bargains. It shows how they perform a due diligence and how they value stocks. A separate section is devoted to the way top investors buy and sell various types of stocks, and how they buy and sell over stock market cycles. It also explains the various psychological aspects that top investors deem essential to beat the market.
CHW Vol 15 Isu 7 July Quarterly EHP Funds v1J Scott Miller
This document provides a summary of topics covered in the July 2015 issue of a quarterly review publication on hedge funds and alternative investing. It discusses an AIMA Canada seminar series to help new hedge fund managers, performance numbers for the recent quarter, and an article on using a trend-based approach to manage risk. The article describes how following a simple strategy of holding stocks only when they are above their 10-month moving average achieved equity-like returns with lower drawdowns and volatility than a buy-and-hold approach. It also introduces the author's own "EHP Fear Index" for determining their funds' risk levels.
This document discusses the benefits of a multi-manager investing approach over relying on a single manager. It argues that combining complementary managers with differing styles can provide market-beating returns while reducing risk, analogous to how a team with different player types is more likely to succeed than relying on a single star player. The document also stresses the importance of ongoing monitoring to ensure the right managers are being utilized depending on changing market conditions.
The document discusses the limitations of using "Up Market Capture" and "Down Market Capture" ratios to predict the future performance of investment managers. It finds:
1) There is little persistence or consistency in a manager's UMC/DMC ratios over time, indicating they are not predictive of future performance.
2) The predictive power of UMC/DMC ratios for subsequent periods is mixed - sometimes they correlate with performance and sometimes they do not.
3) Categorizing markets as simply "up" or "down" oversimplifies the many factors that drive market performance, limiting the usefulness of UMC/DMC ratios.
The document concludes UMC/DMC ratios are essentially
Global Value Equity Portfolio (March 2011)Trading Floor
This month we have adjusted our Global Value Equity Portfolio to include the reinvestment of gross dividends and introduced dynamic weights for the constituents. This reduces transaction costs, enhances excess return and makes the portfolio easier to replicate for investors.
The document provides an overview of the DSP Flexi Cap Fund, a flexi cap mutual fund scheme that invests across large, mid, and small cap stocks. The fund follows a core-satellite approach, with 75-80% allocated to a core portfolio of high-quality businesses based on long-term themes and 20-25% to tactical opportunities. The investment team uses a framework focusing on business strength, management quality, and growth prospects to identify companies. The fund has outperformed its benchmark over multiple periods under the management of Atul Bhole since 2016, demonstrating a better risk-adjusted return profile.
Tom Naughton's Prusik Asian Equity Income fund has performed strongly over the past year, returning 18% compared to the sector average of 14%. The fund focuses on high-conviction, small-cap stocks in Asia and has a current yield of 4.8%. Naughton cites good stock picking across markets as the main driver of recent performance. However, he acknowledges mistakes including an underweight position in outperforming Australia and overweights in underperforming Hong Kong and China. He remains cautious on India given high valuations and sees a potential Chinese banking crisis as one of the largest risks to the portfolio.
This document discusses smart beta investing strategies. It begins with defining smart beta as rule-based investment strategies aimed at achieving superior risk-adjusted returns. Examples of strategies discussed include fundamental indexing and minimum volatility. The document then covers reasons for and against investing in smart beta, distinguishing smart beta from active management. It outlines how smart beta, indexing and active strategies can provide different sources of return. The presentation concludes by discussing considerations for selecting smart beta strategies and allocating among smart beta, indexing and active management.
This document summarizes research analyzing the "smart money effect" and potential time lags using mutual fund data from 2007-2010 and 2012-2015. It describes literature on investors directing funds to skilled managers, and whether this is due to fund-specific information or momentum effects. The research forms portfolios based on funds' monthly net cash flows under two models (with and without a 1-month lag) and evaluates performance via 3-factor and 4-factor regressions. Results show mixed evidence of the smart money effect across periods, and momentum helps explain returns. The 1-month lag model generally performs better.
This document introduces a new measure called Active Share to quantify active portfolio management. Active Share describes the percentage of portfolio holdings that differ from the portfolio's benchmark index. It argues that Active Share, combined with tracking error, provides a comprehensive picture of a fund's active management approach. The authors apply this two-dimensional framework to analyze mutual funds, finding that the most active stock pickers outperform, while closet indexers and funds focusing on factor bets underperform after fees.
This document discusses efficient portfolio construction. It begins by outlining the objectives of constructing a diversified portfolio to maximize returns while minimizing risks. It then describes the 8 steps to calculate portfolio weights using different methods, including maximizing returns for a given risk and minimizing risk for a given return with and without allowing short selling. The document provides background on portfolio management and selection criteria for sectors and shares to include in the efficient portfolio. The goal is to select stocks that optimize the portfolio's excess return per unit of risk.
Absolute and Relative VaR of a mutual fund.Lello Pacella
Calculated Absolute and Relative VaR using Varcov Approatch, Parametric with EWMA-estimated volatility, Historical Simulation and Filtered Historical Simulation.
The document presents an analysis of investment portfolios of commercial banks. It discusses objectives to evaluate investment structures, risk and returns, and the relationship between investment and other variables. A sample of 5 commercial banks over 5 years is analyzed. Multivariate analysis shows a positive relationship between investment, bank size and deposits, and a negative relationship with loans and advances. Standard Charter Bank has the highest average investment proportion with less variation compared to other banks.
This document summarizes a study examining the performance persistence of growth-oriented mutual funds in India from 2008 to 2011. The study uses a winner-loser contingency table methodology to analyze the weekly and annual returns of 5 mutual funds over this period. The results show little evidence of short-term persistence in weekly returns but more significant evidence of persistence in annual returns. Specifically, two funds were consistent winners annually while no funds were consistent losers. Overall, an annual evaluation period best identifies persistence in the Indian mutual fund market.
The document discusses a new approach to asset allocation that focuses on diversifying risk factors rather than asset classes. It argues that traditional approaches underestimate market dynamics and fail to hedge "fat tail" risks. The new approach takes a forward-looking, macroeconomic view and aims to diversify risks across equity, bond, currency and commodity risk factors. It also notes that one extremely bad year can erase gains from multiple good years, emphasizing the importance of hedging rare but severe loss events.
Should investors avoid active managed funds baksbfmresearch
This document summarizes a study that analyzes mutual fund performance from an investor's perspective. The study develops a Bayesian method to evaluate mutual fund manager performance using flexible prior beliefs about managerial skill. The method is applied to a sample of over 1,400 equity mutual funds. The study finds that even with extremely skeptical prior beliefs about manager skill, some allocation to actively managed funds is justified. The economic importance is quantified by estimating the portfolio share and certainty equivalent loss from excluding all active managers.
1) The document discusses emerging fixed-income managers and whether their age or assets under management is a better indicator of performance.
2) It analyzes monthly return data for 317 fixed-income firms from 1985-present to determine if younger or smaller firms outperform their larger counterparts.
3) The research aims to address gaps in prior studies that focused only on equities and hedge funds, and used assets under management rather than age to define emerging managers.
Transaction cost expenditures and the relative performance of mutual funds(13)bfmresearch
This document analyzes trading costs for a sample of 132 equity mutual funds between 1984 and 1991. It finds that trading costs, including spread costs and brokerage commissions, average 0.78% of fund assets per year and vary substantially across funds. Higher trading costs are negatively associated with fund returns, even after controlling for expense ratios. Turnover explains some but not all of the variation in trading costs. Fund investment objectives are related to average trading costs but variation within objectives is greater than across objectives.
1) The study investigates how fund size affects performance in the active money management industry. Specifically, it analyzes whether fund returns decline as fund size increases.
2) The results show that both gross and net fund returns decline as lagged fund size increases, even after accounting for various performance benchmarks and fund characteristics. This suggests that larger fund size erodes performance.
3) However, controlling for its own size, a fund's performance does not deteriorate as the size of the family it belongs to increases. This indicates that scale itself does not necessarily harm performance, depending on how the fund is organized.
Morningstar fund investor_fees_predictorbfmresearch
The document summarizes research on how expense ratios and Morningstar star ratings can predict the future success of mutual funds. Some key findings:
- Funds in the lowest expense ratio quintile significantly outperformed those in the highest quintile in terms of total returns and survival rates across all asset classes except international stocks.
- Funds with the highest Morningstar ratings (5 stars) generally had higher total returns and survival rates than 1-star funds, though expense ratios were a slightly better predictor of success.
- The star rating beat expense ratios as a predictor in less than half of asset class comparisons between 2005-2010, taking into account funds that failed or were liquidated.
Examination of hedged mutual funds agarwalbfmresearch
Hedge funds have traditionally only been available to accredited investors while providing lighter regulation and stronger performance incentives compared to mutual funds. Recently, some mutual funds have adopted hedge fund-like strategies but remain subject to tighter regulation. This study examines the performance of these "hedged mutual funds" relative to both hedge funds and traditional mutual funds. It finds that despite using similar strategies as hedge funds, hedged mutual funds underperform due to their tighter regulation and weaker incentives. However, hedged mutual funds outperform traditional mutual funds, with the superior performance driven by those with managers having hedge fund experience.
The document discusses strategies for creating an investment portfolio based on Nobel Prize-winning academic research. It recommends structuring portfolios to take advantage of factors like company size, relative price, and profitability that have been shown to increase returns. Specifically, it suggests investing more in small and value stocks, as both have higher returns than large or growth stocks over the long run. The document also provides examples of model portfolios that diversify across global stock and bond index funds targeting these factors.
Standard & poor's 16768282 fund-factors-2009 jan1bfmresearch
This document summarizes a study by Standard & Poor's on factors that predict investment fund performance. The study analyzed both qualitative factors like fund size, expenses, and age as well as quantitative metrics like Jensen's alpha and information ratio. The key findings were:
- For developed markets, larger funds with lower expenses tended to outperform. But for emerging markets, smaller funds did better due to differences in liquidity.
- Jensen's alpha and information ratio best predicted future performance of developed market equity funds over shorter time periods.
- Past performance was informative over 2 years but less so over 1 year due to noise. Fund selection should focus on factors predicting shorter term outperformance.
Do emerging managers add value ( Dec 2008 )Peter Urbani
Emerging hedge fund managers, defined as those with less than 36 months of experience and less than $300 million in assets under management, tend to outperform more established managers and generate excess returns of up to 400 basis points annually. Investing in emerging managers funds can capture this excess alpha. Emerging managers have better risk and return characteristics than established managers, with compound average excess returns of 1.24% annually over 18 years.
FINANCIAL PERFORMANCE ANALYSIS OF BHARTI AIRTEL LIMITEDyashmin khatun
This document discusses financial statement analysis and ratio analysis. It provides background on analyzing a company's financial stability, profitability, and performance over time using various ratios and comparisons. The objectives are to analyze the financial position, liquidity, and profitability of Bharti Airtel over a five year period and identify its financial strengths and weaknesses. Limitations include a lack of structured data from the company and a limited three year study period relying on secondary data. A literature review found previous research analyzing the relationship between working capital management, cash conversion cycles, and company profitability.
The document discusses studies that have shown a high percentage of active fund managers underperforming benchmarks over periods of 1, 3, 5, and 10 years. However, it notes that simply looking at these statistics in isolation can be misleading, as funds have different time frames and start periods for outperforming benchmarks. Considering the effects of probability, it may not be reasonable to expect a high percentage of funds to outperform at any given time period. The document encourages further exploration of alternatives to passive funds rather than automatically ignoring active managers.
This document provides an extensive literature review of studies examining performance persistence in mutual funds. The review summarizes findings from early studies in the 1960s-1980s that used long time periods of 10-15 years and generally found some evidence of performance persistence, especially for inferior performers. However, later studies using shorter time periods found more inconsistent results and that persistence was strongly dependent on the sample and methodology used. The review concludes that while short-term persistence is sometimes found, past performance is not a reliable predictor of future returns due to biases in conventional testing procedures. Results are often sensitive to the specific measures and time periods examined, especially for equity funds.
Executives View Ideal Shareholder Base as Key to Increased Market Value
Companies that want to maximize their market value would do well to pay attention to shareholder composition.
This study found that nearly all companies describe their ideal shareholder as having a long-term investment horizon, but that about half of companies’ shareholder base has a short- or medium-term horizon. As a result, the authors find, most companies see significant upside to managing their shareholder base, and senior leaders spend considerable time meeting with current and prospective investors.
“More than three-quarters of companies in our survey see significant stock market benefits from managing their shareholder base,” says Anne Beyer, associate professor of accounting at Stanford Graduate School of Business (GSB) and coauthor of the study. “Companies believe that if they can identify and attract the right shareholder base, they will be able to increase the price of their stock and decrease its volatility.”
In fact, this survey of 138 investor relations professionals at North American companies shows that 80% of companies believe their stock price would trade higher over a two- to three-year period if they could attract their ideal shareholder base. On average, companies estimate their stock would rise 15% and share price volatility would decrease 20%.
Read the full report!
The document discusses value investing strategies in the U.S. and China stock markets. It analyzes data showing that allocating 15% of a portfolio to hedge funds can increase returns by 0.3-0.5% while reducing risk. However, the wide variation in hedge fund performance shows the importance of manager selection. Seasonal patterns are identified, with better performance periods in the U.S. from June-April and in China from September-March. The document recommends a long/short strategy taking long positions in the outperforming market and short positions in the other to reduce correlation and obtain profits.
Credit availability in Canada 2014: Targeting an ideal capital structurelbobak
The majority of Canadian financial executives surveyed by the Canadian Financial Executives Research Foundation are more optimistic about their company’s ability to obtain sufficient capital to meet its financing requirements in the next year (whether these needs are short-term, long-term or equity based). Most financial executives surveyed said credit for working capital and growth financing is generally available to their organizations, according to the study, which was published by the research arm of Financial Executives International Canada (FEI Canada), and sponsored by EY. The report, entitled Targeting an ideal capital structure, is based on the results of an online survey of financial executives across Canada, which took place in June 2014. According to the study, even those for whom credit was less available this year, the expectation is availability will improve by the spring of 2015.
A Study on the Performance of Mutual Fund Scheme in IndiaIJAEMSJORNAL
A mutual fund is a trust that encompasses the savings of a number of investors who share a common financial goal. The money thus collected is then invested in capital market instruments such as shares, debentures and other securities. The income earned through these investments and the capital appreciation realized is shared by its unit holders in proportion to the number of units owned by them. Thus, Mutual Fund is one of the most effective instruments for the small & medium investors for investment and offers opportunity to them to participate in capital market with low level of risk. It also provides the facility of diversification i.e. investors can invest across different types of schemes. Indian Mutual Fund has achieved a lot of popularity since last two decades. For a long time UTI enjoyed the monopoly in mutual fund industry. But with the passage of time many new players came in the market and thus the mutual fund industry faces a lot of competition. Now a day this industry has become the major player of the financial system. Therefore it becomes important to investigate the mutual fund performance at continuous basis. The wide variety of schemes floated by these mutual fund companies gave wide investment choice for the investors. Among wide variety of funds equity, diversified fund is considered as substitute for direct stock market investment. In present paper an attempt has been made to investigate the performance of the open ended, growth oriented, equity diversified schemes on the basis of return and risk evaluation. The analysis was achieved by assessing various financial tests like Average Return, Standard Deviation, Beta, Coefficient of Determination (R2), Alpha, Sharpe Ratio and Treynor Ratio whose results will be useful for investors for taking better investment decisions. The data has been taken from various websites of mutual fund schemes and from amfiindia.com. The analysis depicts that majority of funds selected for study have outperformed under Sharpe Ratio as well as Treynor Ratio.
This document analyzes the performance of 10 selected mutual fund schemes in India from 2015-2019 using various measures. It aims to evaluate the risk and return relationship of the funds. Performance is assessed using the Sharpe ratio, Treynor ratio, and Jensen's alpha. The Sharpe ratio measures risk-adjusted return, the Treynor ratio is the reward-to-volatility ratio, and Jensen's alpha measures absolute performance against a benchmark. Daily net asset values for the funds and market index closing values are used to calculate these measures. The study finds that most funds failed to outperform the market index based on the ratios analyzed.
This document provides an overview of the DSP Top 100 Equity Fund large cap fund. It discusses the fund manager's core beliefs of valuing stocks intrinsically and recognizing uncertainty. It highlights why equity provides higher returns than inflation over the long run. The fund focuses on large caps for their lower volatility and sector leaders. Though most active funds underperform, this fund maintains a high active share and concentrated portfolio. The portfolio has conservative valuations and uses factor models for screening.
DSP Top 100 Equity Fund is a large cap equity fund that predominantly invests in the top 100 stocks by market capitalization. The fund managers believe that valuations matter, nobody knows the future for certain, and structure beats activity. Equity is preferred due to its ability to outperform inflation over the long run. Large caps offer lower volatility compared to small and mid caps. While most active funds have underperformed, this fund aims to beat its benchmark by taking a high active share, concentrated approach. The portfolio is valued conservatively relative to historical averages and positions are informed by a factor model. Performance is evaluated over long periods rather than short term deviations from the benchmark.
The Intrieri Family Student Managed Fund reported an annual return of 7.24% for 2014, underperforming the S&P 500's return of 13.46%. While disappointing, this is consistent with most actively managed funds underperforming their benchmarks last year. The fund returned 4.82% in the 4th quarter, slightly underperforming the S&P 500's 4.90% return due to a higher than normal cash position. Moving forward, the fund will work to diversify away from the S&P 500 benchmark by adding small-cap and international holdings, as originally mandated.
Growing and sustaining wealth amid economic uncertainty is difficult. Market fluctuations are completely out of our control. In this session, we’ll help you take back control. We’ll focus on simple investment and personal tax management strategies that could make all the difference in achieving your financial freedom.
The study was undertaken to investigate the possibility of momentum and contrarian strategies to outperform and generate a superior return to the investor i.e. returns over and above the benchmark index. Analysis of the data collected over four years (2016-2019) for quarterly, half-yearly and yearly holding periods resulted in rejecting the possibility of the momentum and contrarian strategies to outperform index consistently, even though they provide huge returns sometimes, in the Indian stock market for the period under study
Mutual fund performance and manager style by james l. davis(11)bfmresearch
This document provides a 3-sentence summary of the given document:
The document analyzes whether certain investment styles reliably produce abnormal returns for mutual funds and whether fund performance is persistent based on style. It finds that none of the styles studied generated positive abnormal returns compared to benchmarks, with value funds showing negative abnormal returns. There is some evidence that top performing growth managers and worst performing small-cap managers show persistence for a year, but abnormal performance tends to disappear quickly. The results cast doubt on the economic value of active fund management.
Valuation Insights: Second Quarter 2017Duff & Phelps
This document summarizes key topics from Duff & Phelps' Valuation Insights newsletter, including:
1) A study of over 3,000 fairness opinions filed with the SEC which found that fairness opinions generally provide a useful valuation range for boards, with narrower ranges for larger deals.
2) An article discussing the evolving standards and best practices for valuing fund interests, noting increased focus on transparency and robust valuation processes.
3) A report on global financial regulation which surveyed professionals on the impact and priorities of regulation as well as compliance budgets.
4) Duff & Phelps' acquisition of a leading Asian transfer pricing advisory firm.
Sustainable Reality: Understanding the Performance of Sustainable Investment ...Sustainable Brands
This document discusses a study on the performance of sustainable investment strategies compared to traditional investments. Some key findings:
- Sustainable equity mutual funds and SMAs had equal or higher median returns than traditional funds/SMAs for 64% of periods examined over 7 years. They also had equal or lower volatility for 64-72% of periods.
- One index of firms with high ESG ratings outperformed the S&P 500 by 45 basis points annually since 1990.
- Studies show corporate sustainability practices are linked to lower costs of capital, higher stock price performance, and improved operational performance. Firms scoring highly on ESG criteria tend to outperform over the long run.
- Manager selection is
Sustainable Reality: Understanding the Performance of Sustainable Investment ...Sustainable Brands
This document discusses a study on the performance of sustainable investment strategies. The key findings are:
- Sustainable equity funds and separately managed accounts had equal or higher returns and equal or lower risk than traditional peers for the majority of periods examined over the last 7 years.
- Research shows corporate investment in sustainability is positively related to stock price and operational performance.
- An index comprising firms with high environmental, social and governance scores outperformed the S&P 500 by 45 basis points annually since 1990.
- Manager selection is important for both sustainable and traditional investments, as there is high dispersion of returns across strategies.
Similar to Do pastmutualfindw innersrepeat_snp (20)
Performance emergingfixedincomemanagers joi_is age just a numberbfmresearch
1) Younger fixed-income managers tend to outperform older, more established managers in terms of gross returns. Returns are significantly higher for emerging managers in their first year and first five years compared to later years.
2) The study examines 54 fixed-income managers formed since 1985 that had majority employee ownership. Most were formed before 2000, when barriers to entry increased.
3) Business risk is low for emerging managers, as only 6.8% of the 88 examined managers are no longer in business. Higher first-year and early-period returns for emerging managers indicate they provide alpha during their hungry startup phase.
This document analyzes different categories of active mutual fund management based on measures of Active Share and tracking error. It finds that the most active stock pickers have outperformed their benchmarks after fees, while closet indexers and funds focusing on factor bets have underperformed after fees. Performance patterns were similar during the 2008-2009 financial crisis. Closet indexing has become more popular recently. Fund performance can be predicted by cross-sectional stock return dispersion, favoring active stock pickers when dispersion is higher.
The document summarizes findings from the Standard & Poor's Indices Versus Active Funds (SPIVA) Scorecard, which compares the performance of actively managed mutual funds to relevant benchmarks. Some key points:
- Over the past 3 years, the majority (over 50%) of actively managed large-cap, mid-cap, small-cap, global, international, and emerging market funds underperformed their benchmarks.
- Over the past 5 years, indices outperformed a majority of active managers in nearly all major domestic and international equity categories based on equal-weighted returns. Asset-weighted averages also showed underperformance in 11 out of 18 domestic categories.
- For fixed income funds, over 50% under
This document summarizes research on the relationship between portfolio turnover and investment performance. Recent studies have found no evidence that higher portfolio turnover leads to lower returns, as was previously thought. Trading costs have declined over time, and portfolio turnover is not a good proxy for actual trading costs, which depend more on trade size and type of security traded. A 2007 study directly estimated trading costs and found no clear correlation between costs and returns. The author's own analysis of mutual funds from 2007-2008 also found little relationship between turnover and performance. Therefore, advisors should not assume higher turnover means lower returns.
This document discusses using active share and tracking error as measures of portfolio manager skill. It defines active share as the percentage of a fund's portfolio that differs from its benchmark index. Tracking error measures systematic factor risk by capturing how much a fund's returns vary from its benchmark. Research shows funds with high active share and moderate tracking error tend to outperform on average. The document examines how active share and tracking error can help identify skillful managers by focusing on their portfolio construction process rather than just past returns.
This document is a guide to the markets published by JPMorgan that provides data and analysis across various asset classes including equities, fixed income, international markets, and the economy. It includes sections on returns by investment style and sector for equities, economic indicators and drivers, interest rates and other data for fixed income, international market returns and valuations, and asset class performance and correlations. The guide contains over 60 charts and analyses global and domestic financial trends and investment opportunities.
The document discusses whether the concept of "Alpha" is a useful performance metric for investors. It makes two main arguments:
1) Alpha alone does not determine if a portfolio has superior risk-adjusted returns, as portfolio volatility and correlation to benchmarks also influence risk-adjusted returns.
2) Alpha is dependent on leverage - a higher reported Alpha could simply be due to using leverage rather than superior investment skill.
The document concludes that Alpha is a misleading performance measure and not suitable as the sole metric, especially for investors concerned with total risk and returns rather than just a single return component.
Fis group study on emerging managers performance drivers 2007bfmresearch
This study examined the performance of emerging investment managers over three years ending in 2006. It found that:
1) For large cap managers, increased firm assets were negatively correlated with risk-adjusted returns for core and growth strategies, but not for value. This may be because increased assets led to less concentrated core portfolios, lowering returns.
2) For small cap managers, risk-adjusted returns were highest for firms with less than $500 million in assets, possibly due to added resources like analysts. Returns leveled off between $500 million and $1 billion, and declined above $1 billion.
3) Having more research analysts was consistently positively correlated with higher risk-adjusted returns across strategies, while the impact
The document discusses Barclays' process for evaluating and selecting investment managers. It states that identifying the right asset allocation and implementing it properly are both important for achieving investment goals. The process involves both science, through a formal and structured methodology, and art, by applying judgment and philosophy. Barclays aims to identify managers most likely to perform well through rigorous due diligence and ongoing monitoring. The paper will explain Barclays' comprehensive approach to manager analysis, selection, and review.
Active managementmostlyefficientmarkets fajbfmresearch
This survey of literature on active vs passive management shows:
1) On average, actively managed funds do not outperform the market after accounting for fees and expenses, though a minority do add value.
2) Studies suggest some investors may be able to identify superior active managers in advance using public information.
3) Investors who identify superior active managers could improve their risk-adjusted returns by including some exposure to active strategies.
This document summarizes recent academic research on active equity managers who deliver persistent outperformance. It discusses studies finding that:
1) While the average equity manager underperforms after fees, a minority of managers have demonstrated persistent outperformance that cannot be attributed to chance alone.
2) Managers with higher "active share" (the degree to which their portfolio composition differs from the benchmark) tend to generate greater risk-adjusted returns.
3) Managers with lower portfolio turnover and a focus on strong stock selection, rather than market timing, are more likely to outperform over time.
The document evaluates how Brown Advisory's investment approach aligns with the characteristics identified in these studies as being associated with persistent
The document discusses China's transition to a consumer-driven economy. It provides analysis from CLSA China Macro Strategist Andy Rothman on trends in China's economy including the declining importance of exports, strong growth in domestic consumption, increasing incomes driving spending, and continued growth in infrastructure investment. The analysis suggests China's economy remains healthy and growing despite slowing external demand.
This report provides an analysis of defined contribution retirement plans based on 2010 Vanguard recordkeeping data. Some key findings include:
- Median and average account balances reached their highest levels since tracking began in 1999, recovering from market declines.
- Use of target-date funds as investment options and default investments continues to grow significantly, with 42% of participants using them and 20% wholly invested in a single target-date fund.
- Professionally managed investment options like target-date funds are being used by an increasing number of participants, with 29% solely invested in an automatic investment program in 2010 compared to just 9% in 2005.
The document discusses the benefits of exercise for mental health. Regular physical activity can help reduce anxiety and depression and improve mood and cognitive function. Exercise causes chemical changes in the brain that may help protect against mental illness and improve symptoms.
This study explores performance persistence in mutual funds. The authors find:
1) Funds that perform relatively poorly compared to peers and benchmarks are more likely to disappear, indicating survivorship bias can be relevant in mutual fund studies.
2) Mutual fund performance persists from year to year on a risk-adjusted basis, though much of the persistence is due to repeated underperformance relative to benchmarks.
3) Persistence patterns vary dramatically between time periods, suggesting performance is correlated across managers due to common strategies not captured by risk adjustments. Poorly performing funds also persist instead of being fully eliminated by the market.
This study examines persistence in mutual fund performance over 1962-1993 using a survivorship-bias-free database. The author finds:
1) Common factors in stock returns and differences in mutual fund expenses explain almost all persistence in mutual fund returns, with the exception of strong underperformance by the worst-performing funds.
2) The "hot hands effect" documented in prior literature is driven by the one-year momentum effect in stock returns, but individual funds do not earn higher returns from actively following momentum strategies after accounting for costs.
3) Expenses have a negative impact on performance of at least one-for-one, and higher turnover also negatively impacts performance, reducing returns by around 0.95
This paper examines the relationship between mutual fund manager ownership stakes in the funds they manage and the performance of those funds. The author hypothesizes that greater manager ownership will be positively associated with fund returns and negatively associated with fund turnover, as higher ownership would better align manager and shareholder interests by reducing agency costs. Using a dataset of manager ownership disclosures from 2004-2005, the author finds that funds with higher manager ownership had higher returns and lower turnover, supporting the hypotheses. However, manager ownership was not related to a fund's tax burden.
Information ratio mgrevaluation_bossertbfmresearch
This document discusses using the Information Ratio (IR) to evaluate mutual fund managers. The IR measures excess return over a benchmark relative to excess return volatility. While commonly used, the IR has limitations that depend on benchmark choice, data frequency, and fund return distributions. The document aims to empirically analyze IR characteristics across different asset classes and countries to determine if it is a reliable performance measure or if guidelines are needed for its use.
This document summarizes a study comparing the performance of mutual funds managed by individual managers versus teams of managers. The study finds that funds managed by teams have similar risk-adjusted performance to individually-managed funds, despite team-managed funds growing at a faster rate. Additionally, team-managed funds have significantly lower risk, lower cross-sectional performance differences, lower expenses, and lower portfolio factor loadings than individually-managed funds. The study uses a large sample of domestic and international mutual funds to test these findings.
This document discusses returns-based style analysis (RBSA), a technique developed by William Sharpe to determine the style of a portfolio or mutual fund using only returns data. The document provides an overview of RBSA and compares it to holdings-based style analysis. It then describes how to implement RBSA using Excel by constructing a portfolio of indices to minimize the tracking error between the returns of the portfolio being analyzed and the index portfolio returns. The document concludes by providing an example RBSA using the Dodge & Cox Balanced Fund to illustrate the technique.
Enhancing Asset Quality: Strategies for Financial Institutionsshruti1menon2
Ensuring robust asset quality is not just a mere aspect but a critical cornerstone for the stability and success of financial institutions worldwide. It serves as the bedrock upon which profitability is built and investor confidence is sustained. Therefore, in this presentation, we delve into a comprehensive exploration of strategies that can aid financial institutions in achieving and maintaining superior asset quality.
Optimizing Net Interest Margin (NIM) in the Financial Sector (With Examples).pdfshruti1menon2
NIM is calculated as the difference between interest income earned and interest expenses paid, divided by interest-earning assets.
Importance: NIM serves as a critical measure of a financial institution's profitability and operational efficiency. It reflects how effectively the institution is utilizing its interest-earning assets to generate income while managing interest costs.
Independent Study - College of Wooster Research (2023-2024) FDI, Culture, Glo...AntoniaOwensDetwiler
"Does Foreign Direct Investment Negatively Affect Preservation of Culture in the Global South? Case Studies in Thailand and Cambodia."
Do elements of globalization, such as Foreign Direct Investment (FDI), negatively affect the ability of countries in the Global South to preserve their culture? This research aims to answer this question by employing a cross-sectional comparative case study analysis utilizing methods of difference. Thailand and Cambodia are compared as they are in the same region and have a similar culture. The metric of difference between Thailand and Cambodia is their ability to preserve their culture. This ability is operationalized by their respective attitudes towards FDI; Thailand imposes stringent regulations and limitations on FDI while Cambodia does not hesitate to accept most FDI and imposes fewer limitations. The evidence from this study suggests that FDI from globally influential countries with high gross domestic products (GDPs) (e.g. China, U.S.) challenges the ability of countries with lower GDPs (e.g. Cambodia) to protect their culture. Furthermore, the ability, or lack thereof, of the receiving countries to protect their culture is amplified by the existence and implementation of restrictive FDI policies imposed by their governments.
My study abroad in Bali, Indonesia, inspired this research topic as I noticed how globalization is changing the culture of its people. I learned their language and way of life which helped me understand the beauty and importance of cultural preservation. I believe we could all benefit from learning new perspectives as they could help us ideate solutions to contemporary issues and empathize with others.
Fabular Frames and the Four Ratio ProblemMajid Iqbal
Digital, interactive art showing the struggle of a society in providing for its present population while also saving planetary resources for future generations. Spread across several frames, the art is actually the rendering of real and speculative data. The stereographic projections change shape in response to prompts and provocations. Visitors interact with the model through speculative statements about how to increase savings across communities, regions, ecosystems and environments. Their fabulations combined with random noise, i.e. factors beyond control, have a dramatic effect on the societal transition. Things get better. Things get worse. The aim is to give visitors a new grasp and feel of the ongoing struggles in democracies around the world.
Stunning art in the small multiples format brings out the spatiotemporal nature of societal transitions, against backdrop issues such as energy, housing, waste, farmland and forest. In each frame we see hopeful and frightful interplays between spending and saving. Problems emerge when one of the two parts of the existential anaglyph rapidly shrinks like Arctic ice, as factors cross thresholds. Ecological wealth and intergenerational equity areFour at stake. Not enough spending could mean economic stress, social unrest and political conflict. Not enough saving and there will be climate breakdown and ‘bankruptcy’. So where does speculative design start and the gambling and betting end? Behind each fabular frame is a four ratio problem. Each ratio reflects the level of sacrifice and self-restraint a society is willing to accept, against promises of prosperity and freedom. Some values seem to stabilise a frame while others cause collapse. Get the ratios right and we can have it all. Get them wrong and things get more desperate.
Economic Risk Factor Update: June 2024 [SlideShare]Commonwealth
May’s reports showed signs of continued economic growth, said Sam Millette, director, fixed income, in his latest Economic Risk Factor Update.
For more market updates, subscribe to The Independent Market Observer at https://blog.commonwealth.com/independent-market-observer.
5 Tips for Creating Standard Financial ReportsEasyReports
Well-crafted financial reports serve as vital tools for decision-making and transparency within an organization. By following the undermentioned tips, you can create standardized financial reports that effectively communicate your company's financial health and performance to stakeholders.
Solution Manual For Financial Accounting, 8th Canadian Edition 2024, by Libby...Donc Test
Solution Manual For Financial Accounting, 8th Canadian Edition 2024, by Libby, Hodge, Verified Chapters 1 - 13, Complete Newest Version Solution Manual For Financial Accounting, 8th Canadian Edition by Libby, Hodge, Verified Chapters 1 - 13, Complete Newest Version Solution Manual For Financial Accounting 8th Canadian Edition Pdf Chapters Download Stuvia Solution Manual For Financial Accounting 8th Canadian Edition Ebook Download Stuvia Solution Manual For Financial Accounting 8th Canadian Edition Pdf Solution Manual For Financial Accounting 8th Canadian Edition Pdf Download Stuvia Financial Accounting 8th Canadian Edition Pdf Chapters Download Stuvia Financial Accounting 8th Canadian Edition Ebook Download Stuvia Financial Accounting 8th Canadian Edition Pdf Financial Accounting 8th Canadian Edition Pdf Download Stuvia
Falcon stands out as a top-tier P2P Invoice Discounting platform in India, bridging esteemed blue-chip companies and eager investors. Our goal is to transform the investment landscape in India by establishing a comprehensive destination for borrowers and investors with diverse profiles and needs, all while minimizing risk. What sets Falcon apart is the elimination of intermediaries such as commercial banks and depository institutions, allowing investors to enjoy higher yields.
South Dakota State University degree offer diploma Transcriptynfqplhm
办理美国SDSU毕业证书制作南达科他州立大学假文凭定制Q微168899991做SDSU留信网教留服认证海牙认证改SDSU成绩单GPA做SDSU假学位证假文凭高仿毕业证GRE代考如何申请南达科他州立大学South Dakota State University degree offer diploma Transcript
1. S&P INDICES| Research Insights January 2010
Thought Leadership by Global
Research & Design
www.indexresearch.standardandpoors.com
Do Past Mutual Fund Winners Repeat?
The S&P Persistence Scorecard
The phrase “past performance is not an indicator of future outcomes” is a
common fine print line found in all mutual fund literature. Yet due to either
force of habit or conviction, both investors and advisors consider past
performance and related metrics to be important factors in fund selection.
Does past performance really matter? The semi-annual S&P Persistence
Scorecard seeks to track the consistency of top performers over three- and
five-consecutive year periods, and measure performance persistence
through transition matrices for three- and five-year non-overlapping holding
periods. As in our widely followed Standard & Poor’s Indices Versus Active
Funds (SPIVATM) Scorecards, the University of Chicago’s CRSP
Survivorship Bias Free Mutual Fund Database underlies our analysis.
Very few funds manage to consistently repeat top-half or top-quartile
performance. Over the five years ending September 2009, only 4.27%
large-cap funds, 3.98% mid-cap funds, and 9.13% small-cap funds
maintained a top-half ranking over the five consecutive 12-month periods.
No large- or mid-cap funds, and only one small-cap fund maintained a top-
quartile ranking over the same period.
Looking at longer term performance, 24.32% of large-cap funds with a top-
quartile ranking over the five years ending September 2004 maintained a
top-quartile ranking over the next five years. Only 16.39% of mid-cap funds
and 27.06% of small-cap funds maintained a top-quartile performance over
the same period. Random expectations would suggest a repeat rate of
25%.
Our research suggests that screening for top-quartile funds may be
inappropriate. A healthy plurality of future top-quartile funds comes from the
prior period’s second, third and even fourth quartiles. Screening out bottom
quartile funds may be appropriate, however, since they have a very high
probability of being merged or liquidated.
Srikant Dash, CFA, FRM
(212) 438 3012
srikant_dash@sandp.com
2. S&P Persistence Scorecard
Introduction
“Past performance is not an indicator of future outcomes” is a phrase found in the fine
print of all mutual fund related literature. However, investors and advisors alike consider
past performance and related metrics to be crucial to the fund selection process.
Does past performance really matter? To answer this question on an ongoing basis, we
are reintroducing the semi-annual S&P Persistence Scorecard. The scorecard seeks to
track the consistency of top performers over consecutive year periods, as well as
measure performance persistence through transition matrices. As in our widely followed
SPIVA reports, the University of Chicago’s CRSP Survivorship Bias Free Mutual Fund
Database serves as our underlying data source.
Listed below are the key features of the S&P Persistence Scorecard:
Historical Rankings without Survivorship bias: For anyone making an
investment decision at the beginning of a time period, all funds available at that
time are part of the initial opportunity set. However, many funds might liquidate
or merge during a period of study. Often analysts use a finite set of funds that
cover the complete historical time period, in essence, ranking the survivors. By
using the University of Chicago’s Center for Research in Security Prices (CRSP)
Survivorship Bias Free Mutual fund Database, the S&P Persistence Scorecard
ranks all funds available at each point in time, and tracks the top-quartile and
top-half performers throughout the time period.
Clean Universe: The mutual fund universe used in these reports comprises
actively managed domestic U.S. equity funds. Index funds, sector funds, and
index-based dynamic (bull/bear) funds are excluded from the sample. To avoid
double counting of multiple share classes, only the largest share class of a fund
is used.
Transition Matrices: Transition matrices show the movements between
quartiles and halves for two non-overlapping three- and five-year periods. They
also track the percentage of funds that have merged or liquidated. Additionally,
we monitor movements between capitalization levels; for example, if some
large-cap funds have become mid- or small-cap funds.
Tracking reports of top performers: The tracking reports show the
percentages of funds that remain in the top-quartile or top-half rankings for three
and five-consecutive year periods.
Standard & Poor’s Persistence Scorecard is the only comprehensive, periodic and
publicly available source of such data. The semi-annual reports can be found online at
www.spiva.standardandpoors.com .
U U
S&P INDICES | Research Insights
3. S&P Persistence Scorecard
Very Few Funds Consistently Stay in the Top-Quartile or Top-Half
Reports 1 and 2, found at the end of this paper, show very few funds managing to
consistently repeat top-half or top-quartile performance. Over the five years ending
September 2009, only 15 (4.27%) large-cap funds, 7 (3.98%) mid-cap funds, and 21
(9.13%) small-cap funds maintained a top-half ranking over five consecutive 12-month
periods. No large- or mid-cap funds, and only one small-cap fund, maintained a top-
quartile ranking over the same period. While low in absolute terms, these percentages
are best understood in a probabilistic context. If fund returns are random and
independent of prior returns, one would expect the top-half repeat rate to be 6.25% and
the top-quartile repeat rate to be 0.39%.
Looking at longer term performance, 24.32% of large-cap funds with a top-quartile
ranking over five years ending September 2004 maintained a top-quartile ranking over
the next five years. Only 16.39% of mid-cap funds and 27.06% of small-cap funds
maintained a top-quartile performance over the same period. Again, these percentages
should be put in context of random expectations. If one were to pick a fund randomly,
the chance of choosing a fund that will occupy the top-quartile during the next five years
would be 25%.
Therefore, using the past five years’ annual returns as well as cumulative five-year
historical returns to find futures winners is roughly equivalent to, and for cases like
small-cap funds, slightly superior to, rolling the dice.
Is Quartile Based Screening for Funds Appropriate?
In this scorecard, we reference random expectations because they set a benchmark for
the usefulness of screening funds based on past returns. The fact that in many cases
the repeat rates are higher than random expectations suggests that past performance
should not be dismissed as completely irrelevant. However, we believe the common
practice of screening for funds based on current top-quartile rankings may be
inappropriate for the following reasons:
The low absolute counts of repeat top performers suggest that past performance
cannot be the sole or most important criteria in fund selection.
Furthermore, the transition matrices of Report 3 and 4, found at the end of the paper,
suggest that a healthy percentage of current top-quartile funds come from prior
period second or third quartiles. This is illustrated in the charts found on the next
page. Therefore, advisors and consultants who use granular rankings such as
quartiles, or even quintiles and deciles, may be missing out on funds that should
belong to their initial selection set.
There does seem to be some logic in deeply scrutinizing or even screening out bottom-
quartile funds. Many of the bottom quartile funds are subsequently merged or liquidated.
Clearly, asset management companies do not want to have laggards in their advertised
line-ups.
S&P INDICES | Research Insights
4. S&P Persistence Scorecard
Where did the top-quartile large-cap
funds for the last five years come from?
4th Quartile
in Previous
5 Years
18% 1st Quartile
in Previous
5 Years
43%
3rd Quartile
in Previous
5 Years
19%
2nd Quartile in
Previous 5 Years
20%
Where did the top-quartile small-cap
funds for the last five years come from?
4th Quartile
in Previous
5 Years
1st Quartile
27%
in Previous
5 Years
36%
3rd Quartile
in Previous
5 Years
16%
2nd Quartile in
Previous 5 Years
21%
Source: Standard & Poors, CRSP. Breakdown of top-quartile performers from 10/2004 to 9/2009 based
upon their quartile ranking from 10/1999 to 2/2004.
S&P INDICES | Research Insights
5. S&P Persistence Scorecard
Report 1: Performance Persistence over Three Consecutive 12-Month Periods
Fund Count at Percentage Remaining in Top
Start Quartile
Mutual Fund Category Sep-07 Sep-08 Sep-09
Top Quartile
All Domestic Funds 570 14.91 3.86
Large-Cap Funds 172 17.44 5.81
Mid-Cap Funds 97 12.37 2.06
Small-Cap Funds 133 14.29 3.01
Multi-Cap Funds 168 14.29 3.57
Fund Count at Percentage Remaining in Top
Start Half
Sep-07 Sep-08 Sep-09
Top Half
All Domestic Funds 1139 41.53 20.11
Large-Cap Funds 344 46.22 24.71
Mid-Cap Funds 194 38.14 16.49
Small-Cap Funds 266 40.6 20.3
Multi-Cap Funds 335 39.4 17.31
Source: Standard & Poor's. For Periods Ending September 30, 2009
Report 2: Performance Persistence over Five Consecutive 12-Month Periods
Fund Count at
Start Percentage Remaining in Top Quartile
Mutual Fund Category Sep-05 Sep-06 Sep-07 Sep-08 Sep-09
Top Quartile
All Domestic Funds 524 25.19 7.25 1.34 0.38
Large-Cap Funds 176 25 4.55 1.7 0
Mid-Cap Funds 88 26.14 9.09 2.27 0
Small-Cap Funds 115 26.09 6.96 0.87 0.87
Multi-Cap Funds 145 24.14 9.66 0.69 0.69
Fund Count at
Start Percentage Remaining in Top Half
Sep-05 Sep-06 Sep-07 Sep-08 Sep-09
Top Half
All Domestic Funds 1046 50.38 25.14 12.05 5.54
Large-Cap Funds 351 48.15 20.51 10.26 4.27
Mid-Cap Funds 176 47.16 23.3 12.5 3.98
Small-Cap Funds 230 55.22 30 15.65 9.13
Multi-Cap Funds 289 51.21 28.03 11.07 5.19
Source: Standard & Poor's. For Periods Ending September 30, 2009
S&P INDICES | Research Insights
8. S&P Persistence Scorecard
S&P Indices Global Research & Design Contact Information
Global Head
Srikant Dash +1 212-438-3012 srikant_dash@standardandpoors.com
New York
Berlinda Liu +1 212-438-7834 berlinda_liu@standardandpoors.com
Frank Luo +1 212-438-5057 frank_luo@standardandpoors.com
Phil Murphy +1 212-438-1368 philip_murphy@standardandpoors.com
Aye Soe +1 212-438-1677 aye_soe@standardandpoors.com
London
Junhua Lu +44 207-176-8453 junhua_lu@standardandpoors.com
Gareth Parker +44 207-176-8443 gareth_parker@standardandpoors.com
Beijing
Liyu Zeng +86 10-6535-2947 liyu_zeng@standardandpoors.com
Hong Kong
Simon Karaban +852 2532-8050 simon_karaban@standardandpoors.com
S&P INDICES | Research Insights