How Automation is Driving Efficiency Through the Last Mile of Reporting
Dfa all slides 2013
1. DV1000.2
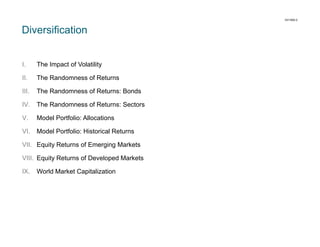
Diversification
I.
The Impact of Volatility
II.
The Randomness of Returns
III.
The Randomness of Returns: Bonds
IV.
The Randomness of Returns: Sectors
V.
Model Portfolio: Allocations
VI.
Model Portfolio: Historical Returns
VII. Equity Returns of Emerging Markets
VIII. Equity Returns of Developed Markets
IX.
World Market Capitalization
2. DV1010.2
The Impact of Volatility
Impact on a Hypothetical $100,000 Portfolio
Year 1
Return
Year 2
Return
Average
Return
Compound
Return
Value at End
of Year 2
Portfolio #1
50%
-50%
0%
-13.4%
$75,000
Portfolio #2
10%
-10%
0%
-0.5%
$99,000
For illustrative purposes only.
2
4. DV1030.9
Model Portfolio: Allocations
Model
Portfolio 1
Model
Portfolio 4
Model
Portfolio 5
60%
60%
60%
60%
60%
US STOCKS
Model
Portfolio 3
60%
EQUITY
Model
Portfolio 2
60%
60%
60%
30%
60.0%
60.0%
30.0%
15.0%
7.5%
US Large Cap
S&P 500 Index
US Large Cap Value
Fama/French US Large Cap Value Research Index
—
—
—
15.0%
7.5%
US Small Cap
Fama/French US Small Cap Index
—
—
30.0%
15.0%
7.5%
US Small Cap Value
Fama/French US Small Cap Value Research Index
—
—
—
15.0%
7.5%
0%
0%
0%
0%
30%
NON-US STOCKS
International Large Cap Value
Fama/French International Value Index
—
—
—
—
15.0%
International Small Cap
International Small Cap Index
—
—
—
—
15.0%
40%
40%
40%
40%
40%
—
40.0%
40.0%
40.0%
40.0%
40.0%
—
—
—
—
FIXED INCOME
One-Year US Fixed
BofA Merrill Lynch One-Year US Treasury Note Index
US Fixed (all maturities)
Barclays Capital US Government/Credit Bond Index
International Small Cap Index data compiled by Dimensional.
The returns and other characteristics of the allocation mixes contained in this presentation are based on model/back-tested simulations to demonstrate broad economic principles. They were achieved with the benefit of hindsight
and do not represent actual investment performance. There are limitations inherent in model performance; it does not reflect trading in actual accounts and may not reflect the impact that economic and market factors may have had
on an advisor’s decision making if the advisor were managing actual client money. Model performance is hypothetical and is for illustrative purposes only. Model performance shown includes reinvestment of dividends and other
earnings but does not reflect the deduction of investment advisory fees or other expenses. Clients’ investment returns would be reduced by the advisory fees and other expenses they would incur in the management of their
accounts. For illustrative purposes only. The balanced strategies are not recommendations for an actual allocation. Indexes are not available for direct investment.
Index performance does not reflect the expenses associated with the management of an actual portfolio. Past performance is not a guarantee of future results.
Not to be construed as investment advice.
4
5. DV1030.9
Model Portfolio: Historical Returns
Annual Return (%)
1998
2001
2002
2003
2004
2005
2006
21.63
16.76
5.82
8.12
-6.61
31.75
14.80
8.93
15.27
3.19
5.81
-9.18
26.31
11.04
11.69
14.32
-1.02
0.48
-9.87
25.46
10.82
Lowest Return
2000
19.89
Highest Return
1999
11.64
-2.70
-3.30 -11.19
9.92
10.35
-3.50
-3.91 -12.01
2008
2009
2010
2011
2012
16.42
6.29 -21.22
24.75
13.75
5.37
11.96
5.74
13.70
5.74 -21.40
22.27
12.94
1.96
11.83
9.31
4.15
11.69
4.18 -21.90
20.75
12.24
0.00
11.64
18.89
8.31
3.92
11.14
3.29 -22.27
17.77
11.96
-1.58
10.09
17.49
6.85
3.90
10.91
1.60 -24.72
16.29
9.66
-5.48
9.66
1998
1999
2000
2001
2002
2003
2004
2005
2006
Model Portfolio 1
21.63
11.64
-1.02
-3.30
-9.18
18.89
8.31
3.92
Model Portfolio 2
19.89
14.32
-2.70
-3.91 -12.01
17.49
6.85
Model Portfolio 3
10.82
16.76
-3.50
5.81 -11.19
25.46
Model Portfolio 4
9.92
10.35
5.82
8.12
-9.87
Model Portfolio 5
11.69
15.27
3.19
0.48
-6.61
2007
2007
Annual
Annualized Standard
2012
Return Deviation
2008
2009
2010
2011
10.91
6.29 -21.40
17.77
12.24
5.37
11.64
5.64
11.34
3.90
11.14
5.74 -21.90
16.29
9.66
1.96
9.66
4.46
11.46
9.31
4.15
11.69
3.29 -22.27
22.27
13.75
0.00
10.09
5.71
12.34
26.31
11.04
5.74
13.70
1.60 -21.22
20.75
12.94
-1.58
11.96
6.40
11.62
31.75
14.80
8.93
16.42
4.18 -24.72
24.75
11.96
-5.48
11.83
7.02
13.68
Assumes all strategies have been rebalanced quarterly.
The S&P data are provided by Standard & Poor’s Index Services Group. Fama/French data provided by Fama/French. International Small Cap data compiled by Dimensional from Bloomberg, StyleResearch, London Business
School, and Nomura Securities data. MSCI data copyright MSCI 2013, all rights reserved; see MSCI disclosure page for additional information. The Merrill Lynch indices are used with permission; copyright 2013 Merrill Lynch,
Pierce, Fenner & Smith Incorporated; all rights reserved. Barclays Capital data, formerly Lehman Brothers, provided by Barclays Bank PLC. The returns and other characteristics of the allocation mixes contained in this
presentation are based on model/back-tested simulations to demonstrate broad economic principles. They were achieved with the benefit of hindsight and do not represent actual investment performance. There are limitations
inherent in model performance; it does not reflect trading in actual accounts and may not reflect the impact that economic and market factors may have had on an advisor’s decision making if the advisor were managing actual
client money. Model performance is hypothetical and is for illustrative purposes only. Model performance shown includes reinvestment of dividends and other earnings but does not reflect the deduction of investment advisory
fees or other expenses. Clients’ investment returns would be reduced by the advisory fees and other expenses they would incur in the management of their accounts. Indexes are not available for direct investment. Index
performance does not reflect the expenses associated with the management of an actual portfolio. Past performance is not a guarantee of future results. Not to be construed as investment advice.
5
6. DV1032.1
The Randomness of Returns: Sectors
Annual Return (%)
1998
1999
2000
2001
2002
2003
2004
2005
2006
2007
2008
2009
2010
2011
2012
61.93
82.58
54.05
3.63
-6.31
50.32
38.05
40.83
39.41
32.88
-16.09
61.85
30.53
18.46
32.39
49.92
25.07
45.67
1.41
-6.63
41.04
23.25
14.75
21.76
27.51
-23.35
53.60
24.87
13.39
29.05
38.70
23.95
38.42
1.31
-9.09
37.62
19.24
8.11
19.74
17.18
-28.11
50.17
24.16
11.90
24.56
31.22
23.46
26.76
0.86
-13.09
34.83
17.94
6.03
17.57
16.56
-38.17
35.63
23.38
5.05
19.32
17.79
17.65
7.24
-7.11
-21.08
32.09
15.39
5.96
15.44
12.58
-38.39
33.97
23.16
4.06
16.46
13.86
12.79
0.29
-12.77
-23.84
26.07
14.39
5.17
15.12
11.95
-39.41
24.05
14.46
0.64
15.28
10.28
1.81
-14.16
-14.86
-23.78
24.71
12.53
3.69
14.98
8.05
-41.22
20.97
13.39
-0.38
13.30
8.54
Highest Return
-2.89
-25.78
-16.67
-23.58
19.84
10.10
3.01
11.90
0.20
-41.99
15.62
11.81
-0.71
10.08
-7.05
-6.66
-35.38
-17.44
-37.31
18.87
3.51
-1.40
10.87
-8.69
-48.14
14.55
7.31
-14.12
4.32
-15.90
-14.64
-40.14
-28.40
-38.33
17.43
0.79
-6.04
6.65
-17.88
-51.35
11.76
5.11
-16.51
2.19
1998
1999
2000
2001
2002
2003
2004
2005
2006
2007
2008
2009
2010
2011
2012
Morningstar SEC/Basic Materials
-7.05
23.95
-14.16
0.86
-9.09
37.62
17.94
5.96
14.98
27.51
-48.14
53.60
24.87
-14.12
16.46
Morningstar SEC/Consumer Cyclical
49.92
23.46
-40.14
-17.44
-37.31
19.84
14.39
-6.04
39.41
0.20
-38.17
35.63
23.16
0.64
32.39
Morningstar SEC/Consumer Dfnsve
31.22
17.65
-25.78
3.63
-23.78
41.04
15.39
-1.40
11.90
-8.69
-41.22
50.17
30.53
4.06
24.56
Morningstar SEC/Energy
17.79
-2.89
7.24
1.41
-6.31
17.43
10.10
3.01
15.12
12.58
-16.09
15.62
14.46
13.39
10.08
-15.90
25.07
45.67
-14.86
-6.63
26.07
38.05
40.83
19.74
32.88
-38.39
33.97
23.38
5.05
4.32
Morningstar SEC/Healthcare
10.28
1.81
26.76
-7.11
-13.09
32.09
12.53
6.03
17.57
-17.88
-51.35
14.55
11.81
-16.51
29.05
Morningstar SEC/Industrials
38.70
-6.66
38.42
-12.77
-21.08
18.87
3.51
8.11
6.65
8.05
-23.35
20.97
5.11
11.90
19.32
Morningstar SEC/Technology
8.54
12.79
0.29
1.31
-23.58
34.83
19.24
5.17
15.44
11.95
-39.41
24.05
24.16
-0.71
15.28
61.93
82.58
-35.38
-28.40
-38.33
50.32
0.79
3.69
10.87
16.56
-41.99
61.85
13.39
-0.38
13.30
13.86
-14.64
54.05
-16.67
-23.84
24.71
23.25
14.75
21.76
17.18
-28.11
11.76
7.31
18.46
2.19
Lowest Return
Morningstar SEC/Financial Svc
Morningstar SEC/Communication Svc
Morningstar SEC/Utilities
Mutual fund universe statistical data and non-Dimensional money managers' fund data provided by Morningstar, Inc. Morningstar’s Sector Index family consists of 11 sector indices that track the US equity market using a
consumption-based analysis of economic sectors in a comprehensive, non-overlapping structure. Index constituents are drawn from the available pool of US-domiciled stocks that trade on one of the three major US exchanges.
Real Estate Sector Index is not included in the above illustration. Index performance does not reflect the expenses associated with the management of an actual portfolio. Past performance is not a guarantee of future results.
7. DV1037.3
Equity Returns of Emerging Markets
Annual Return (%)
1998
Highest
Return
Lowest
Return
1999
2000
2001
2002
2003
2004
2005
2006
2007
2008
2009
2010
2011
2012
Korea
Turkey
Czech Rep.
Russia
Czech Rep.
Thailand
Colombia
Egypt
China
Peru
Morocco
Brazil
Thailand
Indonesia
Turkey
141.15
252.41
1.62
55.85
44.16
144.56
132.95
161.59
82.87
94.74
-10.87
128.62
56.27
6.50
64.87
Morocco
Russia
Poland
Korea
Indonesia
Turkey
Egypt
Colombia
Indonesia
Brazil
Colombia
Indonesia
Peru
Malaysia
Philippines
24.57
247.06
-4.04
48.71
42.83
125.88
126.23
107.52
74.83
79.99
-25.10
127.63
53.35
0.12
47.56
Philippines
Malaysia
Brazil
Colombia
Hungary
Brazil
Hungary
Russia
Morocco
Turkey
Chile
Russia
Chile
Philippines
Egypt
13.45
114.33
-11.37
45.77
30.69
115.01
92.49
73.77
68.58
74.81
-35.37
104.91
44.81
0.10
47.10
Thailand
Indonesia
Chile
Peru
Peru
Peru
Czech Rep.
Korea
Peru
India
South Africa
India
Colombia
Thailand
Poland
11.56
93.46
-15.14
19.92
30.50
94.32
87.25
58.00
62.55
73.11
-37.89
102.81
43.41
-2.40
40.97
Czech Rep.
Korea
Malaysia
Mexico
South Africa
Egypt
Poland
Brazil
Philippines
China
Peru
Turkey
Malaysia
Czech Rep.
Colombia
0.54
92.42
-15.95
18.55
27.99
91.84
61.52
57.05
59.65
66.24
-40.11
98.49
37.01
-5.02
35.89
Poland
Egypt
South Africa
Taiwan
Thailand
China
Indonesia
Turkey
Russia
Egypt
Malaysia
Chile
Philippines
Colombia
Thailand
-6.69
88.40
-17.19
10.47
27.59
87.57
52.21
56.94
55.93
58.43
-41.21
86.73
35.49
-5.02
34.94
Hungary
India
Mexico
Thailand
Colombia
Chile
Mexico
Mexico
India
Czech Rep. Czech Rep.
Colombia
Indonesia
Korea
Mexico
-8.16
87.35
-20.49
5.25
25.36
84.41
48.32
49.11
51.00
55.93
-42.75
84.35
34.62
-11.76
29.06
Taiwan
Mexico
Morocco
Malaysia
Russia
India
South Africa Czech Rep.
Brazil
Indonesia
Mexico
Taiwan
South Africa
Mexico
India
-20.64
80.07
-21.55
4.56
15.71
78.36
44.91
46.20
45.80
55.03
-42.94
80.25
34.21
-12.11
25.97
India
Brazil
India
Czech Rep.
Korea
Indonesia
Turkey
India
Poland
Morocco
Taiwan
Hungary
Mexico
South Africa
China
-21.24
67.23
-21.74
-2.01
8.62
78.20
42.03
37.57
41.93
48.15
-45.88
77.61
27.61
-14.36
23.10
Egypt
South Africa
Peru
Chile
India
Russia
Brazil
Peru
Mexico
Thailand
Thailand
Thailand
Korea
Morocco
Hungary
-27.00
57.20
-23.82
-2.83
8.38
75.94
36.47
35.00
41.44
46.63
-48.27
77.31
27.15
-14.76
22.79
South Africa
Taiwan
Hungary
Indonesia
Egypt
Colombia
Chile
South Africa
Malaysia
Malaysia
China
Korea
Taiwan
China
Korea
-27.56
52.71
-26.80
-8.49
1.59
66.93
29.01
28.34
37.14
46.07
-50.83
72.06
22.73
-18.24
21.48
Chile
Thailand
Russia
Hungary
Poland
Czech Rep. Philippines
Poland
Czech Rep. Philippines Philippines
Peru
Turkey
Russia
Peru
-28.50
47.16
-30.03
-9.16
1.26
66.20
26.58
24.96
34.69
41.68
-51.87
72.06
21.24
-19.30
20.24
Malaysia
Chile
China
Morocco
Malaysia
Morocco
Korea
Philippines
Hungary
Korea
Egypt
Philippines
India
Chile
South Africa
-30.81
39.01
-30.54
-13.70
-0.66
49.03
22.86
23.92
33.70
32.58
-52.35
67.98
20.95
-20.00
19.01
Indonesia
Poland
Colombia
Brazil
Morocco
South Africa
Morocco
Chile
Chile
Poland
Poland
China
Russia
Taiwan
Taiwan
-31.53
31.50
-38.85
-16.99
-8.42
45.86
22.56
21.62
29.33
25.79
-54.49
62.63
19.40
-20.15
17.66
Mexico
Peru
Egypt
South Africa
Mexico
Philippines
India
China
Taiwan
Russia
Korea
South Africa
Poland
Peru
Russia
-33.53
18.86
-43.71
-17.21
-13.31
42.76
19.11
19.77
20.90
24.79
-55.07
57.82
15.86
-21.37
14.39
Brazil
China
Taiwan
Philippines
China
Taiwan
Malaysia
Hungary
South Africa
Chile
Brazil
Mexico
Morocco
Brazil
Malaysia
-39.62
13.33
-44.90
-19.29
-14.05
42.55
15.17
18.50
20.53
23.68
-56.06
56.63
15.33
-21.59
14.27
Peru
Hungary
Philippines
India
Chile
Korea
Taiwan
Indonesia
Egypt
South Africa Indonesia
Malaysia
Egypt
Poland
Chile
-40.22
11.66
-45.01
-19.45
-19.81
35.94
9.83
15.76
17.08
18.14
-56.20
52.06
12.42
-29.52
8.34
Colombia
Czech Rep.
Turkey
China
Taiwan
Poland
Russia
Morocco
Colombia
Hungary
Hungary
Poland
Brazil
Hungary
Indonesia
-41.71
5.35
-45.65
-24.70
-24.45
35.48
5.69
13.97
13.76
16.80
-61.53
42.51
6.81
-33.65
5.22
China
Philippines
Korea
Poland
Philippines
Mexico
Peru
Thailand
Korea
Colombia
Turkey
Egypt
China
Turkey
Czech Rep.
-42.37
3.32
-49.62
-27.44
-28.98
32.81
3.16
9.16
13.19
15.00
-62.10
39.74
4.83
-35.16
3.48
Turkey
Morocco
Thailand
Turkey
Brazil
Hungary
China
Taiwan
Thailand
Mexico
India
Czech Rep. Czech Rep.
India
Brazil
-52.51
-11.92
-56.27
-32.66
-30.65
32.31
1.89
7.25
11.61
12.15
-64.63
27.77
-1.66
-37.17
0.34
Russia
Colombia
Indonesia
Egypt
Turkey
Malaysia
Thailand
Malaysia
Turkey
Taiwan
Russia
Morocco
Hungary
Egypt
Morocco
-82.99
-14.38
-61.90
-41.30
-35.70
26.61
-0.92
2.29
-6.97
9.13
-73.83
-4.98
-9.58
-46.86
-11.48
Source: MSCI emerging markets country indices (gross dividends) with at least fifteen years of data. MSCI data copyright MSCI 2013, all rights reserved.
Indices are not available for direct investment. Index performance does not reflect expenses associated with the management of an actual portfolio.
Past performance is not a guarantee of future results.
7
8. DV1037.3
Equity Returns of Emerging Markets
Annual Return (%)
Boxed Return is highest return for the year.
1998
1999
2000
2001
2002
2003
2004
2005
2006
2007
2008
2009
2010
2011
2012
Brazil
-39.62
67.23
-11.37
-16.99
-30.65
115.01
36.47
57.05
45.80
79.99
-56.06
128.62
6.81
-21.59
0.34
Chile
-28.50
39.01
-15.14
-2.83
-19.81
84.41
29.01
21.62
29.33
23.68
-35.37
86.73
44.81
-20.00
8.34
China
-42.37
13.33
-30.54
-24.70
-14.05
87.57
1.89
19.77
82.87
66.24
-50.83
62.63
4.83
-18.24
23.10
Colombia
-41.71
-14.38
-38.85
45.77
25.36
66.93
132.95
107.52
13.76
15.00
-25.10
84.35
43.41
-5.02
35.89
0.54
5.35
1.62
-2.01
44.16
66.20
87.25
46.20
34.68
55.93
-42.75
27.77
-1.66
-5.02
3.48
-27.00
88.40
-43.71
-41.30
1.59
91.84
126.23
161.59
17.08
58.43
-52.35
39.74
12.42
-46.86
47.10
-8.16
11.66
-26.80
-9.16
30.69
32.31
92.49
18.50
33.70
16.80
-61.53
77.61
-9.58
-33.65
22.79
India
-21.24
87.35
-21.74
-19.45
8.37
78.36
19.11
37.57
51.00
73.11
-64.63
102.81
20.95
-37.17
25.97
Indonesia
-31.53
93.46
-61.90
-8.49
42.83
78.20
52.21
15.76
74.83
55.03
-56.20
127.63
34.62
6.50
5.22
Korea
141.15
92.42
-49.62
48.71
8.62
35.94
22.86
58.00
13.19
32.58
-55.07
72.06
27.15
-11.76
21.48
Malaysia
-30.81
114.33
-15.95
4.56
-0.66
26.61
15.17
2.29
37.14
46.07
-41.21
52.06
37.01
0.12
14.27
Mexico
-33.53
80.07
-20.49
18.55
-13.31
32.81
48.32
49.11
41.44
12.15
-42.94
56.63
27.61
-12.11
29.06
24.57
-11.92
-21.55
-13.70
-8.42
49.03
22.56
13.97
68.58
48.15
-10.87
-4.98
15.33
-14.76
-11.48
-40.22
18.86
-23.82
19.92
30.50
94.32
3.16
35.00
62.55
94.74
-40.11
72.06
53.35
-21.37
20.24
Philippines
13.45
3.32
-45.01
-19.29
-28.98
42.76
26.58
23.92
59.65
41.68
-51.87
67.98
35.49
0.10
47.56
Poland
-6.69
31.50
-4.04
-27.44
1.26
35.48
61.52
24.96
41.93
25.79
-54.49
42.51
15.86
-29.52
40.97
Russia
-82.99
247.06
-30.03
55.85
15.71
75.94
5.69
73.77
55.93
24.79
-73.83
104.91
19.40
-19.30
14.39
South Africa
-27.56
57.20
-17.19
-17.21
27.99
45.86
44.91
28.34
20.53
18.14
-37.89
57.82
34.21
-14.36
19.01
Taiwan
-20.64
52.71
-44.90
10.47
-24.45
42.55
9.83
7.25
20.90
9.13
-45.88
80.25
22.73
-20.15
17.66
11.56
47.16
-56.27
5.25
27.59
144.56
-0.92
9.16
11.61
46.63
-48.27
77.31
56.27
-2.40
34.94
-52.51
252.41
-45.65
-32.66
-35.70
125.88
42.03
56.94
-6.97
74.81
-62.10
98.49
21.24
-35.16
64.87
Czech Republic
Egypt
Hungary
Morocco
Peru
Thailand
Turkey
Source: MSCI emerging markets country indices (gross dividends) with at least fifteen years of data. MSCI data copyright MSCI 2013, all rights reserved.
Indices are not available for direct investment. Index performance does not reflect expenses associated with the management of an actual portfolio.
Past performance is not a guarantee of future results.
8
9. DV1040.9
Equity Returns of Developed Markets
Annual Return (%)
19 8 8
19 8 9
19 9 0
19 9 1
19 9 2
19 9 3
B elg.
A ustria
UK
H.K.
H.K.
H.K.
53.63
1
03.91
1
0.29
49.52
32.29
1 6.70
1
23.57
44.1
2
40.05
Den.
Ger.
H.K.
Sing.
Japan
US
46.26
9.1
8
A ustral
.
33.64
Switz.
52.67
Highest
Return
1
7.23
67.97
21
.44
37.1
4
Swede
n
37.21
US
US
Switz.
30.07
6.39
45.79
Swede
1n
8.34
Swede
n
33.36
Swede No rway A ustria
n
48.33
45.53
6.33
No rway
Den.
No rway
Sing.
Sing.
42.40
43.94
0.65
24.96
6.28
France
Sing.
Den.
37.87
42.26
-0.91
A ustral France
.
36.40
36.1
5
Japan
Neth.
19 9 5
19 9 6
19 9 7
19 9 8
19 9 9
2000
No rway Switz.
19 9 4
Spain
Switz.
44.25
44.25
B elg.
67.76
67.75
Sing.
Switz. A ustral A ustria Swede A ustria
n
5.85
1.
.68
1
6.55
64.53
71
.52
Italy
Italy
Can.
35.48
52.52
Swede
n
79.74
H.K.
Den.
Spain
Japan
Den.
B elg.
33.08
34.52
49.90
61
.53
3.44
-1
0.89
No rway Neth.
42.04
France France Swede
n
1
7.83
2.81
36.99
Spain No rway
US
France
H.K.
33.38
41
.54
59.52
Neth.
Can.
Spain
US
Can.
Italy
27.71
28.54
25.41
30.1
4
53.74
-1
.33
29.83
Italy
1 .56
1
US
Neth.
Neth.
Ger.
B elg.
B elg.
Neth.
Ger.
Ger.
1
7.80
2.30
35.64
8.24
25.88
27.51
24.57
29.43
Neth.
Den.
B elg.
Neth.
Sing.
H.K.
UK
Neth.
Switz.
35.28
6.68
22.57
27.42
23.77
23.53
29.27
UK
US
UK
Neth.
US
35.79
-3.1
9
1
6.56
-1
.47
Sing.
Switz.
UK
UK
33.32
Swede
n
31
.79
-6.23
1
6.02
-3.65
H.K.
US
Ger.
Switz.
Ger.
28.1
2
30.01
-9.36
1
5.77
-1
0.27
Ger.
Switz.
B elg.
Spain A ustria
20.60
Can.
26.21
Can.
-1
0.98
Sing.
1
7.07
24.30
-1 .66
1
1
5.63
-1
0.65
Swede A ustral
1n
4.42
-1 .
0.82
US
UK
Can.
B elg.
-30.49
76.43
30.73
-2.56
31
.27
US
Sing.
H.K.
Switz.
Sing.
-37.57
73.96
23.23
-6.77
30.96
58.46
-4.31
-1
4.05
-1 .05
1
Den.
Can.
38.39
A ustria Swede
n
56.96
36.28
24.64
45.1
2
31
.43
Den.
Swede
n 43.39
Can.
Spain Sweden
Sing.
No rway
Ger.
29.57
-40.60
22.1
4
-1
0.01
30.90
Den.
38.77
38.77
Sing.
France
H.K.
Can.
B elg.
H.K.
28.35
-43.27
60.1
5
20.45
-1
0.62
28.27
A ustral
.
28.34
Can.
B elg.
Japan A ustral. A ustria
-45.51
57.49
1
5.44
Den.
Ger.
Can.
US
1
4.77
24.50
Can.
Italy
No rway
54.60
32.49
24.26
Den.
Switz.
B elg.
30.82
1
6.33
36.66
Den.
49.25
A ustral A ustral A ustria
.
36.54
30.34
1 .
6.02
36.54
25.90
Neth. A ustral.
25.59
-45.87
56.1
8
Ger.
Spain
Sing.
Spain A ustral. Spain Sweden
-1 2
2.1
22.07
1
4.37
35.99
23.95
-47.35
43.48
1
4.52
-1
2.28
21
.97
H.K.
Neth.
Neth.
Den.
UK
Switz.
Can.
France
32.81
4.66
1
8.78
21
.79
1
3.55
1
7.80
20.04
-1 .53
1
-1
8.61
-1
4.97
40.22
24.98
1
3.85
France
34.48
20.59
-47.56
43.30
1 .79
1
-1
2.71
Spain
Den.
Can.
UK
H.K.
Sing.
Neth.
3.77
Switz.
1
8.31
Ger.
-1
5.23
Spain
38.1
0
Italy
22.27
Can.
Italy
32.49
France
29.78
Italy
Swede
1n
0.31
Ger.
28.53
3.54
1
6.41
-1
5.29
37.83
22.20
Neth.
31
.38
31
.38
A ustria
US
France
Ger.
Neth.
Den.
Sing.
UK
37.60
1
9.57
Italy
No rway Japan
1
9.42
-1
3.83
1 .08
1
25.48
-1
.63
1
2.59
Spain
B elg.
Spain
Japan
Japan
UK
Can.
Sing.
B elg.
1
3.53
1
7.29
-1
3.85
8.92
-21
.45
24.44
-3.04
6.45
1
2.03
Italy
Spain
Spain
B elg.
Spain
9.76
A ustral
-1 .
7.54
Ger.
1 .46
1
8.1
6
-21
.87
23.51
-4.80
France France
6.24
5.05
A ustria A ustria
1
.57
No rway A ustria A ustral
6.02
4.51
-1 .
0.44
0.35
Den.
H.K.
1
2.06
-1
4.74
-22.1
0
-1
6.03
Neth.
Ger.
France
H.K.
6.88
-1
5.59
-22.36
-1
7.79
Spain
Spain
Ger.
Neth.
4.83
-1
5.86
-22.39
-20.83
8.40
Switz.
Japan
UK
34.08
1
5.86
7.35
Italy
US
UK
Switz.
US
-26.59
-23.09
32.06
1
4.96
5.1
4
Spain
Switz.
-7.02
Swede
n
-21
.29
Can.
A ustria
Japan
Sing.
Japan
Sing.
A ustria
Sing.
0.69
-6.86
-23.67
-1
2.88
-9.1
1
Sing.
No rway
B elg.
-30.05
-30.06
-1
4.26
-1
5.50
H.K.
-21 8
.1
-6.1
4
-4.72
Ger.
1 7
6.1
France
Can.
-28.90
B elg.
35.33
Sing.
H.K.
9.1
5
9.05
-23.42
-23.29
-28.25
1
8.48
B elg.
2.28
A ustria Japan
35.91
-1
6.85
Switz.
H.K.
B elg.
Italy
1
.05
-6.28
Japan France
-0.26
Italy
US
France A ustral
.30.86
30.86
9.88
H.K.
-5.1
8
1
7.58
9.92
-2.90
20.90
Den.
Sing.
-1
0.95
28.93
France Swede Swede A ustral A ustria Can.
21
.20
1n
2.92
1n
3.96
1 .
7.62
-1 .96 -20.44
1
A ustral Can.
Den.
UK
US
Switz.
1 .
6.49
1
2.80
8.99
1
2.45
-1
2.84 -21
.38
No rway Spain
64.1
6
48.1
1
1
3.58
-1
5.50
35.21
France
1 2
4.1
-36.1
0
46.71
B elg.
A ustral
1 .1
1. 9
1
.71
Den.
25.52
-1 9
3.1
UK
0.57
UK
43.53
H.K.
1 9
4.1
Lowest
Return
Ger.
63.80
41
.20
-1
4.81
13
.1
Japan No rway
Sing.
UK
28.09
8.39
Japan
B elg.
39.55
Ger.
Japan
Japan
28.31
B elg.
US
1
.36
21
.92
-1 5
2.1
5.95
Sing.
2 0 12
Ger.
Switz. A ustral
.
-1
0.31 49.46
UK
2 0 11
UK
Swede
-1n
4.41
A ustria
-1
0.28
2 0 10
23.23
Can.
Swede A ustria No rway
n
-20.99 -1
2.23 -22.29
Italy
-7.33
2009
B elg.
1
3.77
H.K.
-7.26
2008
Japan No rway Sweden
-29.21 87.07
33.75
Switz. A ustral. Den.
22.62
-1
3.00
Italy
H.K.
Den.
France
-22.22
2007
Spain
49.36
49.36
23.24
Italy
Italy
2006
Can.
Den.
21
.87
-1
.82
France France
US
-1
2.39
2005
No rway Spain No rway A ustria No rway No rway
No rway Japan
-1
2.22
2004
21
.27
1
4.61
Italy
-4.09
-1 .36
1
2003
Ger.
Den.
Neth.
-1 9
9.1
No rway Neth.
31
.70
A ustria A ustral
-5.65
-1.
.34
No rway Spain
-0.89
2002
A ustral
.
-9.95
France A ustral
.
1 .94
1
6.07
UK
Can.
A ustral A ustral
.7
.
35.1
5.40
5.34
28.63
1 .70
1
-3.1
5
35.39
Switz. A ustral
.
6.1
8
9.30
99.40
2001
US
Neth.
-27.72
Swede Swede
n 8 -30.49
n
-27.1
28.41
1
2.24
4.41
Japan
Japan
Ger.
Neth.
US
Italy
-28.1
6
-29.40
-33.1
8
28.09
1 4
0.1
1
.90
UK
30.61
30.61
H.K.
30.35
30.35
1
3.24
UK
8.36
Italy
US
1
4.67
1
4.67
Japan
6.24
6.24
21
.29
Neth.
20.59
Switz.
20.35
Den.
UK
Den.
No rway
6.06
Swede
n
-49.86
36.57
8.76
-1
6.02
1
8.65
US
Italy
France
Ger.
H.K.
US
5.44
-49.98
31
.83
8.44
-1
6.02
1
5.33
Switz. A ustral
.
5.29
-50.67
Italy
Neth.
France
UK
26.57
1
.74
-1
6.87
1
5.25
H.K.
US
B elg.
Sing.
Italy
-51
.21
26.25
-0.42
-1
7.92
1
2.48
Ger.
Can.
Switz. A ustria
27.40
27.40
2.1
7
Can.
1
7.80
1
7.80
A ustria No rway Japan
-48.22 43.20
1
0.95
-1
4.33
UK
Neth. A ustria Sweden
-48.34 42.25
9.88
-1
5.98
Swede No rway Switz. France
n
0.62
-64.24
25.31
-4.1
1
B elg.
B elg.
Ger.
Italy
-2.73
-66.48
25.1
5
-1
5.01
Japan A ustria
-4.23
-68.41
-1
8.08
9.09
Italy
Japan
-23.1
8
8.1
8
Japan
Spain
A ustria Spain
6.25
-21
.95
-36.43
In US dollars.
Source: MSCI developed markets country indices (net dividends) with at least twenty-five years of data. MSCI data copyright MSCI 2013, all rights reserved; see MSCI disclosure page for additional information. Indexes are not
available for direct investment. Index performance does not reflect expenses associated with the management of an actual portfolio. Past performance is not a guarantee of future results.
3.00
9
11. DV1060.7
World Market Capitalization
$37.5 Trillion as of December 31, 2012
Developed Markets
Emerging Markets
Frontier Markets
Capitalization over time
($ trillions):
In US dollars. Market cap data is free-float adjusted from Bloomberg securities data. Many small nations not displayed. Totals may not equal 100% due to rounding.
For educational purposes; should not be used as investment advice. 1. An example large cap stock provided for comparison.
11
12. ME1100.4
Market Efficiency
I.
Peter Lynch
II.
Warren E. Buffett
III.
Efficient Markets Hypothesis
IV.
US Large Cap Returns
V.
The Failure of Active Management
VI.
The Mutual Fund Landscape
VII. Morningstar Predictive Power
13. ME1120.4
Peter Lynch
―All the time and effort that people devote to picking
the right fund, the hot hand, the great manager,
have in most cases led to no advantage.‖
Peter Lynch, Beating the Street (New York: Simon & Schuster, 1993), 60.
13
14. ME1130.2
Warren E. Buffett
Chairman and CEO, Berkshire Hathaway, Inc.
―Most investors, both institutional and individual, will
find that the best way to own common stocks is
through an index fund that charges minimal fees.‖
Berkshire Hathaway Inc., 1996 Annual Report, chairman’s letter, in www.berkshirehathaway.com.
14
15. ME1140.2
Efficient Markets Hypothesis
Eugene F. Fama, University of Chicago
The Hypothesis States:
• Current prices incorporate all available information and expectations.
• Current prices are the best approximation of intrinsic value.
• Price changes are due to unforeseen events.
• ―Mispricings‖ do occur but not in predictable patterns that can lead to consistent outperformance.
Implications
• Active management strategies cannot consistently add value through security selection and
market timing.
• Passive investment strategies reward investors with capital market returns.
Eugene F. Fama, ―Efficient Capital Markets: A Review of Theory and Empirical Work,‖ Journal of Finance 25, no. 2 (May 1970): 383-417.
Eugene F. Fama, ―Foundations of Finance,‖ Journal of Finance 32, no. 3 (June 1977): 961-64.
15
16. ME1150.7
US Large Cap Returns
1997-2012
16
Annualized Compound Return (%)
S&P 500 Index
CRSP 1-10 Index
Annualized Compound Returns (%)
5.34
Morningstar Fund Average
14
4.75
4.71
12
10
8
CRSP 1-10 Index
S&P 500 Index
Morningstar Fund Average
6
4
2
0
0
25
50
75
100
125
150
175
200
225 250 275 300
Number of Funds
325
350
375
400
425
450
475
Source: Morningstar data provided by Morningstar Inc. Includes all Morningstar US large cap funds with fifteen-year returns, distinct portfolios only, as of December 31, 2012. The S&P data are provided by Standard & Poor’s
Index Services Group. CRSP data provided by the Center for Research in Security Prices, University of Chicago.
Indexes are not available for direct investment. Their performance does not reflect the expenses associated with the management of an actual portfolio.
Past performance is not a guarantee of future results. Values change frequently and past performance may not be repeated. There is always the risk that an investor may lose money.
16
17. ME1160.8
The Failure of Active Management
Percentage of active public equity funds that failed to beat the index
Five Years as of December 2012
100%
90%
90%
% of Active Funds That Failed
to Outperform Benchmark
83%
80%
75%
76%
74%
70%
62%
60%
50%
40%
30%
21%
20%
10%
0%
US Large Cap
US Mid Cap
US Small Cap
Global
International
International Small
Emerging Markets
Equity Fund Category
Source: Standard & Poor’s Indices Versus Active Funds Scorecard, year-end 2012. Index used for comparison: US Large Cap—S&P 500 Index; US Mid Cap—S&P MidCap 400 Index; US Small Cap—S&P SmallCap 600
Index; Global Funds—S&P Global 1200 Index; International—S&P 700 Index; International Small—S&P World ex. US SmallCap Index; Emerging Markets—S&P IFCI Composite. Data for the SPIVA study is from the CRSP
Survivor-Bias-Free US Mutual Fund Database.
17
18. ME1160.8
The Failure of Active Management
Percentage of active public fixed income funds that failed to beat the index
Five Years as of December 2012
100%
95%
94%
90%
% of Active Funds That Failed
to Outperform Benchmark
90%
80%
76%
70%
60%
59%
60%
50%
50%
40%
40%
30%
20%
10%
0%
Government
Long
Government
Intermediate
Government
Short
InvestmentGrade
Long
InvestmentGrade
Intermediate
InvestmentGrade
Short
National
Muni
CA Muni
Fixed Income Category
Source: Standard & Poor’s Indices Versus Active Funds Scorecard, year-end 2012. Index used for comparison: Government Long—Barclays Capital US Long Government Index; Government Intermediate—Barclays Capital US
Intermediate Government Index; Government Short—Barclays Capital US 1-3 Year Government Index; Investment Grade Long—Barclays Capital US Long Government/Credit; Investment Grade Intermediate—Barclays Capital
US Intermediate Government/Credit; Investment Grade Short—Barclays Capital US 1-3 Year Government/Credit; National Muni—S&P National AMT-Free Municipal Bond Index; CA Muni—S&P California AMT-Free Municipal
Bond Index. Data for the SPIVA study is from the CRSP Survivor-Bias-Free US Mutual Fund Database. Barclays Capital data, formerly Lehman Brothers, provided by Barclays Bank PLC.
18
20. ME1161.1
The US Mutual Fund Industry
Number of equity and fixed income funds, 2012
Number of funds as of December 2012. International equities include all non-US developed funds. Global fixed includes all non-US funds, both developed and emerging markets. See Data Appendix for more information.
Source: CRSP data provided by the Center for Research in Security Prices, University of Chicago. Past performance is no guarantee of future results.
20
21. ME1161.1
The US Mutual Fund Industry
Assets under management (in USD billions)
2003 2012
Assets under management as of the end of each December from 2003 to 2012. International equities include all non-US developed funds. Global fixed includes all non-US funds, both developed and emerging markets.
See Data Appendix for more information. Data provided by the CRSP Mutual Fund Database. Source: CRSP data provided by the Center for Research in Security Prices, University of Chicago.
Past performance is no guarantee of future results.
21
22. ME1161.1
Survivorship and Outperformance
Performance periods ending December 31, 2012—equity funds
Beginning sample includes funds as of the beginning of the one-, five-, and 10-year periods ending in 2012. The number of funds as of the beginning of each sample time period is indicated below the period label.
Survivors are funds that are still in existence as of December 2012. Winners are funds that survive and beat their respective benchmarks over the period. See Data Appendix for more information.
Data provided by the CRSP Mutual Fund Database. Source: CRSP data provided by the Center for Research in Security Prices, University of Chicago. Past performance is no guarantee of future results.
22
23. ME1161.1
Survivorship and Outperformance
Performance periods ending December 31, 2012—fixed income funds
Beginning sample includes funds as of the beginning of the one-, five-, and 10-year periods ending in 2012. The number of funds as of the beginning of each sample time period is indicated below the period label.
Survivors are funds that are still in existence as of December 2012. Winners are funds that survive and beat their respective benchmarks over the period. See Data Appendix for more information.
Data provided by the CRSP Mutual Fund Database. Source: CRSP data provided by the Center for Research in Security Prices, University of Chicago. Past performance is no guarantee of future results.
23
24. ME1161.1
Do Winners Keep Winning?
Past performance vs. subsequent performance—equity funds
The sample includes funds at the beginning of the three-, five-, and seven-year periods, ending in December 2009. The graph shows the proportion of funds that outperform and underperform their respective benchmarks.
Winner funds are reevaluated in the subsequent period from 2010 to 2012, with the graph showing the proportion of outperformance and underperformance among past winners. See Data Appendix for more information.
Data provided by the CRSP Mutual Fund Database. Source: CRSP data provided by the Center for Research in Security Prices, University of Chicago. Past performance is no guarantee of future results.
24
25. ME1161.1
Do Winners Keep Winning?
Past performance vs. subsequent performance—fixed income funds
The sample includes funds at the beginning of the three-, five-, and seven-year periods, ending in December 2009. The graph shows the proportion of funds that outperform and underperform their respective benchmarks.
Winner funds are reevaluated in the subsequent period from 2010 to 2012, with the graph showing the proportion of outperformance and underperformance among past winners. See Data Appendix for more information.
Data provided by the CRSP Mutual Fund Database. Source: CRSP data provided by the Center for Research in Security Prices, University of Chicago. Past performance is no guarantee of future results.
25
26. ME1161.1
High Costs Make Outperformance Difficult
Winners and losers based on expense ratios (%)—equity funds
The sample includes funds at the beginning of the one-, five-, and 10-year periods ending in 2012. Funds are ranked into quartiles based on average expense ratio over the sample period and performance is compared to their
respective benchmarks. The chart shows the proportion of winner and loser funds within each expense ratio quartile. See Data Appendix for more information. Data provided by the CRSP Mutual Fund Database. Source:
CRSP data provided by the Center for Research in Security Prices, University of Chicago. Past performance is no guarantee of future results.
26
27. ME1161.1
High Costs Make Outperformance Difficult
Winners and losers based on expense ratios (%)—fixed income funds
The sample includes funds at the beginning of the one-, five-, and 10-year periods ending in 2012. Funds are ranked into quartiles based on average expense ratio over the sample period and performance is compared to their
respective benchmarks. The chart shows the proportion of winner and loser funds within each expense ratio quartile. See Data Appendix for more information. Data provided by the CRSP Mutual Fund Database. Source:
CRSP data provided by the Center for Research in Security Prices, University of Chicago. Past performance is no guarantee of future results.
27
28. ME1161.1
High Trading Costs Make Outperformance Difficult
Winners and losers based on turnover (%)—equity funds
The sample includes equity funds at the beginning of the one-, five, and 10-year periods ending in 2012. Funds are ranked into quartiles based on average turnover during the sample period and performance is compared to
their respective benchmarks. The chart shows the proportion of winner and loser funds within each turnover quartile. Fixed income funds are excluded from the analysis because turnover is not a good proxy for fixed income
trading costs. See Data Appendix for more information. Data provided by the CRSP Mutual Fund Database. Source: CRSP data provided by the Center for Research in Security Prices, University of Chicago. Past
performance is no guarantee of future results.
28
29. ME1161.1
Report Summary
The mutual fund landscape
Findings
•
Most funds underperformed.
•
Strong track records failed to persist.
•
High costs and excessive turnover may have contributed
to underperformance.
Lessons
•
Markets do a good job of pricing securities.
•
Intense competition makes consistent outperformance difficult.
•
Managers face cost barriers as they try to beat the market.
•
Successful fund investing involves more than picking past winners.
•
Consider a fund’s market philosophy, investment objectives,
strategy, trading costs, and other factors.
Past performance is no guarantee of future results.
29
31. RR1200.8
Risk/Return
I.
Capital Asset Pricing Model
IX.
II.
Size and Value Effects Are Strong
around the World
Average US Small Cap and Value
Premiums Following Multi-Year Runs
X.
Precision in Portfolios
XI.
Structure Determines Performance
III.
Historical US Value and Small Cap
Premiums
IV.
Yearly Observations of the US
Size, Value, and Market Premiums
V.
Five-Year Moving Average of the US
Size, Value, and Market Premiums
VI.
Distribution of the US Size, Value, and
Market Premiums
VII. Distribution of the Market Returns
VIII. US Small Cap and Value Performance
Following a Run
XII. Market Premium
XIII. Market Risk Premium Is Countercyclical
XIV. Risk and Return Are Related
XV. The Risk Dimensions Deliver
XVI. Five Factor Help Determine Expected
Return
32. RR1210.2
Capital Asset Pricing Model
William Sharpe: Nobel Prize in Economics, 1990
Total Equity Risk
Unsystematic
Company
Risk
• Specific to firm or industry (lawsuit, fraud, etc.)
• Diversifiable
Unsystematic
• No compensation
Industry
Risk
Systematic
Market
Risk
Systematic
• Marketwide, affects all firms (war, recession, inflation, etc.)
• Non-diversifiable
• Investor compensation
• Measured by beta
Beta measures volatility relative to the total market. A beta higher than the market’s beta of 1 implies more volatility, and a beta lower than the market’s implies less volatility.
32
33. RR1221.5
Historical US Value and Small Cap Premiums
Annual
VALUE MINUS GROWTH
Top 30% – Bottom 30%
Average
Premium (%)
Standard
Deviation (%)
SMALL MINUS LARGE
Bottom 50% – Top 50%
Average
Premium (%)
Standard
Deviation (%)
Jan 1926–Dec 2012
4.77
16.60
4.53
16.08
Jan 1946–Dec 2012
4.56
13.83
3.04
13.67
Jan 1975–Dec 2012
3.55
14.53
3.35
12.83
Data provided by Fama/French.
33
34. RR1222.7
Yearly Observations of the US Size Premium
Small Stocks minus Big Stocks
1927-2012
Average
60%
Within 2% of Average
Premiums within Range
50%
40%
Return Premium
30%
20%
10%
3.58%
0%
-10%
-20%
-30%
-40%
1927
1944
1961
1978
1995
Multifactor data provided by Fama/French.
Past performance is not a guarantee of future results. Values change frequently and past performance may not be repeated. There is always the risk that an investor may lose money. Securities of small firms are often less
liquid than those of large companies. As a result, small company stocks may fluctuate relatively more in price. Even a long-term investment approach cannot guarantee a profit. Economic, political, and issuer-specific events will
cause the value of securities, and the funds that own them, to rise or fall. Because the value of investments will fluctuate, there is a risk that investors will lose money.
2012
34
35. RR1222.7
Yearly Observations of the US Value Premium
Value Stocks minus Growth Stocks
1927-2012
Average
Within 2% of Average
50%
Premiums within Range
40%
30%
Return Premium
20%
10%
4.80%
0%
-10%
-20%
-30%
-40%
1927
1944
1961
1978
1995
Multifactor data provided by Fama/French.
Past performance is not a guarantee of future results. Values change frequently and past performance may not be repeated. There is always the risk that an investor may lose money. Securities of small firms are often less
liquid than those of large companies. As a result, small company stocks may fluctuate relatively more in price. Even a long-term investment approach cannot guarantee a profit. Economic, political, and issuer-specific events will
cause the value of securities, and the funds that own them, to rise or fall. Because the value of investments will fluctuate, there is a risk that investors will lose money.
2012
35
36. RR1222.7
Yearly Observations of the US Market Premium
Market minus One-Month Treasury Bills
1927-2012
Average
60%
Within 2% of Average
Premiums within Range
50%
40%
30%
Return Premium
20%
10%
8.05%
0%
-10%
-20%
-30%
-40%
-50%
1927
1944
1961
1978
1995
2012
Data provided by Fama/French. Total US Market Research Factor (total market minus one-month Treasury bills).
Past performance is not a guarantee of future results. Values change frequently and past performance may not be repeated. There is always the risk that an investor may lose money. Securities of small firms are often less
liquid than those of large companies. As a result, small company stocks may fluctuate relatively more in price. Even a long-term investment approach cannot guarantee a profit. Economic, political, and issuer-specific events will
cause the value of securities, and the funds that own them, to rise or fall. Because the value of investments will fluctuate, there is a risk that investors will lose money.
36
37. RR1223.6
Five-Year Moving Average of the US Size and Value Premiums
Annual: 1927–2012
US Size Premium
• On an annualized basis, small
cap and value stocks have had
more positive than negative
five-year periods relative to
large cap and growth stocks.
Annualized Return
25%
• These periods typically offer
stronger performance relative to
large cap and growth.
15%
5%
-5%
-15%
1931
• Small cap and value stocks are
still subject to extended periods
of underperformance.
1940
1949
1958
1967
1958
1967
1976
1985
1994
2003
2012
US Value Premium
20%
Annualized Return
15%
10%
5%
0%
-5%
-10%
1931
1940
1949
1976
1985
1994
2003
Multifactor data provided by Fama/French. SmB and HmL research factors.
Past performance is not a guarantee of future results. Values change frequently and past performance may not be repeated. There is always the risk that an investor may lose money. Securities of small firms are often less
liquid than those of large companies. As a result, small company stocks may fluctuate relatively more in price. Even a long-term investment approach cannot guarantee a profit. Economic, political, and issuer-specific events will
cause the value of securities, and the funds that own them, to rise or fall. Because the value of investments will fluctuate, there is a risk that investors will lose money.
2012
38. RR1223.6
Five-Year Moving Average of the US Market Premium
Annual: 1927–2012
30%
25%
20%
Annualized Return
15%
10%
5%
0%
-5%
-10%
-15%
1931
1940
1949
1958
1967
1976
1985
1994
2003
2012
Data provided by Fama/French. Total US Market Research Factor (total market minus one-month Treasury bills).
Past performance is not a guarantee of future results. Values change frequently and past performance may not be repeated. There is always the risk that an investor may lose money. Securities of small firms are often less
liquid than those of large companies. As a result, small company stocks may fluctuate relatively more in price. Even a long-term investment approach cannot guarantee a profit. Economic, political, and issuer-specific events will
cause the value of securities, and the funds that own them, to rise or fall. Because the value of investments will fluctuate, there is a risk that investors will lose money.
38
39. RR1225.6
Distribution of the US Size Premium
1927–2012
18
16
Number of Years
14
12
10
8
6
4
2
0
≥-30%
≥-25%
≥-20%
≥-15%
≥-10%
≥-5%
≥0%
≥5%
≥10%
≥15%
≥20%
≥25%
≥30%
≥35%
≥40%
≥45%
≥50%
Return Premium (Small minus Large)
1998
1929
1973
1990
1989
1987
1972
1970
1969
1937
Average Annual Premium:
3.58%
Green and orange years indicate 1990s and 2000s respectively.
Data provided by Fama/French. SmB research factor.
2011
2007
1995
1986
1984
1963
1962
1955
1952
1948
1947
2005
2000
1997
1996
1994
1974
1964
1960
1957
1956
1954
1953
1951
1946
1941
1930
1927
2012
2008
2006
2004
2002
1985
1966
1961
1950
1949
1940
1931
1928
2009
1993
1992
1988
1982
1981
1980
1971
1959
1942
1939
1935
1932
2010
1983
1978
1976
1958
1938
2001
1999
1991
1975
1944
1936
1979
1977
1968
1965
2003
1945
1934
1943
1967
1933
40. RR1225.6
Distribution of the US Value Premium
1927–2012
14
Number of Years
12
10
8
6
4
2
0
≥-35%
≥-30%
≥-25%
≥-20%
≥-15%
≥-10%
≥-5%
≥0%
≥5%
≥10%
≥15%
≥20%
≥25%
≥30%
≥35%
2001
1993
1984
1973
1968
1963
1944
1942
1933
1992
1983
1976
1970
1981
1954
1950
1936
1943
2000
Return Premium (Value minus Growth)
1999
1980
1934
1939
1931
Average Annual Premium:
4.80%
Green and orange years indicate 1990s and 2000s respectively.
Data provided by Fama/French. HmL research factor.
2007
1991
1971
1938
1930
2011
2009
1998
1990
1969
1967
1957
1953
1951
1928
2010
1994
1989
1987
1979
1966
1960
1956
1949
1940
1937
1927
2008
2003
1996
1995
1985
1978
1972
1959
1952
1948
1946
2012
2005
2004
2003
1986
1977
1975
1974
1965
1962
1961
1955
1947
1932
2006
2002
1997
1988
1982
1964
1958
1945
1941
1935
1929
40
41. RR1225.6
Distribution of the US Market Premium
1927–2012
12
Number of Years
10
8
6
4
2
0
≥-50% ≥-45% ≥-40% ≥-35% ≥-30% ≥-25% ≥-20% ≥-15% ≥-10% ≥-5%
≥0%
≥5%
≥10% ≥15% ≥20% ≥25% ≥30% ≥35% ≥40% ≥45% ≥50% ≥55%
Return Premium (Market minus One-Month T-Bills)
1931
2008
1974
1937
1930
1973
2002
2001
2000
1981
1969
1929
1990
1966
1962
1957
1941
1984
1977
1970
1946
1940
1932
1994
1987
1960
1953
Average Annual Premium:
8.05%
Green and orange years indicate 1990s and 2000s respectively.
Data provided by Fama/French. Total US market research factor (total market minus one-month Treasury bills).
2011
2007
2005
1978
1948
1947
1939
1934
1993
1992
1968
1959
1956
2006
2004
1988
1986
1983
1982
1979
1972
1971
1965
1964
1952
2012
2010
1998
1996
1963
1951
1949
1942
1999
1989
1985
1980
1976
1967
1961
1955
1944
2009
1997
1991
1950
1943
1938
2003
1995
1975
1936
1927
1945
1928
1958
1935
1954
1933
42. RR1226.4
Distribution of US Market Returns
CRSP 1-10 Index Returns by Year
1926–2012
Positive Years:
65
(25%)
1993
11.1
2004
12.0
1959
12.7
1952
13.4
1968
14.1
1965
14.5
2006
15.5
1942
16.0
1964
16.1
1971
16.1
2012
16.2
1986
16.2
1972
16.8
2010
17.9
1988
18.0
10% to 20%
20% to 30%
(75%)
Negative Years: 22
1949
20.2
1951
20.7
1963
21.0
1982
21.0
1944
21.3
1996
21.4
1983
22.0
1979
22.6
1998
24.3
1955
25.2
1999
25.3
1976
26.8
1961
26.9
1938
28.1
1943
28.4
1967
28.7
2009
28.8
1989
28.9
1950
29.6
1931
-43.5
2008
-36.7
1937
-34.7
1930
-28.5
1974
-27.0
2002
-21.1
1973
-18.1
1929
-14.6
2000
-11.4
2001
-11.1
1969
-10.9
1962
-10.2
1957
-10.1
1941
-10.0
1966
-8.7
1932
-8.7
1940
-7.1
1990
-6.0
1946
-5.9
1977
-4.3
1981
-3.6
1994
-0.1
1970
0.0
1953
0.7
2011
0.8
1960
1.2
1987
1.7
1948
2.1
1939
2.9
1947
3.6
1934
4.3
1984
4.5
2007
5.8
2005
6.2
1978
7.5
1956
8.3
1926
9.2
1992
9.8
-50% to -40%
-40% to -30%
-30% to -20%
-20% to -10%
-10% to 0%
0% to 10%
• In 2008, the US stock market
experienced its second worst
performance year since 1926.
• In 2009, US market performance
was in the top quartile of
historical calendar year returns.
1997
31.4
2003
31.6
1985
32.2
1936
32.3
1980
32.8
1927
33.4
1991
34.7
1995
36.8
1945
38.1
1975
38.8
1928
38.9
1935
44.3
1958
45.0
1954
50.0
1933
57.1
30% to 40%
40% to 50%
50% to 60%
Annual Return Range
CRSP data provided by the Center for Research in Security Prices, University of Chicago. The CRSP 1-10 Index measures the performance of the total US stock market, which it defines as the aggregate capitalization of all
securities listed on the NYSE, AMEX, and NASDAQ exchanges. Indices are not available for direct investment; therefore, their performance does not reflect the expenses associated with the management of an actual portfolio.
Past performance is not a guarantee of future results.
43. RR1227.6
US Small Cap Performance Following a Run
Annual: January 1946–December 2012
Move to Large when Small
outperforms for at least:
Stay in
Small all
the time
3 Years
4 Years
5 Years
Average Annual Return (%)
15.28
12.63
13.68
14.72
Compound Annualized Return (%)
12.78
10.62
11.49
12.41
Standard Deviation (%)
23.81
21.05
22.31
23.02
• For the period beginning January 1946, implementing a fixed timing strategy based
on the duration of a small cap run would not earn higher returns than simply
holding small cap all the time.
• A small cap run of 3, 4, or 5 years offers no insight into whether small or large cap
stocks will outperform in the next year.
Data provided by Fama/French. The strategy of staying invested in Small Cap all the time is compared to timing rules that switch back and forth between Small Cap and Large Cap based on the length of the Small Cap Run.
Each June 30, the timing rule looks back to see how many years in a row Small Cap has had a higher return than Large Cap. This is the Small Cap Run. If the Small Cap Run is at least 3 years (or 4, or 5), the timing rule
switches to Large Cap for the next twelve months. At the end of those twelve months, the Small Cap Run is computed again, and the process is repeated.
43
44. RR1227.6
US Value Performance Following a Run
Annual: January 1946–December 2012
Move to Growth when Value
outperforms for at least:
Stay in
Value all
the time
3 Years
4 Years
5 Years
Average Annual Return (%)
16.24
14.38
15.32
15.93
Compound Annualized Return (%)
14.26
12.54
13.40
14.03
Standard Deviation (%)
21.25
20.61
21.04
20.89
• For the period beginning January 1946, implementing a fixed timing strategy based
on the duration of a value run would not earn higher returns than simply holding
value all the time.
• A value run of 3, 4, or 5 years offers no insight into whether value or growth stocks
will outperform in the next year.
Data provided by Fama/French. The strategy of staying invested in Value all the time is compared to timing rules that switch back and forth between Value and Growth based on the length of the Value Run. Each June 30, the
timing rule looks back to see how many years in a row Value has had a higher return than Growth. This is the Value Run. If the Value Run is at least 3 years (or 4, or 5), the timing rule switches to Growth for the next twelve
months. At the end of those twelve months, the Value Run is computed again, and the process is repeated.
44
45. RR1229.6
Average US Small Cap Premiums Following Multi-Year Runs
Annual
SMALL MINUS LARGE
Run = 3 Years
Average
Premium (%)
Subsequent
Premium (%)
Run = 4 Years
Events
Subsequent
Premium (%)
Run = 5 Years
Events
Subsequent
Premium (%)
Events
Jan 1926–Dec 2012
4.53
10.17
22
7.28
15
2.16
10
Jan 1946–Dec 2012
3.04
10.29
17
8.79
12
4.07
9
Jan 1975–Dec 2012
3.35
7.89
12
9.22
10
6.50
8
• In the January 1926–December 2012 period, there were 22 periods (events) when small cap beat large
cap in three consecutive years. The Subsequent Premium in the following year averaged 10.17% across
the 22 periods.
A small cap run of 3, 4, or 5 years may not increase the likelihood of underperformance in the following year.
Data provided by Fama/French.
45
46. RR1229.6
Average US Value Premiums Following Multi-Year Runs
Annual
VALUE MINUS GROWTH
Run = 3 Years
Average
Premium (%)
Subsequent
Premium (%)
Run = 4 Years
Events
Subsequent
Premium (%)
Run = 5 Years
Events
Subsequent
Premium (%)
Events
Jan 1926–Dec 2012
4.77
9.16
22
6.32
17
3.32
12
Jan 1946–Dec 2012
4.56
6.79
18
4.32
14
2.02
10
Jan 1975–Dec 2012
3.55
7.15
12
3.33
9
0.26
6
• In the January 1926–December 2012 period, there were 22 periods (events) when value beat growth in three
consecutive years. The Subsequent Premium in the following year averaged 9.16% across the 22 periods.
A value run of 3, 4, or 5 years may not increase the likelihood of underperformance in the following year.
Data provided by Fama/French.
47. RR1250.2
Precision in Portfolios
Traditional Consulting Style Box
Three-Factor Model
Small
Large
Mid
Growth
Value
Small
Value
Blend
Growth
• Traditionally, ―products‖ have been classified into
rigid and sometimes arbitrary categories.
• Style boxes force crude strategic allocation.
Large
• Using the three-factor model, the total portfolio is
measured by factors that determine risk and
expected return.
• Freedom from brittle definitions allows precisely
tuned portfolios.
47
48. RR1255.1
Advancements in Research
Single-Factor Model
(1963)
Market
Size Effect
(1981)
Size
Large
Small
Value Effect
(1991)
Expected Profitability
(2012)
Size
Large
Low
Large
High
Small
Low
Small
Size
Direct
Profitability
High
Large
Small
Low
High
Relative Price
Low
High
Relative Price
48
49. Structure Determines Performance
Structured Exposure to
Factors explain 96% of
return variation
• The vast majority of the variation in
returns is due to risk factor exposure.
• Market
• Size
• Value/Growth
• After fees, traditional management
typically reduces returns.
Unexplained Variation is 4%
THE MODEL TELLS THE DIFFERENCE BETWEEN INVESTING AND SPECULATING
THE MODEL TELLS THE DIFFERENCE BETWEEN INVESTING AND SPECULATING
average
expected return =
[minus T-bills]
average
excess
return
+
sensitivity
to market
[market return
minus T-bills]
+
sensitivity
to size
+
[small stocks
minus big
stocks]
Priced Risk
• Positive expected return
• Systematic
• Economic
• Long-term
• Investing
sensitivity
to BtM
[value stocks
minus
growth]
+
random
error
e(t)
Unpriced Risk
• Noise
• Random
• Short-term
• Speculating
51. RR1271.5
The Risk Dimensions Delivered
July 1926–December 2012
US Value vs. US Growth
US Small vs. US Large
OVERLAPPING PERIODS
In 25-Year Periods
Value beat growth 100% of the time.
Small beat large 97% of the time.
In 20-Year Periods
Value beat growth 100% of the time.
Small beat large 88% of the time.
In 15-Year Periods
Value beat growth 99% of the time.
95%
Small beat large 82% of the time.
In 10-Year Periods
Value beat growth 96% of the time.
91%
Small beat large 75% of the time.
In 5-Year Periods
Value beat growth 86% of the time.
80%
Small beat large 60% of the time.
Periods based on rolling annualized returns. 739 total 25-year periods. 799 total 20-year periods. 859 total 15-year periods. 919 total 10-year periods. 979 total 5-year periods.
Performance based on Fama/French Research Factors. Securities of small companies are often less liquid than those of large companies. As a result, small company stocks may fluctuate relatively more in price. Mutual funds
distributed by DFA Securities LLC.
52. RR1271.5
The Risk Dimensions Delivered
January 1975–December 2012
January 1970–December 2012
International Value vs. International Growth
International Small vs. International Large
OVERLAPPING PERIODS
In 25-Year Periods
Value beat growth 100% of the time.
Small beat large 100% of the time.
In 20-Year Periods
Value beat growth 100% of the time.
Small beat large 97% of the time.
In 15-Year Periods
Value beat growth 100% of the time.
Small beat large 83% of the time.
In 10-Year Periods
Value beat growth 100% of the time.
Small beat large 80% of the time.
In 5-Year Periods
96%
Value beat growth 98% of the time.
Small beat large 79% of the time.
Based on rolling annualized returns. Rolling multi-year periods overlap and are not independent. This statistical dependence must be considered when assessing the reliability of long-horizon return differences.
International Value vs. International Growth data: 157 overlapping 25-year periods. 217 overlapping 20-year periods. 277 overlapping 15-year periods. 337 overlapping 10-year periods. 397 overlapping 5-year periods.
International Small vs. International Large data: 217 overlapping 25-year periods. 277 overlapping 20-year periods. 337 overlapping 15-year periods. 397 overlapping 10-year periods. 457 overlapping 5-year periods.
International Value and Growth data provided by Fama/French from Bloomberg and MSCI securities data. International Small data compiled by Dimensional from Bloomberg, StyleResearch, London Business School, and
Nomura Securities data. International Large is MSCI World ex USA Index gross of foreign withholding taxes on dividends; copyright MSCI 2013, all rights reserved.
53. RR1272.6
Market Premium
Fama/French US Market Research Factor Returns
Monthly: January 1990–December 2012
Year
Annual
Return
1990
1991
Jan
Feb
Mar
Apr
May
Jun
Jul
Aug
Sep
Oct
Nov
Dec
-13.80%
-7.60%
0.90%
1.80%
-3.50%
8.20%
-1.10%
-1.60%
-9.90%
-6.00%
-1.90%
6.00%
2.40%
29.10%
4.40%
7.10%
2.50%
-0.20%
3.60%
-4.80%
4.20%
2.20%
-1.60%
1.40%
-4.10%
10.30%
1992
6.40%
-0.50%
1.10%
-2.70%
1.00%
0.40%
-2.30%
3.70%
-2.30%
1.00%
0.90%
3.80%
1.50%
1993
8.40%
1.00%
0.30%
2.30%
-2.80%
2.70%
0.30%
-0.30%
3.70%
-0.20%
1.60%
-2.00%
1.70%
1994
-4.10%
2.90%
-2.60%
-4.90%
0.70%
0.60%
-3.10%
2.80%
3.90%
-2.20%
1.10%
-4.10%
0.80%
1995
31.00%
1.60%
3.60%
2.20%
2.10%
2.90%
2.70%
3.60%
0.50%
3.20%
-1.60%
3.90%
1.00%
1996
16.20%
2.40%
1.20%
0.70%
2.10%
2.30%
-1.20%
-5.80%
2.80%
4.90%
0.90%
6.10%
-1.60%
1997
26.10%
4.90%
-0.50%
-4.90%
3.80%
6.70%
4.00%
7.20%
-4.00%
5.40%
-3.90%
2.70%
1.30%
1998
19.40%
0.00%
6.90%
4.70%
0.70%
-3.00%
2.80%
-2.70%
-16.20%
5.90%
7.10%
5.90%
5.90%
1999
20.20%
3.50%
-4.20%
3.40%
4.50%
-2.40%
4.70%
-3.40%
-1.40%
-2.70%
5.80%
3.30%
8.00%
2000
-16.70%
-4.40%
2.80%
4.90%
-6.40%
-4.40%
4.80%
-2.20%
7.10%
-5.60%
-3.00%
-10.80%
1.50%
2001
-14.80%
3.40%
-10.30%
-7.50%
8.00%
0.70%
-2.00%
-2.10%
-6.20%
-9.40%
2.60%
7.70%
1.60%
2002
-22.90%
-1.80%
-2.30%
4.30%
-5.10%
-1.20%
-7.20%
-8.30%
0.70%
-10.10%
7.40%
6.00%
-5.40%
2003
30.70%
-2.40%
-1.60%
0.90%
8.20%
6.30%
1.50%
2.20%
2.40%
-1.00%
6.00%
1.60%
4.50%
2004
10.70%
2.20%
1.50%
-1.20%
-2.50%
1.40%
2.10%
-3.90%
0.20%
2.00%
1.70%
4.70%
3.40%
2005
3.20%
-2.80%
2.10%
-1.90%
-2.70%
3.60%
0.90%
4.10%
-0.90%
0.80%
-2.40%
3.70%
0.00%
2006
10.60%
3.70%
-0.50%
1.50%
0.90%
-3.50%
-0.40%
-0.60%
2.10%
1.50%
3.30%
2.00%
0.70%
2007
0.80%
1.50%
-1.80%
0.90%
3.60%
3.50%
-1.90%
-3.60%
0.70%
3.80%
2.30%
-5.30%
-0.70%
2008
-38.40%
-6.40%
-2.30%
-1.20%
5.00%
2.20%
-8.00%
-1.50%
1.00%
-10.00%
-18.60%
-8.50%
2.10%
2009
29.10%
-7.70%
-10.10%
8.80%
11.10%
6.70%
-0.30%
8.20%
3.20%
4.50%
-2.80%
5.70%
2.90%
2010
18.00%
-3.70%
3.50%
6.40%
2.00%
-8.00%
-5.20%
7.20%
-4.40%
9.20%
3.90%
0.60%
6.80%
2011
-0.90%
0.50%
3.90%
0.30%
2.80%
-1.50%
-1.90%
-2.40%
-5.90%
-8.40%
11.50%
-0.60%
0.50%
2012
15.00%
5.10%
4.40%
3.10%
-0.80%
-6.20%
3.90%
0.80%
2.60%
2.70%
1.80%
0.80%
1.20%
Indicates a monthly return greater than 6.0% or less than -6.0%.
Monthly returns greater than 6%
25
Monthly returns less than 6%
21
Sources: Fama/French data provided by Fama/French.
Indices are not available for direct investment; their performance does not reflect the expenses associated with the management of an actual portfolio. Past performance is not a guarantee of future results.
53
54. RR1272.6
Market Premium
Fama/French US Market Research Factor Returns
Monthly: January 1990–December 2012
20%
15%
Highest
Monthly
Return: 11.5%
(Oct 2011)
Monthly Return
10%
5%
Average
Monthly
Return: 0.53%
0%
-5%
Lowest
Monthly
Return: -18.6%
(Oct 2008)
-10%
-15%
-20%
1990
1992
1994
1996
1998
2000
2002
2004
2006
2008
2010
2012
Sources: Fama/French data provided by Fama/French.
Indices are not available for direct investment; their performance does not reflect the expenses associated with the management of an actual portfolio. Past performance is not a guarantee of future results.
54
55. RR1272.6
S&P 500 Index Returns
Monthly: January 1990–December 2012
20%
15%
Highest
Monthly
Return: 11.4%
(Dec 1991)
Monthly Return
10%
5%
Average
Monthly
Return: 0.78%
0%
-5%
Lowest
Monthly
Return: -16.8%
(Oct 2008)
-10%
-15%
-20%
1990
1992
1994
1996
1998
2000
2002
2004
2006
2008
2010
2012
Sources: Dimensional; the S&P data are provided by Standard & Poor’s Index Services Group.
Indices are not available for direct investment; their performance does not reflect the expenses associated with the management of an actual portfolio. Past performance is not a guarantee of future results.
55
56. RR1273.3
Market Risk Premium Is Countercyclical
Business Cycle
Peak
Trough
Risk Premium
The risk premium is the additional return an investor requires to compensate for the risk borne. Business cycle is a repetitive cycles of economic expansion and contractions. Peak is the high point at the end of an economic
expansion until the start of a contraction. Trough is the transition point between economic recession and recovery.
56
58. LT1300.7
Long-Term Discipline
I.
The Importance of Long-Term Discipline
II.
The Stock Market’s Reaction
III.
Performance of the S&P 500 Index
IV.
Historical Performance vs. Large Stocks
V.
Bull and Bear Markets
VI.
The Market’s Response to Crisis
VII. Stocks vs. The Risk-Free Rate
VIII. Volatility and Market Downturns
IX.
Long-Term Market Stability
X.
Perils of Market Timing
XI.
Missing Opportunity
XII. Recessionary Periods
58
60. LT1320.2
The Stock Market’s Reaction
As Measured by the Dow Jones Industrial Average
First Trading Session Response
Prior
Day
Close
Subsequent Market Behavior
Close
Change
Percent
Change
9,605.51
8,920.70
-684.81
-7.13%
-3.66%
11.12%
-8.71%
US launches bombing attack on Iraq
2,508.91
2,623.51
114.60
4.57%
16.97%
18.93%
29.52%
August 2, 1990
Iraq invades Kuwait
2,899.26
2,864.60
-34.66
-1.20%
-8.74%
-4.67%
4.95%
March 30, 1981
President Reagan shot by John Hinckley Jr.
994.78
992.16
-2.62
-0.26%
1.95% -14.33%
-16.90%
August 9, 1974
President Nixon resigns
784.89
777.30
-7.59
-0.97%
-14.71%
-8.87%
5.98%
November 22, 1963
President Kennedy assassinated in Dallas
732.64
711.48
-21.16
-2.89%
6.57%
15.37%
24.99%
October 22, 1962
Cuban missile crisis
568.60
558.06
-10.54
-1.85%
15.55%
27.41%
33.89%
September 24, 1955
President Eisenhower heart attack
487.44
455.55
-31.89
-6.54%
0.04%
12.48%
5.72%
June 25, 1950
North Korea invades South Korea
224.30
213.90
-10.40
-4.64%
-4.49%
7.34%
15.13%
December 7, 1941
Japan attacks Pearl Harbor, Hawaii
115.90
112.52
-3.38
-2.92%
-0.86%
-6.19%
2.88%
Date
Event
September 11, 2001
World Trade Center towers destroyed
January 16, 1991
Dow Jones data provided by Dow Jones Indexes.
Past performance is not a guarantee of future results. Values change frequently and past performance may not be repeated.
There is always the risk that an investor may lose money.
One
Six
Month Months
One
Year
60
62. LT1330.8
Performance of the S&P 500 Index
Daily: January 1, 1970-December 31, 2012
• The best single day was October
13, 2008.
Best/Worst Missed Period
• The best one-month return, October
1974, happened immediately after the
second-worst one-year period.
• 8 of the top 25 days occurred between
September 2008 and February
2009, during which time the S&P
dropped 41.8%
• 5 of the Top 10 days occurred
between October 2008 and November
2008, during which time, the S&P 500
dropped 22.8%.
14%
Annualized Compound Returns %
• The occurrence of strongly positive
returns has been especially
unpredictable. Investors attempting to
wait out an apparent downturn ran a
high risk of missing these best
periods.
Day
12%
3 Months
Ending
10/19/87
10/87
11/08
2/09
10.49%
Total Period
Month
6 Months
Ending
12 Months
Ending
10.56%
10.84%
11.33%
11.40%
9.66%
9.55%
9.05%
8.73%
10/13/08
10/74
2/09
Worst Periods
and the Return
If Missed
9.94%
10%
8%
6%
9.33%
10/82
6/75
6/83
Best Periods
and the Return
If Missed
4%
2%
0%
Time periods greater than one month are based on monthly rolling periods, and dates indicated are end of period.
The S&P data are provided by Standard & Poor’s Index Services Group.
Indexes are not available for direct investment. Their performance does not reflect the expenses associated with the management of an actual portfolio. Dimensional Fund Advisors is an investment advisor registered with the
Securities and Exchange Commission. Information contained herein is compiled from sources believed to be reliable and current, but accuracy should be placed in the context of underlying assumptions. This publication is
distributed for educational purposes and should not be considered investment advice or an offer of any security for sale. Past performance is not a guarantee of future results. Unauthorized copying, reproducing, duplicating, or
transmitting of this material is prohibited.
Date of first use: June 1, 2006.
63. LT1340.9
Value Stocks vs. Large Stocks
Monthly: July 1926-December 2012
Rolling Time Periods
Total Number of Periods
Number of Periods US Large Value Index
Outperformed S&P 500 Index
1 Year
3 Years
5 Years
10 Years
15 Years
20 Years
30 Years
40 Years
1027
1003
979
919
859
799
679
559
573
654
735
751
775
766
679
559
96%
100%
100%
90%
82%
75%
65%
56%
Percentage of All Rolling Periods Where US Large Value Index Outperformed S&P 500 Index
US Large Value Index is Fama/French US Large Value Index (ex utilities), provided by Fama/French. The S&P data are provided by Standard & Poor’s Index Services Group. Indexes are not available for direct investment.
Their performance does not reflect the expenses associated with the management of an actual portfolio.
Past performance is not a guarantee of future results. Values change frequently and past performance may not be repeated. There is always the risk that an investor may lose money. Even a long-term investment approach
cannot guarantee a profit. Economic, political, and issuer-specific events will cause the value of securities, and the portfolios that own them, to rise or fall. Because the value of your investment in a portfolio will fluctuate, there is
a risk that you will lose money. Indexes are referred to for comparative purposes only and do not represent similar asset classes in terms of components or risk exposure; thus, their returns may vary significantly. The S&P 500
Index measures the performance of large cap US stocks. US Large Value Index measures the performance of US stocks with lower price-to-book ratios.
64. LT1340.9
Small Stocks vs. Large Stocks
Monthly: January 1926-December 2012
Rolling Time Periods
Total Number of Periods
Number of Periods US Small Cap Index
Outperformed S&P 500 Index
1 Year
3 Years
5 Years
10 Years
15 Years
20 Years
30 Years
40 Years
1033
1009
985
925
865
805
685
565
551
536
570
593
622
658
629
565
100%
92%
82%
72%
64%
58%
53%
53%
Percentage of All Rolling Periods Where US Small Cap Index Outperformed S&P 500 Index
The S&P data are provided by Standard & Poor’s Index Services Group. CRSP data provided by the Center for Research in Security Prices, University of Chicago. Indexes are not available for direct investment. Their
performance does not reflect the expenses associated with the management of an actual portfolio.
Past performance is not a guarantee of future results. Values change frequently and past performance may not be repeated. There is always the risk that an investor may lose money. Even a long-term investment approach
cannot guarantee a profit. Economic, political, and issuer-specific events will cause the value of securities, and the portfolios that own them, to rise or fall. Because the value of your investment in a portfolio will fluctuate, there is
a risk that you will lose money. Securities of small companies are often less liquid than those of large companies. As a result, small company stocks may fluctuate relatively more in price. Indexes are referred to for comparative
purposes only and do not represent similar asset classes in terms of components or risk exposure; thus, their returns may vary significantly. The S&P 500 Index measures the performance of large cap US stocks. The CRSP 610 Index measures the performance of US small cap stocks, those in the five smallest deciles of the US market.
66. LT1370.15
Bull and Bear Markets
S&P 500 Index (USD)
Daily Returns: January 1, 1926–June 30, 2013
Average Duration
Bull Market
Bear Market
Average Return
Bull Market
Bear Market
413 Days
216 Days
58%
-21%
303%
220%
156%
121%
119%
100%
99%
87%
113%
96%
91%
83%
59%
53%
44%
40%
23%
26%
25% 22%
27%
20%
56%
44%
19%
26%
18%
26%
84%
78%
69%
50%
38%
22%
15%
73%
27% 48%
38% 26%
21%
6/30/2012
58%
37% 50%
16%
35%
23%
21%
13%
1%
-13%
-11%
-13%
-16%
-39%
-15%
-13% -33%
-14%
-53% -25%
-10%
-11%
-26%
-11% -13%
-16%
-11% -10%
-11% -13%
-21%
-27%
-11%
-27%
-11%
-10%
-13% -15%
-20%
-13%
-13%
-16%
-12%
-21%
-32%
-10%
-19%
-33%
-12% -12%
-11%
-19%
-45%
-14%
-47%
-16% -19%
-55%
-85%
1926
1931
1936
1941
1946
1951
1956
1961
1966
1971
1976
1981
1986
1991
1996
2001
2006
Indices are not available for direct investment; its performance does not reflect the expenses associated with the management of an actual portfolio. Past performance is no guarantee of future results. The S&P data are
provided by CRSP (January 1, 1926–August 31, 2008) and Bloomberg (September 1, 2008–present).
Returns include reinvested dividends. Bull and bear markets are defined in hindsight using cumulative daily returns. A bear market (1) begins with a negative daily return, (2) must achieve a cumulative return less than or equal
to -10%, and (3) ends at the most negative cumulative return prior to achieving a positive cumulative return. All data points which are not considered part of a bear market are designated as a bull market. Performance data
represents past performance and does not predict future performance.
2011
67. LT1370.15
Bull and Bear Markets
S&P 500 Index (USD)
Monthly Returns: January 1926–June 30, 2013
116 mos.
491%
Average Duration
Bull Market
Bear Market
Average Return
Bull Market
Bear Market
30 Months
11 Months
Months = Duration of Bull/Bear Market
% = Total Return for the Bull/Bear Market
111%
-26%
92 mos.
355%
61 mos.
282%
44 mos.
193%
49 mos.
210%
2 mos.
92%
6 mos.
100%
3 mos. 23 mos.
26%
133%
4 mos.
9 mos.
12%
48 mos.
105%
61%
43 mos.
90%
5 mos.
22%
61 mos.
108%
9 mos. 33 mos.
30 mos. 55%
86%
26 mos. 76%
15 mos.
52%
35%
30 mos.
71%
24 mos.
63%
14 mos.
65%
10 mos.
34%
Jun 2013
48%
5 mos.
12%
6 mos.
4 mos.
-30% 13 mos. -16%
2 mos. -50%
31 mos.
34 mos. -19%
-30%
-83% 6 mos.
-21%
4 mos.
-10%
1925
1930
1935
1940
7 mos.
-10%
5 mos.
-15%
6 mos.
-22%
1945
1950
1955
3 mos.14 mos. 20 mos.
6 mos. 8 mos.
-11% -14% -17%
-16% 19 mos. 21 mos.
-22%
-29%
-43%
1960
1965
1970
1975
1980
1985
5 mos.
3 mos. -15%
-30%
1990
2 mos.
-15%
1995
25 mos.
-45%
2000
Indices are not available for direct investment; its performance does not reflect the expenses associated with the management of an actual portfolio. Past performance is no guarantee of future results. The S&P
data are provided by Standard & Poor’s Index Services Group. Bull and bear markets are defined in hindsight using cumulative monthly returns. A bear market (1) begins with a negative monthly return, (2) must
achieve a cumulative return less than or equal to -10%, and (3) ends at the most negative cumulative return prior to achieving a positive cumulative return. All data points which are not considered part of a bear
market are designated as a bull market.
5 mos.
-16%
2 mos.
16 mos. -13%
-51%
2005
2010
69. LT1370.15
Bull and Bear Markets
MSCI EAFE Index, Net Dividends (USD)
Monthly Returns: January 1970–June 30, 2013
Average Duration
Bull Market
Bear Market
37 mos.
323%
24 Months
11 Months
Average Return
Bull Market
Bear Market
87%
-23%
55 mos.
206%
Months = Duration of Bull/Bear Market
% = Total Return for the Bull/Bear Market
34 mos.
57mos.
39 mos.
103%
93%
67%
7 mos.
41%
93%
18 mos.
47%
36%
4 mos.
5 mos.
-15%
-13%
18 mos.
9 mos.
-13%
2 mos.
-11 % 17 mos.
-20%
53%
5 mos.
8 mos.
26%
19%
5 mos.
15 mos.
26 mos.
13 mos.
4 mos.
-15%
20 mos.
2 mos.
-17%
18%
9 mos.
-15%
4 mos. 2 mos.
-11% -15%
-31%
Jun 2013
39 mos.
-42%
Feb 2009
16 mos.
-48%
-57%
1970
1974
1978
1982
1986
1990
1994
1998
2002
2006
Indices are not available for direct investment; its performance does not reflect the expenses associated with the management of an actual portfolio. Past performance is no guarantee of future results. MSCI
data copyright MSCI 2013, all rights reserved. Bull and bear markets are defined in hindsight using cumulative monthly returns. A bear market (1) begins with a negative monthly return, (2) must achieve a
cumulative return less than or equal to -10%, and (3) ends at the most negative cumulative return prior to achieving a positive cumulative return. All data points which are not considered part of a bear market
are designated as a bull market.
2010
-18%
70. LT1370.15
Bull and Bear Markets
MSCI Emerging Markets Index, Gross Dividends (USD)
Monthly Returns: January 1988–June 2013
Average Duration
Bull Market
Bear Market
Average Return
Bull Market
Bear Market
15 Months
6 Months
72%
-26%
Months = Duration of Bull/Bear Market
% = Total Return for the Bull/Bear Market
19 mos.
109%
17 mos.
101%
98%
21 mos.
114%
16 mos.
17 mos.
18 mos.
92%
16 mos.
89%
85%
4 mos.
31%
8 mos.
7 mos.
29 mos.
43%
42%
38%
5 mos.
21%
5 mos.
1 mo. 1 mo.
-12% -14%
4 mos.
3 mos.
4 mos.
2 mos.
-14%
-12% 5 mos.
-25%
-11%
-11%
-29%
5 mos.
Jun 2013
-24%
-18%
18 mos.
13 mos.
-48%
Feb 2009
16 mos.
-56%
1988
1990
1992
1994
1996
1998
2000
2002
2004
2006
2008
-61%
Indices are not available for direct investment; its performance does not reflect the expenses associated with the management of an actual portfolio. Past performance is no guarantee of future results.
MSCI data copyright MSCI 2013, all rights reserved. Bull and bear markets are defined in hindsight using cumulative monthly returns. A bear market (1) begins with a negative monthly return, (2) must
achieve a cumulative return less than or equal to -10%, and (3) ends at the most negative cumulative return prior to achieving a positive cumulative return. All data points which are not considered part
of a bear market are designated as a bull market.
2010
2012
71. LT1385.5
The Market’s Response to Crisis
Performance of a Normal Balanced Strategy: 60% Stocks, 40% Bonds
Cumulative Total Return
After 1 year
After 3 years
84%
After 5 years
59%
50%
50%
48%
42%
35%
21%
20%
21%
13%
12%
8%
1%
-2%
October 1987:
Stock Market Crash
August 1989:
US Savings and
Loan Crisis
-5%
September 1998:
Asian Contagion
Russian Crisis
Long-Term Capital
Management Collapse
March 2000:
Dot-Com Crash
-4%
September 2001:
Terrorist Attack
September 2008:
Bankruptcy of
Lehman Brothers
Balanced Strategy: 7.5% each S&P 500 Index, CRSP 6-10 Index, US Small Value Index, US Large Value Index; 15% each International Value Index, International Small Index; 40% BofA Merrill Lynch One-Year US Treasury
Note Index.
The S&P data are provided by Standard & Poor’s Index Services Group. The Merrill Lynch Indices are used with permission; copyright 2012 Merrill Lynch, Pierce, Fenner & Smith Incorporated; all rights reserved. CRSP data
provided by the Center for Research in Security Prices, University of Chicago. US Small Value Index and US Large Value Index provided by Fama/French. International Value Index provided by Fama/French. International
Small Cap Index compiled by Dimensional from StyleResearch securities data; includes securities of MSCI EAFE countries in the bottom 10% of market capitalization, excluding the bottom 1%; market-cap weighted; each
country capped at 50%; rebalanced semiannually. Indexes are not available for direct investment. Their performance does not reflect the expenses associated with the management of an actual portfolio. Past performance is
not a guarantee of future results. Not to be construed as investment advice. Returns of model portfolios are based on back-tested model allocation mixes designed with the benefit of hindsight and do not represent actual
investment performance.
71
73. LT1388.6
Long-Term Returns vs. Short-Term Volatility
1999 S&P 500 Illustration
April 1999 Daily Returns
Total Month of April Return: 3.9%
S&P 500
$2,980
Dec 2010
-2.24%
1
15
30
During this month, the S&P 500
had 10 days of negative returns
out of 21 trading days.
1999 Monthly Returns
Total Annual Return: 21%
21.04%
-0.49%
J
• Even during periods of positive stock returns,
investors may experience substantial volatility.
-3.11%
F M
A
-2.36% -3.12% -2.74%
M J J A S O
N
D
During this year, the S&P 500
had 5 out of 12 months with
negative returns.
• Short-term volatility is a typical characteristic of stock market investing.
• Long-term returns are the sum of short-term volatility.
The S&P data are provided by Standard & Poor's Index Services Group. Indexes are not available for direct investment. Index performance does not reflect the expenses associated with the management of an actual portfolio.
Past performance is not a guarantee of future results. Not to be construed as investment advice.
74. LT1388.7
Market Downturns—A Historical Perspective
Individual Index Monthly Downturns
As of December 31, 2012
Domestic
Large Cap
Fund Equivalent Index
Start Date
End Date
Threshold
Months at or below Threshold
Months in Sample
Percentage of Months below Threshold
Domestic
Small Cap
International
Emerging
S&P 500
Index
January 1926
December 2012
-7%
63
1,044
6.0%
CRSP 6-10
Index
January 1926
December 2012
-7%
111
1,044
10.6%
MSCI EAFE
Index
January 1970
December 2012
-7%
33
516
6.4%
MSCI Emerging
Markets Index
January 1988
December 2012
-7%
37
300
12.3%
21.1%
16.4%
16.1%
13.9%
10.4%
11.1%
12.8%
11.2%
8.0%
11.8%
13.1%
12.3%
Annualized Average Compound Return over
Subsequent Periods (starting the next month)
1 Year
3 Years
5 Years
10 Years
9.1%
9.5%
9.9%
8.4%
• Individual asset class
volatility and negative
returns have occurred
in the past.
• Despite these
downturns, investors
who remained
disciplined were
rewarded in the long
run.
• Use balanced
diversified portfolios
and focus on longterm results.
Sources: The S&P data are provided by Standard & Poor's Index Services Group; CRSP Index returns from the Center for Research in Security Prices, University of Chicago; MSCI data copyright MSCI 2013, all rights reserved.
MSCI EAFE Index is net of foreign withholding taxes on dividends. MSCI Emerging Markets Index is gross of foreign withholding taxes on dividends. Annualized average compound return over subsequent periods is calculated
as the compound growth rate required to produce the average total return over the same time period. Performance for periods greater than one year are annualized. Indices are not available for direct investment; therefore, their
performance does not reflect expenses associated with management of an actual portfolio. Past performance is not a guarantee of future results and there is always the risk that an investor may lose money.
74
Editor's Notes
Talking Points:While emerging market stock markets around the world often outperform the US market, this performance is unpredictable and at times extreme.This table ranks annual stock market performance in US dollar terms for twenty-two different emerging markets (from highest to lowest) over the last fifteen years. The colors correspond to the countries featured on the next slide, and the patchwork dispersion of colors shows no predictable pattern. Investors who follow a structured, diversified strategy are more likely to capture the returns wherever they happen to occur.
Talking Points:Investing in securities markets outside the US helps build more extensive diversification into a portfolio.This chart shows annual performance in US dollar terms of twenty-two emerging market stock markets for the last fifteen years, highlighting the top performer in each calendar year. Although many investors prefer to keep their capital close to home, they may pay a high price in terms of lower diversification and missed opportunity.
Talking Points:This cartogram depicts the world not according to land mass, but by the size of each country’s stock market relative to the world’s total market value (free-float adjusted). Population, gross domestic product, exports, and other economic measures may influence where people invest. But the map offers a different way to view the universe of equity investment opportunities. If markets are efficient, global capital will migrate to destinations that offer the most attractive risk-adjusted expected returns. Therefore, the relative size and growth of markets may help in assessing the political, economic, and financial forces at work in countries. The cartogram brings into sharp relief the investible opportunity of each country relative to the world. It avoids distortions that may be created or implied by attention to economic or fundamental statistics, such as population, consumption, trade balances, or GDP. By focusing on an investment metric rather than on economic reports, the chart further reinforces the need for a disciplined, strategic approach to global asset allocation. Of course, the investment world is in motion, and these proportions will change over time as capital flows to markets that offer the most attractive returns. The countries we used this year are the same countries represented in the MSCI All Country World IMI Index and the MSCI Frontier Markets Index, with the exception of Saudi Arabia, which was added this year. While we used the same countries as in the MSCI Indices, we did not use the same list of stocks. This year’s map includes a greater representation of small cap stocks, particularly in the emerging and frontier countries, which explains the market capitalization fluctuations in countries such as Chile and Turkey as compared to last year. New this year, Israel has moved from being an emerging to a developed market; and Colombia, Egypt, and Peru have been added to the emerging markets where Dimensional invests. Some Dimensional emerging market strategies may not invest in all of the designated emerging markets.
The efficient markets hypothesis implies that no active investor will consistently beat the market over long periods of time, except by chance. Yet active managers test the hypothesis every day through their efforts to pick stocks and time markets. The evidence shows that their efforts are not worth the high cost borne by investors. This slide displays the percentage of actively managed public equity funds that failed to outperform their respective market benchmarks for each major fund category for the five-year period ending December 2012. Most of the fund categories failed to beat their respective benchmark as a group. This is consistent with research, which shows that, as a group, active managers underperform the market by an amount equivalent to their average fees and expenses. The lone exception is the international small fund manager category during the period. As indicated in the graph, 21% of this group failed to beat the respective benchmark, which is the S&P Developed ex-US Small Cap index. More detailed analysis reveals that many managers in the international small category had significant holdings in emerging market stocks, which is a different asset class that had stronger performance during the period. The large percentage of outperformance among international small managers may result from a large portion of them holding a different asset class and being compared to the wrong benchmark.If the manager group’s average return is benchmarked to an international small cap index that includes emerging markets, the rate of underperformance rises to over 60%, which is in line with the other equity fund categories. (Benchmark is the MSCI All Country World ex USA Small Cap Index.)
Research by Eugene Fama and other financial academics has offered evidence that the bond markets are efficient and that interest rates and bond prices do not move predictably. This appears to be the case with all types of issues, from short-term government instruments to long-term corporate bonds. This slide illustrates the formidable challenge that active bond managers face. The graph shows the percentage of active fixed income funds in each category that failed to beat their respective market benchmark for the five-year period ending December 2012. All categories had at least a 40% failure rate, with failure defined as underperforming their benchmark. This is consistent with financial theory and research, which propose that active managers cannot outperform the market as a group, particularly after accounting for management fees, trading costs, and other expenses.
This histogram quantifies the distribution of the size premium in the US equity market. Each bar represents a range of return premiums (horizontal axis) and the number of years the premium was in that range (vertical axis). For example, there were six years in which small cap outperformed large cap by at least 15% but less than 20%. Those six years are listed below the bar as 2001, 1999, 1991,1975,1944, and 1936. The green and orange years indicate the 1990s and 2000s, respectively.This histogram suggests that the size effect has been positive slightly more than half the time since 1927—and most of the annual premiums have occurred in the 0% to 10% range. When small cap stocks have underperformed large cap stocks, most negative premiums have occurred in the range of -10% or less.
This histogram quantifies the distribution of the value premium in the US equity market. Each bar represents a range of returns (horizontal axis) and the number of years the return was in that range (vertical axis). For example, there were 14 years in which value outperformed growth by at least 5% but less than 10%. The individual years are listed below the bar, starting with 2012. The green and orange years indicate the 1990s and 2000s, respectively.This histogram suggests that the value effect has been positive more than 60% of the time since 1927—and most of this annual outperformance has occurred in the 0% to 20% premium range. When value stocks have underperformed growth stocks, most negative premiums have occurred in the range of -15% or less.
This histogram quantifies the distribution of the annual US market premium since 1927. Each bar represents a range of return premiums (horizontal axis) and the number of years the premium was in that range (vertical axis). For example, there were five years in which the US market outperformed T-bills by at least 5% but less than 10%. Those years are listed below the bar in descending order (1993, 1992, 1968, etc.). The green and orange years indicate the 1990s and 2000s, respectively. This histogram suggests that the market premium has been positive about two-thirds of the time since 1927—and most of the annual premiums have occurred in the 0% to 25% range. When the market has delivered lower returns than T-bills, most of these negative premiums have occurred in the range of -15% or less.
Exposure to three equity risk factors and two fixed income risk factors accounts for most of a diversified portfolio's expected return. The three equity risk factors are: Market—stocks have higher expected returns than fixed income securities.Size—small cap stocks have higher expected returns than large cap stocks.Book-to-Market (BtM)—lower-priced “value” (high BtM) stocks have higher expected returns than higher-priced “growth” stocks (low BtM). Two additional risk factors reflect compensated risk in the fixed income markets. These are: Maturity—longer-term bonds are riskier than shorter-term instruments.Credit—instruments of lower credit quality are riskier than instruments of higher credit quality. The credit premium only covers 1973-2012.The historical return premiums for these risk factors are documented in the graph. Equities have offered a higher expected return than fixed income, but these stronger premiums come with higher risk. Structuring a portfolio around compensated risk factors can change many aspects of the investment process. Rather than focusing on individual stock or bond selection, investors work to achieve diversified, controlled exposure to the risk factors that drive expected returns. An investor first determines his portfolio’s stock/bond mix, and then decides how much additional small cap and value to hold in pursuit of higher expected returns. The level of risk assumed in the fixed income component may depend on why an investor is holding fixed income. For example, an equity-driven investor who wants to reduce portfolio volatility may hold less risky debt instruments, while an investor pursuing higher yield or income may take more maturity and default risk.
This slide documents the frequency with which the value and size premiums have been positive over various time periods in the US stock market from 1926 to 2012. As the results illustrate, US value stocks have outperformed US growth stocks—and US small cap stocks have outperformed US large cap stocks—in a majority of all the rolling return periods measured. The US value premium has been positive more often than the size premium. The time periods, which range from five to twenty-five years, are based on annualized returns for rolling 12-month periods (e.g., January-December, February-January, March-February, etc.). The total number of 12-month periods for each time frame is indicated in the footnotes.
This slide documents the frequency with which the value premium, from 1975-2012, and the size premium, from 1970-2012, have been positive over various time periods in the international (non-US) developed stock markets. In the international markets, value stocks have outperformed growth stocks—and small cap stocks have outperformed large cap stocks—in a majority of all rolling return periods measured. The value premium has been strongly positive more often than the size premium. The time periods, which range from five to twenty-five years, are based on annualized returns for rolling 12-month periods (e.g., January-December, February-January, March-February, etc.). The total number of 12-month periods for each time frame is indicated in the footnotes. The set of available data for non-US developed markets is considerably shorter than US markets. As a result, the smaller set of observations can amplify the effect of sustained periods of negative or positive premiums. This may explain part of the frequency difference between the 20-year and 15-year periods for the international small cap premium.
The harsh reality of market efficiency has not stopped speculators and other traders from attempting to read the future. On paper, market timing offers a seductive prospect: By predicting market direction ahead of time, a trader might capture only the best-performing days and avoid the worst. This slide tells the other side of that story. Large gains may come in quick, unpredictable surges. A trader who misinterprets events may leave the market at the wrong time. Missing only a small fraction of days—especially the best days—can defeat a timer’s strategy.For example, since 1970, missing the best 25 trading days would have significantly cut S&P 500 Index annualized compound return.Trying to forecast which days or weeks will yield good or bad returns is a guessing game that can prove costly for investors.
This analysis offers further insight into the potential consequences of both successful and failed market timing. The graph plots the S&P 500’s annualized compound return since 1970. The orange bar (far left) shows what a buy-and-hold investor would have earned in annualized return for the entire period. The bars to the right show the incremental return impact if an investor had missed the best or worst day, month, quarter, or longer sequence during the period. For example, the worst market day since 1970 occurred on October 19, 1987. An investor who avoided the worst day would have earned a 10.49% annualized return, but missing the best day would have reduced the return to 9.66%.If daily market returns are random, market timing is a flip of the coin. Investors who attempt to predict market drops are just as likely to avoid them as to miss out on strong return periods.
Talking Points:This graph documents bull and bear market periods in the S&P 500 Index from January 1, 1926 through December 31, 2011. The market cycles are identified in hindsight using historical cumulative daily returns. All observations are performed after the fact. A bear market is identified in hindsight when the market experiences a negative daily return followed by a cumulative loss of at least 10%. The bear market ends at its low point, which is defined as the most negative cumulative return prior to achieving a positive cumulative return. A bull market is defined by data points not considered part of a bear market.The rising trend lines in blue designate the bull markets occurring since 1926, and the falling trend lines in red document the bear markets. The bars that frame the trend lines help to describe the length and intensity of the gains and losses. The numbers above or below the bars indicate the cumulative return percentage of the bull or bear market. Keep in mind that this graph does not show total compounded returns or growth of wealth since 1926. Once the cycle is established in retrospect, the first day of that cycle resets the performance baseline to zero. Investors may draw a number of lessons from this graph. First, since 1926, bull markets in the S&P 500 Index have lasted longer than bear markets and delivered price gains that are disproportionately greater than the bear market losses. Second, fluctuating performance within each trend illustrates that volatility and uncertainty occur even within established market cycles: bull markets may have short-term dips, and bear markets may have short-term advances. The immediate trend is not readily apparent to market observers, and in fact, may become clear only in hindsight. This illustrates the difficulty of accurately predicting and timing market cycles. Finally, the graph suggests the importance of maintaining a disciplined investment approach that views market events and trends from a long-term perspective. Investors who react emotionally to short-term movements are at risk of making ill-timed decisions that compromise long-term performance.
Talking Points:This graph documents bull and bear market periods in the S&P 500 Index from January 1926 through December 2011. The market cycles are identified in hindsight, applying the same methodology as the other slides in the “Bull and Bear Markets” series. The numbers above or below the bars indicate the duration (in months) and cumulative return percentage of the bull or bear market. Monthly index returns are total returns, which include reinvestment of dividends.
Talking Points:This graph documents bull and bear market periods in the Russell 2000 Index from January 1979 through December 2011. The market cycles are identified in hindsight, applying the same methodology as the other slides in the “Bull and Bear Markets” series. The numbers above or below the bars indicate the duration (in months) and cumulative return percentage of the bull or bear market. Monthly index returns are total returns, which include reinvestment of dividends.
Talking Points:This graph documents bull and bear market periods in the MSCI EAFE Index from January 1970 through December 2011. The market cycles are identified in hindsight using historical cumulative monthly returns. These returns consider the reinvestment of dividends, net of foreign government withholding taxes. All monthly observations are performed after the fact. A bear market is identified in hindsight when the market experiences a negative monthly return followed by a cumulative loss of at least 10%. The bear market ends at its low point, which is defined as the most negative cumulative return prior to achieving a positive cumulative return. A bull market is defined by data points not considered part of a bear market.The rising trend lines in blue designate the bull markets occurring since 1970, and the falling trend lines in red document the bear markets. The bars that frame the trend lines help to describe the length and intensity of the gains and losses. The numbers above or below the bars indicate the duration (in months) and cumulative return percentage of the bull or bear market. Keep in mind that this graph does not show total compounded returns or growth of wealth since 1970. Once the cycle is established in retrospect, the first month of that cycle resets the performance baseline to zero. Investors may draw a number of lessons from this graph. First, since 1970, bull markets in the MSCI EAFE Index have lasted longer than bear markets and delivered gains that are disproportionately greater than the bear market losses. Keep in mind, however, that this time series is relatively short.Second, fluctuating performance within each trend illustrates that volatility and uncertainty occur even within established market cycles: bull markets may have short-term dips, and bear markets may have short-term advances. The immediate trend is not readily apparent to market observers, and in fact, may become clear only in hindsight. This illustrates the difficulty of accurately predicting and timing market cycles. Finally, the graph suggests the importance of maintaining a disciplined investment approach that views market events and trends from a long-term perspective. Investors who react emotionally to short-term movements are at risk of making ill-timed decisions that compromise long-term performance.
Talking Points:This graph documents bull and bear market periods in the MSCI Emerging Markets Index from January 1988 through December 2011. The market cycles are identified in hindsight, applying the same methodology as the other slides in the “Bull and Bear Markets” series. The numbers above or below the bars indicate the duration (in months) and cumulative return percentage of the bull or bear market. Monthly index returns include the reinvestment of gross dividends. The graph demonstrates the same principles as the previous data:In the data since 1988, which is a relatively short time series, bull markets in the MSCI Emerging Markets Index have lasted longer than bear markets and delivered gains that are disproportionately greater than the bear market losses. Index performance fluctuates, even within established market cycles.Investors who maintain a disciplined investment approach may avoid making ill-timed decisions amidst the market volatility.
Talking Points:This graph shows that a few outperforming stocks may account for a disproportionately large share of the US market’s return in a given year. From 1926 to 2012, the US stock market, as measured by the CRSP 1-10 Index, provided a 9.6% compound average annual return. If the top-performing decile of stocks were excluded each year, the market’s return would drop to 6.3% annualized. Excluding the top quartile of performers each year would reduce the market’s average annual return to a negative 0.6%. Since it is impossible to reliably identify winners before the fact, the most prudent approach is to maintain broad diversification and consistent exposure within a particular asset class. This improves the likelihood that a portfolio will capture outperformance—wherever it may occur.