Download to read offline


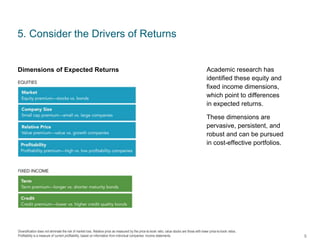
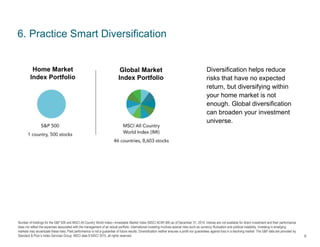
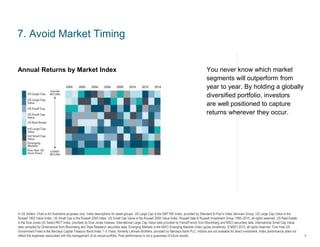
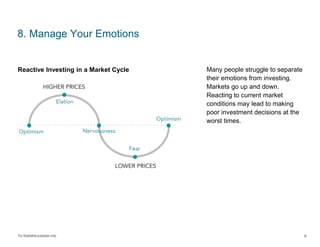

This document provides a summary of strategies for pursuing a better investment experience. It recommends embracing market pricing, not trying to outguess the market by stock picking, resisting chasing past performance, letting markets work for long-term investors, considering dimensions of expected returns like value and size, practicing smart diversification globally, avoiding market timing, managing emotions during market cycles, looking beyond headlines, and focusing on what can be controlled like working with a financial advisor.