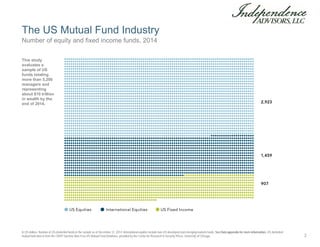
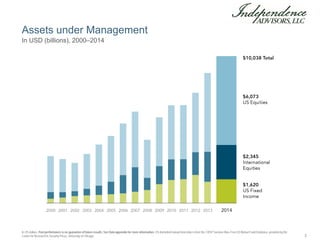
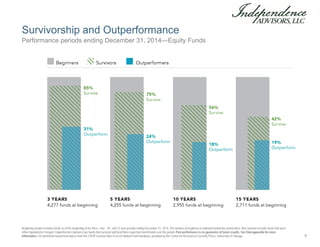
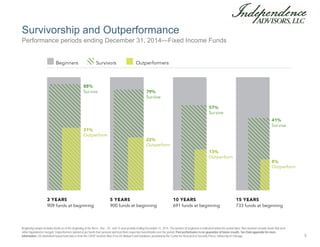
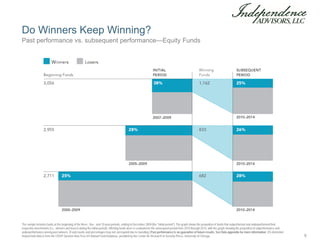
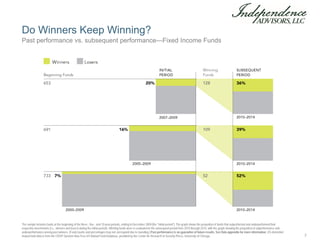
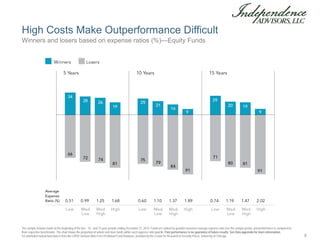
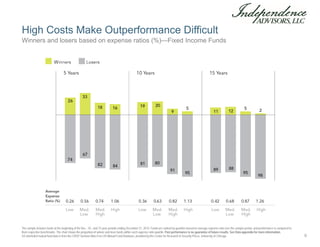
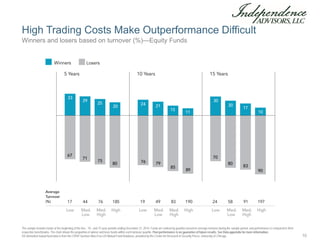
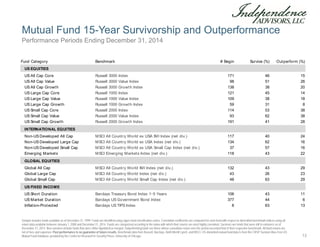
SlideShare a Scribd company logo
US Mutual Fund Performance Report
2015
The US Mutual Fund Industry
In US dollars. Number of US-domiciled funds in the sample as of December 31, 2014. International equities include non-US developed and emerging markets funds. See Data appendix for more information. US-domiciled
mutual fund data is from the CRSP Survivor-Bias-Free US Mutual Fund Database, provided by the Center for Research in Security Prices, University of Chicago.
Number of equity and fixed income funds, 2014
This study
evaluates a
sample of US
funds totaling
more than 5,200
managers and
representing
about $10 trillion
in wealth by the
end of 2014.
2
Assets under Management
In US dollars. Past performance is no guarantee of future results. See Data appendix for more information. US-domiciled mutual fund data is from the CRSP Survivor-Bias-Free US Mutual Fund Database, provided by the
Center for Research in Security Prices, University of Chicago.
In USD (billions), 2000–2014
3
Beginning sample includes funds as of the beginning of the three-, five-, 10-, and 15-year periods ending December 31, 2014. The number of beginners is indicated below the period label. Non-survivors include funds that were
either liquidated or merged. Outperformers (winners) are funds that survived and beat their respective benchmarks over the period. Past performance is no guarantee of future results. See Data appendix for more
information. US-domiciled mutual fund data is from the CRSP Survivor-Bias-Free US Mutual Fund Database, provided by the Center for Research in Security Prices, University of Chicago.
Survivorship and Outperformance
Performance periods ending December 31, 2014—Equity Funds
4
Beginning sample includes funds as of the beginning of the three-, five-, 10-, and 15-year periods ending December 31, 2014. The number of beginners is indicated below the period label. Non-survivors include funds that were
either liquidated or merged. Outperformers (winners) are funds that survived and beat their respective benchmarks over the period. Past performance is no guarantee of future results. See Data appendix for more
information. US-domiciled mutual fund data is from the CRSP Survivor-Bias-Free US Mutual Fund Database, provided by the Center for Research in Security Prices, University of Chicago.
Survivorship and Outperformance
Performance periods ending December 31, 2014—Fixed Income Funds
5
Do Winners Keep Winning?
The sample includes funds at the beginning of the three-, five-, and 10-year periods, ending in December 2009 (the "initial period"). The graph shows the proportion of funds that outperformed and underperformed their
respective benchmarks (i.e., winners and losers) during the initial periods. Winning funds were re-evaluated in the subsequent period from 2010 through 2014, with the graph showing the proportion of outperformance and
underperformance among past winners. (Fund counts and percentages may not correspond due to rounding.) Past performance is no guarantee of future results. See Data appendix for more information. US-domiciled
mutual fund data is from the CRSP Survivor-Bias-Free US Mutual Fund Database, provided by the Center for Research in Security Prices, University of Chicago.
Past performance vs. subsequent performance—Equity Funds
6
Do Winners Keep Winning?
The sample includes funds at the beginning of the three-, five-, and 10-year periods, ending in December 2009 (the "initial period"). The graph shows the proportion of funds that outperformed and underperformed their
respective benchmarks (i.e., winners and losers) during the initial periods. Winning funds were re-evaluated in the subsequent period from 2010 through 2014, with the graph showing the proportion of outperformance and
underperformance among past winners. (Fund counts and percentages may not correspond due to rounding.) Past performance is no guarantee of future results. See Data appendix for more information. US-domiciled
mutual fund data is from the CRSP Survivor-Bias-Free US Mutual Fund Database, provided by the Center for Research in Security Prices, University of Chicago.
Past performance vs. subsequent performance—Fixed Income Funds
7
High Costs Make Outperformance Difficult
The sample includes funds at the beginning of the five-, 10-, and 15-year periods ending December 31, 2014. Funds are ranked by quartiles based on average expense ratio over the sample period, and performance is compared to
their respective benchmarks. The chart shows the proportion of winner and loser funds within each expense ratio quartile. Past performance is no guarantee of future results. See Data appendix for more information.
US-domiciled mutual fund data is from the CRSP Survivor-Bias-Free US Mutual Fund Database, provided by the Center for Research in Security Prices, University of Chicago.
Winners and losers based on expense ratios (%)—Equity Funds
8
High Costs Make Outperformance Difficult
The sample includes funds at the beginning of the five-, 10-, and 15-year periods ending December 31, 2014. Funds are ranked by quartiles based on average expense ratio over the sample period, and performance is compared to
their respective benchmarks. The chart shows the proportion of winner and loser funds within each expense ratio quartile. Past performance is no guarantee of future results. See Data appendix for more information.
US-domiciled mutual fund data is from the CRSP Survivor-Bias-Free US Mutual Fund Database, provided by the Center for Research in Security Prices, University of Chicago.
Winners and losers based on expense ratios (%)—Fixed Income Funds
9
High Trading Costs Make Outperformance Difficult
The sample includes funds at the beginning of the five-, 10-, and 15-year periods ending December 31, 2014. Funds are ranked by quartiles based on average turnover during the sample period, and performance is compared to their
respective benchmarks. The chart shows the proportion of winner and loser funds within each turnover quartile. Past performance is no guarantee of future results. See Data appendix for more information.
US-domiciled mutual fund data is from the CRSP Survivor-Bias-Free US Mutual Fund Database, provided by the Center for Research in Security Prices, University of Chicago.
Winners and losers based on turnover (%)—Equity Funds
10
Report Summary
Past performance is no guarantee of future results.
Findings
• Most mutual funds underperformed their benchmarks.
• Strong track records failed to persist.
• High costs and excessive turnover may have contributed
to underperformance.
Lessons
• The market does a good job of pricing securities, making it difficult for
managers to outperform by trying to outguess other participants.
• Managers in search of mispricing face high cost barriers as they
try to beat the market.
• Successful fund investing involves more than picking past winners.
• Consider a fund’s market philosophy, investment objectives,
strategy, trading costs, and other factors.
The mutual fund landscape
11
Data Appendix
US-domiciled mutual fund data is from the CRSP Survivor-Bias-Free US Mutual Fund Database, provided by the Center for Research in Security
Prices, University of Chicago.
Certain types of equity and fixed income funds were excluded from the performance study. For equities, sector funds and funds with a narrow
investment focus, such as real estate and gold, were excluded. Money market funds, municipal bond funds, and asset-backed security funds were
excluded from fixed income.
Funds are identified using Lipper fund classification codes. Correlation coefficients are computed for each fund with respect to diversified benchmark
indices using all return data available between January 1, 2000, and December 31, 2014. The index most highly correlated with a fund is assigned as
its benchmark. Winner funds are those whose cumulative return over the period exceeded that of their respective benchmark. Loser funds are funds
that did not survive the period or whose cumulative return did not exceed their respective benchmark.
Expense ratio ranges: The ranges of expense ratios for equity funds over the five-, 10-, and 15-year periods are 0.01% to 4.89%, 0.01% to 4.53%,
and 0.04% to 4.83%, respectively. For fixed income funds, ranges over the same periods are 0.01% to 2.78%, 0.05% to 2.55%, and 0.03% to 3.66%,
respectively.
Portfolio turnover ranges: Ranges for equity fund turnover over the five-, 10-, and 15-year periods are 1.0% to 1,499.4%, 1% to 1,524.0%, and 2.0%
to 2,400.4%, respectively.
Benchmark data provided by Barclays, MSCI, Russell, Citigroup, BofA Merrill Lynch, and S&P. Barclays data provided by Barclays Bank PLC. MSCI
data © MSCI 2015, all rights reserved. Russell data © Russell Investment Group 1995−2015, all rights reserved. Citigroup bond indices © 2015 by
Citigroup. The BofA Merrill Lynch index is used with permission; © 2015 Merrill Lynch, Pierce, Fenner & Smith Incorporated; all rights reserved.
Merrill Lynch, Pierce, Fenner & Smith Incorporated is a wholly owned subsidiary of Bank of America Corporation. The S&P data is provided by
Standard & Poor’s Index Services Group.
Benchmark indices are not available for direct investment. Their performance does not reflect the expenses associated with the management of an
actual portfolio.
Mutual fund investment values will fluctuate, and shares, when redeemed, may be worth more or less than original cost. Diversification
neither assures a profit nor guarantees against a loss in a declining market. There is no guarantee investment strategies will be
successful.
Past performance is no guarantee of future results.
12
Mutual Fund 15-Year Survivorship and Outperformance
Sample includes funds available as of December 31, 1999. Funds are identified using Lipper fund classification codes. Correlation coefficients are computed for each fund with respect to diversified benchmark indices using all
return data available between January 1, 2000 and December 31, 2014. Funds are categorized according to the index with which their returns are most highly correlated. Survivors are funds that were still in existence as of
December 31, 2014. Non-survivors include funds that were either liquidated or merged. Outperforming funds are those whose cumulative return over the period exceeded that of their respective benchmark. All fund returns are
net of fees and expenses. Past performance is no guarantee of future results. Benchmark data from Russell, Barclays, BofA Merrill Lynch, and MSCI. US-domiciled mutual fund data is from the CRSP Survivor-Bias-Free US
Mutual Fund Database, provided by the Center for Research in Security Prices, University of Chicago.
Performance Periods Ending December 31, 2014
Fund Category Benchmark # Begin Survive (%) Outperform (%)
US EQUITIES
US All Cap Core Russell 3000 Index 171 46 15
US All Cap Value Russell 3000 Value Index 98 51 26
US All Cap Growth Russell 3000 Growth Index 138 38 20
US Large Cap Core Russell 1000 Index 121 45 14
US Large Cap Value Russell 1000 Value Index 109 38 18
US Large Cap Growth Russell 1000 Growth Index 59 31 8
US Small Cap Core Russell 2000 Index 114 53 38
US Small Cap Value Russell 2000 Value Index 93 62 38
US Small Cap Growth Russell 2000 Growth Index 191 41 28
INTERNATIONAL EQUITIES
Non-US Developed All Cap MSCI All Country World ex USA IMI Index (net div.) 117 40 24
Non-US Developed Large Cap MSCI All Country World ex USA Index (net div.) 134 62 16
Non-US Developed Small Cap MSCI All Country World ex USA Small Cap Index (net div.) 37 57 16
Emerging Markets MSCI Emerging Markets Index (net div.) 118 43 22
GLOBAL EQUITIES
Global All Cap MSCI All Country World IMI Index (net div.) 132 43 29
Global Large Cap MSCI All Country World Index (net div.) 43 26 23
Global Small Cap MSCI All Country World Small Cap Index (net div.) 48 63 29
US FIXED INCOME
US Short Duration Barclays Treasury Bond Index 1−5 Years 106 43 11
US Market Duration Barclays US Government Bond Index 377 44 6
Inflation-Protected Barclays US TIPS Index 8 63 13
13

More Related Content

What's hot

Comparision of investment in mutual fund and equity
Comparision of  investment in mutual fund and equityComparision of  investment in mutual fund and equity
Comparision of investment in mutual fund and equityParitosh Singh
 
My research report on sectoral performance evaluation of mutual funds
My research report on sectoral performance evaluation of mutual fundsMy research report on sectoral performance evaluation of mutual funds
My research report on sectoral performance evaluation of mutual funds
Abhishek Kumar
 
A study on selection behavior of investor in mutual fund with reference to ju...
A study on selection behavior of investor in mutual fund with reference to ju...A study on selection behavior of investor in mutual fund with reference to ju...
A study on selection behavior of investor in mutual fund with reference to ju...
Kailash Naghera
 
Study of Investor Perception towards Mutual Funds
Study of Investor Perception towards Mutual FundsStudy of Investor Perception towards Mutual Funds
Study of Investor Perception towards Mutual Funds
MeghnaJaiswal6
 
Mutual fund
Mutual fundMutual fund
Mutual fund
praveen singh
 
193243335 study-of-hdfc-mutual-fund
193243335 study-of-hdfc-mutual-fund193243335 study-of-hdfc-mutual-fund
193243335 study-of-hdfc-mutual-fund
homeworkping3
 
Mars booklet
Mars bookletMars booklet
Mars booklet
Sanjoy Banerjee
 
Hdfc mutual fund
Hdfc mutual fundHdfc mutual fund
Hdfc mutual fundamit88yadav
 
A study on performance evaluation of equity shares & mutual funds
A study on performance evaluation of equity shares & mutual fundsA study on performance evaluation of equity shares & mutual funds
A study on performance evaluation of equity shares & mutual funds
Projects Kart
 
A comparative study on investing in equity and mutual fund schemes
A comparative study on investing in equity and mutual fund schemesA comparative study on investing in equity and mutual fund schemes
A comparative study on investing in equity and mutual fund schemesAsif Hussain Shaikh
 
Analysis and explanation of various investment options in India
Analysis and explanation of various investment options in IndiaAnalysis and explanation of various investment options in India
Analysis and explanation of various investment options in India
umang22
 
Comparative study of investment in equity capital
Comparative study of investment in equity capital Comparative study of investment in equity capital
Comparative study of investment in equity capital
Shri Shakti
 
12853150 comparative-analysis-of-mutual-funds
12853150 comparative-analysis-of-mutual-funds12853150 comparative-analysis-of-mutual-funds
12853150 comparative-analysis-of-mutual-funds
richa sinha
 
A project report on performance evaluation of sectoral mutual fund
A project report on performance evaluation of sectoral mutual fundA project report on performance evaluation of sectoral mutual fund
A project report on performance evaluation of sectoral mutual fundsachindholakiya
 
A comparative study on direct equity investing and mutual fund investing
A comparative study on direct equity investing and mutual fund investingA comparative study on direct equity investing and mutual fund investing
A comparative study on direct equity investing and mutual fund investing
Akash Jeevan
 
A STUDY ON INVESTOR PERCEPTION TOWARDS MUTUAL FUNDS WITH RESPECT TO AGARTALA,...
A STUDY ON INVESTOR PERCEPTION TOWARDS MUTUAL FUNDS WITH RESPECT TO AGARTALA,...A STUDY ON INVESTOR PERCEPTION TOWARDS MUTUAL FUNDS WITH RESPECT TO AGARTALA,...
A STUDY ON INVESTOR PERCEPTION TOWARDS MUTUAL FUNDS WITH RESPECT TO AGARTALA,...
Koushik Sarkar
 
Review paper on investment in mutual fund through systematic investment plan
Review paper on investment in mutual fund through systematic investment planReview paper on investment in mutual fund through systematic investment plan
Review paper on investment in mutual fund through systematic investment plan
Abhishek Shrivastava
 
EVALUATING PERCEPTION OF INVESTORS TOWARDS MUTUAL FUNDS & PERFORMANCE OF THE ...
EVALUATING PERCEPTION OF INVESTORS TOWARDS MUTUAL FUNDS & PERFORMANCE OF THE ...EVALUATING PERCEPTION OF INVESTORS TOWARDS MUTUAL FUNDS & PERFORMANCE OF THE ...
EVALUATING PERCEPTION OF INVESTORS TOWARDS MUTUAL FUNDS & PERFORMANCE OF THE ...
Nishant Kumar
 
Analytical Study of SBI Mutual Fund By Sachin Kakde
Analytical Study of SBI Mutual Fund  By   Sachin KakdeAnalytical Study of SBI Mutual Fund  By   Sachin Kakde
Analytical Study of SBI Mutual Fund By Sachin KakdeSachin Kakde
 

What's hot (20)

Comparision of investment in mutual fund and equity
Comparision of  investment in mutual fund and equityComparision of  investment in mutual fund and equity
Comparision of investment in mutual fund and equity
 
My research report on sectoral performance evaluation of mutual funds
My research report on sectoral performance evaluation of mutual fundsMy research report on sectoral performance evaluation of mutual funds
My research report on sectoral performance evaluation of mutual funds
 
A study on selection behavior of investor in mutual fund with reference to ju...
A study on selection behavior of investor in mutual fund with reference to ju...A study on selection behavior of investor in mutual fund with reference to ju...
A study on selection behavior of investor in mutual fund with reference to ju...
 
Study of Investor Perception towards Mutual Funds
Study of Investor Perception towards Mutual FundsStudy of Investor Perception towards Mutual Funds
Study of Investor Perception towards Mutual Funds
 
Mutual fund
Mutual fundMutual fund
Mutual fund
 
193243335 study-of-hdfc-mutual-fund
193243335 study-of-hdfc-mutual-fund193243335 study-of-hdfc-mutual-fund
193243335 study-of-hdfc-mutual-fund
 
Mars booklet
Mars bookletMars booklet
Mars booklet
 
Hdfc mutual fund
Hdfc mutual fundHdfc mutual fund
Hdfc mutual fund
 
A study on performance evaluation of equity shares & mutual funds
A study on performance evaluation of equity shares & mutual fundsA study on performance evaluation of equity shares & mutual funds
A study on performance evaluation of equity shares & mutual funds
 
A comparative study on investing in equity and mutual fund schemes
A comparative study on investing in equity and mutual fund schemesA comparative study on investing in equity and mutual fund schemes
A comparative study on investing in equity and mutual fund schemes
 
Analysis and explanation of various investment options in India
Analysis and explanation of various investment options in IndiaAnalysis and explanation of various investment options in India
Analysis and explanation of various investment options in India
 
Comparative study of investment in equity capital
Comparative study of investment in equity capital Comparative study of investment in equity capital
Comparative study of investment in equity capital
 
12853150 comparative-analysis-of-mutual-funds
12853150 comparative-analysis-of-mutual-funds12853150 comparative-analysis-of-mutual-funds
12853150 comparative-analysis-of-mutual-funds
 
A project report on performance evaluation of sectoral mutual fund
A project report on performance evaluation of sectoral mutual fundA project report on performance evaluation of sectoral mutual fund
A project report on performance evaluation of sectoral mutual fund
 
A comparative study on direct equity investing and mutual fund investing
A comparative study on direct equity investing and mutual fund investingA comparative study on direct equity investing and mutual fund investing
A comparative study on direct equity investing and mutual fund investing
 
A STUDY ON INVESTOR PERCEPTION TOWARDS MUTUAL FUNDS WITH RESPECT TO AGARTALA,...
A STUDY ON INVESTOR PERCEPTION TOWARDS MUTUAL FUNDS WITH RESPECT TO AGARTALA,...A STUDY ON INVESTOR PERCEPTION TOWARDS MUTUAL FUNDS WITH RESPECT TO AGARTALA,...
A STUDY ON INVESTOR PERCEPTION TOWARDS MUTUAL FUNDS WITH RESPECT TO AGARTALA,...
 
Review paper on investment in mutual fund through systematic investment plan
Review paper on investment in mutual fund through systematic investment planReview paper on investment in mutual fund through systematic investment plan
Review paper on investment in mutual fund through systematic investment plan
 
EVALUATING PERCEPTION OF INVESTORS TOWARDS MUTUAL FUNDS & PERFORMANCE OF THE ...
EVALUATING PERCEPTION OF INVESTORS TOWARDS MUTUAL FUNDS & PERFORMANCE OF THE ...EVALUATING PERCEPTION OF INVESTORS TOWARDS MUTUAL FUNDS & PERFORMANCE OF THE ...
EVALUATING PERCEPTION OF INVESTORS TOWARDS MUTUAL FUNDS & PERFORMANCE OF THE ...
 
project ppt
project pptproject ppt
project ppt
 
Analytical Study of SBI Mutual Fund By Sachin Kakde
Analytical Study of SBI Mutual Fund  By   Sachin KakdeAnalytical Study of SBI Mutual Fund  By   Sachin Kakde
Analytical Study of SBI Mutual Fund By Sachin Kakde
 

Viewers also liked

DAMPAK HP BAGI PELAJAR SMP
DAMPAK HP BAGI PELAJAR SMPDAMPAK HP BAGI PELAJAR SMP
DAMPAK HP BAGI PELAJAR SMP
HERMADI
 
圖解製作範例 / 商業簡報網-韓明文講師
圖解製作範例 / 商業簡報網-韓明文講師圖解製作範例 / 商業簡報網-韓明文講師
圖解製作範例 / 商業簡報網-韓明文講師
明文 韓
 
Presentation on Mutual Fund
Presentation on Mutual FundPresentation on Mutual Fund
Presentation on Mutual Fund
Amar Ranu
 
Mutual Funds, Mutual Fund Basics, Types of Mutual Funds, Mutual Fund Investm...
Mutual Funds, Mutual Fund Basics, Types of Mutual Funds,  Mutual Fund Investm...Mutual Funds, Mutual Fund Basics, Types of Mutual Funds,  Mutual Fund Investm...
Mutual Funds, Mutual Fund Basics, Types of Mutual Funds, Mutual Fund Investm...
SaraCooper161
 
Mutual funds
Mutual fundsMutual funds
Mutual funds
Sweetp999
 
Presentation On Mutual funds and its types
Presentation On Mutual funds and its typesPresentation On Mutual funds and its types
Presentation On Mutual funds and its types
Gurmeet Virk
 
Mutual funds
Mutual fundsMutual funds
Mutual funds
Manish TaYlor
 
Mutual fund ppt
Mutual fund pptMutual fund ppt
Mutual fund ppt
Priyanka Bachkaniwala
 

Viewers also liked (10)

DAMPAK HP BAGI PELAJAR SMP
DAMPAK HP BAGI PELAJAR SMPDAMPAK HP BAGI PELAJAR SMP
DAMPAK HP BAGI PELAJAR SMP
 
圖解製作範例 / 商業簡報網-韓明文講師
圖解製作範例 / 商業簡報網-韓明文講師圖解製作範例 / 商業簡報網-韓明文講師
圖解製作範例 / 商業簡報網-韓明文講師
 
Presentation on Mutual Fund
Presentation on Mutual FundPresentation on Mutual Fund
Presentation on Mutual Fund
 
Mutual Funds, Mutual Fund Basics, Types of Mutual Funds, Mutual Fund Investm...
Mutual Funds, Mutual Fund Basics, Types of Mutual Funds,  Mutual Fund Investm...Mutual Funds, Mutual Fund Basics, Types of Mutual Funds,  Mutual Fund Investm...
Mutual Funds, Mutual Fund Basics, Types of Mutual Funds, Mutual Fund Investm...
 
Mutual fund-ppt
Mutual fund-pptMutual fund-ppt
Mutual fund-ppt
 
Mutual funds ppt
Mutual funds pptMutual funds ppt
Mutual funds ppt
 
Mutual funds
Mutual fundsMutual funds
Mutual funds
 
Presentation On Mutual funds and its types
Presentation On Mutual funds and its typesPresentation On Mutual funds and its types
Presentation On Mutual funds and its types
 
Mutual funds
Mutual fundsMutual funds
Mutual funds
 
Mutual fund ppt
Mutual fund pptMutual fund ppt
Mutual fund ppt
 

Similar to Mutual Fund Performance Report 2015

2015-12-03 Personal Finance: Take Back Control
2015-12-03 Personal Finance: Take Back Control2015-12-03 Personal Finance: Take Back Control
2015-12-03 Personal Finance: Take Back Control
Raffa Learning Community
 
Stop Wasting Your Money & Start Having a Better Investment Experience
Stop Wasting Your Money & Start Having a Better Investment ExperienceStop Wasting Your Money & Start Having a Better Investment Experience
Stop Wasting Your Money & Start Having a Better Investment Experience
Andreas Scott, CFP®
 
Pursuing_a_Better_Investment_Experience_Slides
Pursuing_a_Better_Investment_Experience_SlidesPursuing_a_Better_Investment_Experience_Slides
Pursuing_a_Better_Investment_Experience_SlidesEddy Mejlholm
 
DHGWA Brochure 2015 Portrait
DHGWA Brochure 2015 PortraitDHGWA Brochure 2015 Portrait
DHGWA Brochure 2015 PortraitEllen Lindh
 
Abacus Weath Partners Investment slideshow
Abacus Weath Partners Investment slideshowAbacus Weath Partners Investment slideshow
Abacus Weath Partners Investment slideshow
Abacus Wealth Partners
 
Pursuing a Better Investment Experience Brochure Branded
Pursuing a Better Investment Experience Brochure BrandedPursuing a Better Investment Experience Brochure Branded
Pursuing a Better Investment Experience Brochure BrandedTheresa M. Mahoney
 
Rethink The Way You Invest
Rethink The Way You InvestRethink The Way You Invest
Rethink The Way You Investpolariswuser
 
EA - Core Beliefs Presentation_EA Core Factor Factor Plus
EA - Core Beliefs Presentation_EA Core Factor  Factor PlusEA - Core Beliefs Presentation_EA Core Factor  Factor Plus
EA - Core Beliefs Presentation_EA Core Factor Factor PlusJohn Schmick
 
A Better Investment Experience
A Better Investment ExperienceA Better Investment Experience
A Better Investment Experience
Michael J. Evans
 
Cornerstone foundations of sensible investing
Cornerstone foundations of sensible investingCornerstone foundations of sensible investing
Cornerstone foundations of sensible investing
RobUgiansky
 
Pursuing a Better Investment Experience with Capital Associates
Pursuing a Better Investment Experience with Capital AssociatesPursuing a Better Investment Experience with Capital Associates
Pursuing a Better Investment Experience with Capital Associates
RobUgiansky
 
2010 Investment Outlook
2010 Investment Outlook2010 Investment Outlook
2010 Investment Outlook
Patrick Collins
 
[LATAM EN] Convertible bonds offer investors equity-like returns with a risk ...
[LATAM EN] Convertible bonds offer investors equity-like returns with a risk ...[LATAM EN] Convertible bonds offer investors equity-like returns with a risk ...
[LATAM EN] Convertible bonds offer investors equity-like returns with a risk ...
NN Investment Partners
 
[EN] Convertible bonds offer investors equity-like returns with a risk profil...
[EN] Convertible bonds offer investors equity-like returns with a risk profil...[EN] Convertible bonds offer investors equity-like returns with a risk profil...
[EN] Convertible bonds offer investors equity-like returns with a risk profil...
NN Investment Partners
 
[CH] Convertible bonds offer investors equity-like returns with a risk profil...
[CH] Convertible bonds offer investors equity-like returns with a risk profil...[CH] Convertible bonds offer investors equity-like returns with a risk profil...
[CH] Convertible bonds offer investors equity-like returns with a risk profil...
NN Investment Partners
 
[LU] Focuspoint / Convertible bonds offer investors equity-like returns with ...
[LU] Focuspoint / Convertible bonds offer investors equity-like returns with ...[LU] Focuspoint / Convertible bonds offer investors equity-like returns with ...
[LU] Focuspoint / Convertible bonds offer investors equity-like returns with ...
NN Investment Partners
 
[UK] Convertible bonds offer investors equity-like returns with a risk profil...
[UK] Convertible bonds offer investors equity-like returns with a risk profil...[UK] Convertible bonds offer investors equity-like returns with a risk profil...
[UK] Convertible bonds offer investors equity-like returns with a risk profil...
NN Investment Partners
 
[JP] Convertible bonds offer investors equity-like returns with a risk profil...
[JP] Convertible bonds offer investors equity-like returns with a risk profil...[JP] Convertible bonds offer investors equity-like returns with a risk profil...
[JP] Convertible bonds offer investors equity-like returns with a risk profil...
NN Investment Partners
 
2013 Callan Cost of Doing Business Survey: U.S. Funds and Trusts
2013 Callan Cost of Doing Business Survey: U.S. Funds and Trusts2013 Callan Cost of Doing Business Survey: U.S. Funds and Trusts
2013 Callan Cost of Doing Business Survey: U.S. Funds and Trusts
Callan
 

Similar to Mutual Fund Performance Report 2015 (20)

2015-12-03 Personal Finance: Take Back Control
2015-12-03 Personal Finance: Take Back Control2015-12-03 Personal Finance: Take Back Control
2015-12-03 Personal Finance: Take Back Control
 
Stop Wasting Your Money & Start Having a Better Investment Experience
Stop Wasting Your Money & Start Having a Better Investment ExperienceStop Wasting Your Money & Start Having a Better Investment Experience
Stop Wasting Your Money & Start Having a Better Investment Experience
 
Pursuing_a_Better_Investment_Experience_Slides
Pursuing_a_Better_Investment_Experience_SlidesPursuing_a_Better_Investment_Experience_Slides
Pursuing_a_Better_Investment_Experience_Slides
 
DHGWA Brochure 2015 Portrait
DHGWA Brochure 2015 PortraitDHGWA Brochure 2015 Portrait
DHGWA Brochure 2015 Portrait
 
Pursuing a Better Investment Experience
Pursuing a Better Investment ExperiencePursuing a Better Investment Experience
Pursuing a Better Investment Experience
 
Abacus Weath Partners Investment slideshow
Abacus Weath Partners Investment slideshowAbacus Weath Partners Investment slideshow
Abacus Weath Partners Investment slideshow
 
Pursuing a Better Investment Experience Brochure Branded
Pursuing a Better Investment Experience Brochure BrandedPursuing a Better Investment Experience Brochure Branded
Pursuing a Better Investment Experience Brochure Branded
 
Rethink The Way You Invest
Rethink The Way You InvestRethink The Way You Invest
Rethink The Way You Invest
 
EA - Core Beliefs Presentation_EA Core Factor Factor Plus
EA - Core Beliefs Presentation_EA Core Factor  Factor PlusEA - Core Beliefs Presentation_EA Core Factor  Factor Plus
EA - Core Beliefs Presentation_EA Core Factor Factor Plus
 
A Better Investment Experience
A Better Investment ExperienceA Better Investment Experience
A Better Investment Experience
 
Cornerstone foundations of sensible investing
Cornerstone foundations of sensible investingCornerstone foundations of sensible investing
Cornerstone foundations of sensible investing
 
Pursuing a Better Investment Experience with Capital Associates
Pursuing a Better Investment Experience with Capital AssociatesPursuing a Better Investment Experience with Capital Associates
Pursuing a Better Investment Experience with Capital Associates
 
2010 Investment Outlook
2010 Investment Outlook2010 Investment Outlook
2010 Investment Outlook
 
[LATAM EN] Convertible bonds offer investors equity-like returns with a risk ...
[LATAM EN] Convertible bonds offer investors equity-like returns with a risk ...[LATAM EN] Convertible bonds offer investors equity-like returns with a risk ...
[LATAM EN] Convertible bonds offer investors equity-like returns with a risk ...
 
[EN] Convertible bonds offer investors equity-like returns with a risk profil...
[EN] Convertible bonds offer investors equity-like returns with a risk profil...[EN] Convertible bonds offer investors equity-like returns with a risk profil...
[EN] Convertible bonds offer investors equity-like returns with a risk profil...
 
[CH] Convertible bonds offer investors equity-like returns with a risk profil...
[CH] Convertible bonds offer investors equity-like returns with a risk profil...[CH] Convertible bonds offer investors equity-like returns with a risk profil...
[CH] Convertible bonds offer investors equity-like returns with a risk profil...
 
[LU] Focuspoint / Convertible bonds offer investors equity-like returns with ...
[LU] Focuspoint / Convertible bonds offer investors equity-like returns with ...[LU] Focuspoint / Convertible bonds offer investors equity-like returns with ...
[LU] Focuspoint / Convertible bonds offer investors equity-like returns with ...
 
[UK] Convertible bonds offer investors equity-like returns with a risk profil...
[UK] Convertible bonds offer investors equity-like returns with a risk profil...[UK] Convertible bonds offer investors equity-like returns with a risk profil...
[UK] Convertible bonds offer investors equity-like returns with a risk profil...
 
[JP] Convertible bonds offer investors equity-like returns with a risk profil...
[JP] Convertible bonds offer investors equity-like returns with a risk profil...[JP] Convertible bonds offer investors equity-like returns with a risk profil...
[JP] Convertible bonds offer investors equity-like returns with a risk profil...
 
2013 Callan Cost of Doing Business Survey: U.S. Funds and Trusts
2013 Callan Cost of Doing Business Survey: U.S. Funds and Trusts2013 Callan Cost of Doing Business Survey: U.S. Funds and Trusts
2013 Callan Cost of Doing Business Survey: U.S. Funds and Trusts
 

Recently uploaded

-- June 2024 is National Volunteer Month --
-- June 2024 is National Volunteer Month ---- June 2024 is National Volunteer Month --
-- June 2024 is National Volunteer Month --
NZSG
 
Kseniya Leshchenko: Shared development support service model as the way to ma...
Kseniya Leshchenko: Shared development support service model as the way to ma...Kseniya Leshchenko: Shared development support service model as the way to ma...
Kseniya Leshchenko: Shared development support service model as the way to ma...
Lviv Startup Club
 
Premium MEAN Stack Development Solutions for Modern Businesses
Premium MEAN Stack Development Solutions for Modern BusinessesPremium MEAN Stack Development Solutions for Modern Businesses
Premium MEAN Stack Development Solutions for Modern Businesses
SynapseIndia
 
Evgen Osmak: Methods of key project parameters estimation: from the shaman-in...
Evgen Osmak: Methods of key project parameters estimation: from the shaman-in...Evgen Osmak: Methods of key project parameters estimation: from the shaman-in...
Evgen Osmak: Methods of key project parameters estimation: from the shaman-in...
Lviv Startup Club
 
amptalk_RecruitingDeck_english_2024.06.05
amptalk_RecruitingDeck_english_2024.06.05amptalk_RecruitingDeck_english_2024.06.05
amptalk_RecruitingDeck_english_2024.06.05
marketing317746
 
CADAVER AS OUR FIRST TEACHER anatomt in your.pptx
CADAVER AS OUR FIRST TEACHER anatomt in your.pptxCADAVER AS OUR FIRST TEACHER anatomt in your.pptx
CADAVER AS OUR FIRST TEACHER anatomt in your.pptx
fakeloginn69
 
VAT Registration Outlined In UAE: Benefits and Requirements
VAT Registration Outlined In UAE: Benefits and RequirementsVAT Registration Outlined In UAE: Benefits and Requirements
VAT Registration Outlined In UAE: Benefits and Requirements
uae taxgpt
 
Set off and carry forward of losses and assessment of individuals.pptx
Set off and carry forward of losses and assessment of individuals.pptxSet off and carry forward of losses and assessment of individuals.pptx
Set off and carry forward of losses and assessment of individuals.pptx
HARSHITHV26
 
Bài tập - Tiếng anh 11 Global Success UNIT 1 - Bản HS.doc
Bài tập - Tiếng anh 11 Global Success UNIT 1 - Bản HS.docBài tập - Tiếng anh 11 Global Success UNIT 1 - Bản HS.doc
Bài tập - Tiếng anh 11 Global Success UNIT 1 - Bản HS.doc
daothibichhang1
 
ModelingMarketingStrategiesMKS.CollumbiaUniversitypdf
ModelingMarketingStrategiesMKS.CollumbiaUniversitypdfModelingMarketingStrategiesMKS.CollumbiaUniversitypdf
ModelingMarketingStrategiesMKS.CollumbiaUniversitypdf
fisherameliaisabella
 
Introduction to Amazon company 111111111111
Introduction to Amazon company 111111111111Introduction to Amazon company 111111111111
Introduction to Amazon company 111111111111
zoyaansari11365
 
The Influence of Marketing Strategy and Market Competition on Business Perfor...
The Influence of Marketing Strategy and Market Competition on Business Perfor...The Influence of Marketing Strategy and Market Competition on Business Perfor...
The Influence of Marketing Strategy and Market Competition on Business Perfor...
Adam Smith
 
Cracking the Workplace Discipline Code Main.pptx
Cracking the Workplace Discipline Code Main.pptxCracking the Workplace Discipline Code Main.pptx
Cracking the Workplace Discipline Code Main.pptx
Workforce Group
 
Creative Web Design Company in Singapore
Creative Web Design Company in SingaporeCreative Web Design Company in Singapore
Creative Web Design Company in Singapore
techboxsqauremedia
 
Cree_Rey_BrandIdentityKit.PDF_PersonalBd
Cree_Rey_BrandIdentityKit.PDF_PersonalBdCree_Rey_BrandIdentityKit.PDF_PersonalBd
Cree_Rey_BrandIdentityKit.PDF_PersonalBd
creerey
 
RMD24 | Debunking the non-endemic revenue myth Marvin Vacquier Droop | First ...
RMD24 | Debunking the non-endemic revenue myth Marvin Vacquier Droop | First ...RMD24 | Debunking the non-endemic revenue myth Marvin Vacquier Droop | First ...
RMD24 | Debunking the non-endemic revenue myth Marvin Vacquier Droop | First ...
BBPMedia1
 
What is the TDS Return Filing Due Date for FY 2024-25.pdf
What is the TDS Return Filing Due Date for FY 2024-25.pdfWhat is the TDS Return Filing Due Date for FY 2024-25.pdf
What is the TDS Return Filing Due Date for FY 2024-25.pdf
seoforlegalpillers
 
Sustainability: Balancing the Environment, Equity & Economy
Sustainability: Balancing the Environment, Equity & EconomySustainability: Balancing the Environment, Equity & Economy
Sustainability: Balancing the Environment, Equity & Economy
Operational Excellence Consulting
 
Enterprise Excellence is Inclusive Excellence.pdf
Enterprise Excellence is Inclusive Excellence.pdfEnterprise Excellence is Inclusive Excellence.pdf
Enterprise Excellence is Inclusive Excellence.pdf
KaiNexus
 
Exploring Patterns of Connection with Social Dreaming
Exploring Patterns of Connection with Social DreamingExploring Patterns of Connection with Social Dreaming
Exploring Patterns of Connection with Social Dreaming
Nicola Wreford-Howard
 

Recently uploaded (20)

-- June 2024 is National Volunteer Month --
-- June 2024 is National Volunteer Month ---- June 2024 is National Volunteer Month --
-- June 2024 is National Volunteer Month --
 
Kseniya Leshchenko: Shared development support service model as the way to ma...
Kseniya Leshchenko: Shared development support service model as the way to ma...Kseniya Leshchenko: Shared development support service model as the way to ma...
Kseniya Leshchenko: Shared development support service model as the way to ma...
 
Premium MEAN Stack Development Solutions for Modern Businesses
Premium MEAN Stack Development Solutions for Modern BusinessesPremium MEAN Stack Development Solutions for Modern Businesses
Premium MEAN Stack Development Solutions for Modern Businesses
 
Evgen Osmak: Methods of key project parameters estimation: from the shaman-in...
Evgen Osmak: Methods of key project parameters estimation: from the shaman-in...Evgen Osmak: Methods of key project parameters estimation: from the shaman-in...
Evgen Osmak: Methods of key project parameters estimation: from the shaman-in...
 
amptalk_RecruitingDeck_english_2024.06.05
amptalk_RecruitingDeck_english_2024.06.05amptalk_RecruitingDeck_english_2024.06.05
amptalk_RecruitingDeck_english_2024.06.05
 
CADAVER AS OUR FIRST TEACHER anatomt in your.pptx
CADAVER AS OUR FIRST TEACHER anatomt in your.pptxCADAVER AS OUR FIRST TEACHER anatomt in your.pptx
CADAVER AS OUR FIRST TEACHER anatomt in your.pptx
 
VAT Registration Outlined In UAE: Benefits and Requirements
VAT Registration Outlined In UAE: Benefits and RequirementsVAT Registration Outlined In UAE: Benefits and Requirements
VAT Registration Outlined In UAE: Benefits and Requirements
 
Set off and carry forward of losses and assessment of individuals.pptx
Set off and carry forward of losses and assessment of individuals.pptxSet off and carry forward of losses and assessment of individuals.pptx
Set off and carry forward of losses and assessment of individuals.pptx
 
Bài tập - Tiếng anh 11 Global Success UNIT 1 - Bản HS.doc
Bài tập - Tiếng anh 11 Global Success UNIT 1 - Bản HS.docBài tập - Tiếng anh 11 Global Success UNIT 1 - Bản HS.doc
Bài tập - Tiếng anh 11 Global Success UNIT 1 - Bản HS.doc
 
ModelingMarketingStrategiesMKS.CollumbiaUniversitypdf
ModelingMarketingStrategiesMKS.CollumbiaUniversitypdfModelingMarketingStrategiesMKS.CollumbiaUniversitypdf
ModelingMarketingStrategiesMKS.CollumbiaUniversitypdf
 
Introduction to Amazon company 111111111111
Introduction to Amazon company 111111111111Introduction to Amazon company 111111111111
Introduction to Amazon company 111111111111
 
The Influence of Marketing Strategy and Market Competition on Business Perfor...
The Influence of Marketing Strategy and Market Competition on Business Perfor...The Influence of Marketing Strategy and Market Competition on Business Perfor...
The Influence of Marketing Strategy and Market Competition on Business Perfor...
 
Cracking the Workplace Discipline Code Main.pptx
Cracking the Workplace Discipline Code Main.pptxCracking the Workplace Discipline Code Main.pptx
Cracking the Workplace Discipline Code Main.pptx
 
Creative Web Design Company in Singapore
Creative Web Design Company in SingaporeCreative Web Design Company in Singapore
Creative Web Design Company in Singapore
 
Cree_Rey_BrandIdentityKit.PDF_PersonalBd
Cree_Rey_BrandIdentityKit.PDF_PersonalBdCree_Rey_BrandIdentityKit.PDF_PersonalBd
Cree_Rey_BrandIdentityKit.PDF_PersonalBd
 
RMD24 | Debunking the non-endemic revenue myth Marvin Vacquier Droop | First ...
RMD24 | Debunking the non-endemic revenue myth Marvin Vacquier Droop | First ...RMD24 | Debunking the non-endemic revenue myth Marvin Vacquier Droop | First ...
RMD24 | Debunking the non-endemic revenue myth Marvin Vacquier Droop | First ...
 
What is the TDS Return Filing Due Date for FY 2024-25.pdf
What is the TDS Return Filing Due Date for FY 2024-25.pdfWhat is the TDS Return Filing Due Date for FY 2024-25.pdf
What is the TDS Return Filing Due Date for FY 2024-25.pdf
 
Sustainability: Balancing the Environment, Equity & Economy
Sustainability: Balancing the Environment, Equity & EconomySustainability: Balancing the Environment, Equity & Economy
Sustainability: Balancing the Environment, Equity & Economy
 
Enterprise Excellence is Inclusive Excellence.pdf
Enterprise Excellence is Inclusive Excellence.pdfEnterprise Excellence is Inclusive Excellence.pdf
Enterprise Excellence is Inclusive Excellence.pdf
 
Exploring Patterns of Connection with Social Dreaming
Exploring Patterns of Connection with Social DreamingExploring Patterns of Connection with Social Dreaming
Exploring Patterns of Connection with Social Dreaming
 

Mutual Fund Performance Report 2015

  • 1. US Mutual Fund Performance Report 2015
  • 2. The US Mutual Fund Industry In US dollars. Number of US-domiciled funds in the sample as of December 31, 2014. International equities include non-US developed and emerging markets funds. See Data appendix for more information. US-domiciled mutual fund data is from the CRSP Survivor-Bias-Free US Mutual Fund Database, provided by the Center for Research in Security Prices, University of Chicago. Number of equity and fixed income funds, 2014 This study evaluates a sample of US funds totaling more than 5,200 managers and representing about $10 trillion in wealth by the end of 2014. 2
  • 3. Assets under Management In US dollars. Past performance is no guarantee of future results. See Data appendix for more information. US-domiciled mutual fund data is from the CRSP Survivor-Bias-Free US Mutual Fund Database, provided by the Center for Research in Security Prices, University of Chicago. In USD (billions), 2000–2014 3
  • 4. Beginning sample includes funds as of the beginning of the three-, five-, 10-, and 15-year periods ending December 31, 2014. The number of beginners is indicated below the period label. Non-survivors include funds that were either liquidated or merged. Outperformers (winners) are funds that survived and beat their respective benchmarks over the period. Past performance is no guarantee of future results. See Data appendix for more information. US-domiciled mutual fund data is from the CRSP Survivor-Bias-Free US Mutual Fund Database, provided by the Center for Research in Security Prices, University of Chicago. Survivorship and Outperformance Performance periods ending December 31, 2014—Equity Funds 4
  • 5. Beginning sample includes funds as of the beginning of the three-, five-, 10-, and 15-year periods ending December 31, 2014. The number of beginners is indicated below the period label. Non-survivors include funds that were either liquidated or merged. Outperformers (winners) are funds that survived and beat their respective benchmarks over the period. Past performance is no guarantee of future results. See Data appendix for more information. US-domiciled mutual fund data is from the CRSP Survivor-Bias-Free US Mutual Fund Database, provided by the Center for Research in Security Prices, University of Chicago. Survivorship and Outperformance Performance periods ending December 31, 2014—Fixed Income Funds 5
  • 6. Do Winners Keep Winning? The sample includes funds at the beginning of the three-, five-, and 10-year periods, ending in December 2009 (the "initial period"). The graph shows the proportion of funds that outperformed and underperformed their respective benchmarks (i.e., winners and losers) during the initial periods. Winning funds were re-evaluated in the subsequent period from 2010 through 2014, with the graph showing the proportion of outperformance and underperformance among past winners. (Fund counts and percentages may not correspond due to rounding.) Past performance is no guarantee of future results. See Data appendix for more information. US-domiciled mutual fund data is from the CRSP Survivor-Bias-Free US Mutual Fund Database, provided by the Center for Research in Security Prices, University of Chicago. Past performance vs. subsequent performance—Equity Funds 6
  • 7. Do Winners Keep Winning? The sample includes funds at the beginning of the three-, five-, and 10-year periods, ending in December 2009 (the "initial period"). The graph shows the proportion of funds that outperformed and underperformed their respective benchmarks (i.e., winners and losers) during the initial periods. Winning funds were re-evaluated in the subsequent period from 2010 through 2014, with the graph showing the proportion of outperformance and underperformance among past winners. (Fund counts and percentages may not correspond due to rounding.) Past performance is no guarantee of future results. See Data appendix for more information. US-domiciled mutual fund data is from the CRSP Survivor-Bias-Free US Mutual Fund Database, provided by the Center for Research in Security Prices, University of Chicago. Past performance vs. subsequent performance—Fixed Income Funds 7
  • 8. High Costs Make Outperformance Difficult The sample includes funds at the beginning of the five-, 10-, and 15-year periods ending December 31, 2014. Funds are ranked by quartiles based on average expense ratio over the sample period, and performance is compared to their respective benchmarks. The chart shows the proportion of winner and loser funds within each expense ratio quartile. Past performance is no guarantee of future results. See Data appendix for more information. US-domiciled mutual fund data is from the CRSP Survivor-Bias-Free US Mutual Fund Database, provided by the Center for Research in Security Prices, University of Chicago. Winners and losers based on expense ratios (%)—Equity Funds 8
  • 9. High Costs Make Outperformance Difficult The sample includes funds at the beginning of the five-, 10-, and 15-year periods ending December 31, 2014. Funds are ranked by quartiles based on average expense ratio over the sample period, and performance is compared to their respective benchmarks. The chart shows the proportion of winner and loser funds within each expense ratio quartile. Past performance is no guarantee of future results. See Data appendix for more information. US-domiciled mutual fund data is from the CRSP Survivor-Bias-Free US Mutual Fund Database, provided by the Center for Research in Security Prices, University of Chicago. Winners and losers based on expense ratios (%)—Fixed Income Funds 9
  • 10. High Trading Costs Make Outperformance Difficult The sample includes funds at the beginning of the five-, 10-, and 15-year periods ending December 31, 2014. Funds are ranked by quartiles based on average turnover during the sample period, and performance is compared to their respective benchmarks. The chart shows the proportion of winner and loser funds within each turnover quartile. Past performance is no guarantee of future results. See Data appendix for more information. US-domiciled mutual fund data is from the CRSP Survivor-Bias-Free US Mutual Fund Database, provided by the Center for Research in Security Prices, University of Chicago. Winners and losers based on turnover (%)—Equity Funds 10
  • 11. Report Summary Past performance is no guarantee of future results. Findings • Most mutual funds underperformed their benchmarks. • Strong track records failed to persist. • High costs and excessive turnover may have contributed to underperformance. Lessons • The market does a good job of pricing securities, making it difficult for managers to outperform by trying to outguess other participants. • Managers in search of mispricing face high cost barriers as they try to beat the market. • Successful fund investing involves more than picking past winners. • Consider a fund’s market philosophy, investment objectives, strategy, trading costs, and other factors. The mutual fund landscape 11
  • 12. Data Appendix US-domiciled mutual fund data is from the CRSP Survivor-Bias-Free US Mutual Fund Database, provided by the Center for Research in Security Prices, University of Chicago. Certain types of equity and fixed income funds were excluded from the performance study. For equities, sector funds and funds with a narrow investment focus, such as real estate and gold, were excluded. Money market funds, municipal bond funds, and asset-backed security funds were excluded from fixed income. Funds are identified using Lipper fund classification codes. Correlation coefficients are computed for each fund with respect to diversified benchmark indices using all return data available between January 1, 2000, and December 31, 2014. The index most highly correlated with a fund is assigned as its benchmark. Winner funds are those whose cumulative return over the period exceeded that of their respective benchmark. Loser funds are funds that did not survive the period or whose cumulative return did not exceed their respective benchmark. Expense ratio ranges: The ranges of expense ratios for equity funds over the five-, 10-, and 15-year periods are 0.01% to 4.89%, 0.01% to 4.53%, and 0.04% to 4.83%, respectively. For fixed income funds, ranges over the same periods are 0.01% to 2.78%, 0.05% to 2.55%, and 0.03% to 3.66%, respectively. Portfolio turnover ranges: Ranges for equity fund turnover over the five-, 10-, and 15-year periods are 1.0% to 1,499.4%, 1% to 1,524.0%, and 2.0% to 2,400.4%, respectively. Benchmark data provided by Barclays, MSCI, Russell, Citigroup, BofA Merrill Lynch, and S&P. Barclays data provided by Barclays Bank PLC. MSCI data © MSCI 2015, all rights reserved. Russell data © Russell Investment Group 1995−2015, all rights reserved. Citigroup bond indices © 2015 by Citigroup. The BofA Merrill Lynch index is used with permission; © 2015 Merrill Lynch, Pierce, Fenner & Smith Incorporated; all rights reserved. Merrill Lynch, Pierce, Fenner & Smith Incorporated is a wholly owned subsidiary of Bank of America Corporation. The S&P data is provided by Standard & Poor’s Index Services Group. Benchmark indices are not available for direct investment. Their performance does not reflect the expenses associated with the management of an actual portfolio. Mutual fund investment values will fluctuate, and shares, when redeemed, may be worth more or less than original cost. Diversification neither assures a profit nor guarantees against a loss in a declining market. There is no guarantee investment strategies will be successful. Past performance is no guarantee of future results. 12
  • 13. Mutual Fund 15-Year Survivorship and Outperformance Sample includes funds available as of December 31, 1999. Funds are identified using Lipper fund classification codes. Correlation coefficients are computed for each fund with respect to diversified benchmark indices using all return data available between January 1, 2000 and December 31, 2014. Funds are categorized according to the index with which their returns are most highly correlated. Survivors are funds that were still in existence as of December 31, 2014. Non-survivors include funds that were either liquidated or merged. Outperforming funds are those whose cumulative return over the period exceeded that of their respective benchmark. All fund returns are net of fees and expenses. Past performance is no guarantee of future results. Benchmark data from Russell, Barclays, BofA Merrill Lynch, and MSCI. US-domiciled mutual fund data is from the CRSP Survivor-Bias-Free US Mutual Fund Database, provided by the Center for Research in Security Prices, University of Chicago. Performance Periods Ending December 31, 2014 Fund Category Benchmark # Begin Survive (%) Outperform (%) US EQUITIES US All Cap Core Russell 3000 Index 171 46 15 US All Cap Value Russell 3000 Value Index 98 51 26 US All Cap Growth Russell 3000 Growth Index 138 38 20 US Large Cap Core Russell 1000 Index 121 45 14 US Large Cap Value Russell 1000 Value Index 109 38 18 US Large Cap Growth Russell 1000 Growth Index 59 31 8 US Small Cap Core Russell 2000 Index 114 53 38 US Small Cap Value Russell 2000 Value Index 93 62 38 US Small Cap Growth Russell 2000 Growth Index 191 41 28 INTERNATIONAL EQUITIES Non-US Developed All Cap MSCI All Country World ex USA IMI Index (net div.) 117 40 24 Non-US Developed Large Cap MSCI All Country World ex USA Index (net div.) 134 62 16 Non-US Developed Small Cap MSCI All Country World ex USA Small Cap Index (net div.) 37 57 16 Emerging Markets MSCI Emerging Markets Index (net div.) 118 43 22 GLOBAL EQUITIES Global All Cap MSCI All Country World IMI Index (net div.) 132 43 29 Global Large Cap MSCI All Country World Index (net div.) 43 26 23 Global Small Cap MSCI All Country World Small Cap Index (net div.) 48 63 29 US FIXED INCOME US Short Duration Barclays Treasury Bond Index 1−5 Years 106 43 11 US Market Duration Barclays US Government Bond Index 377 44 6 Inflation-Protected Barclays US TIPS Index 8 63 13 13