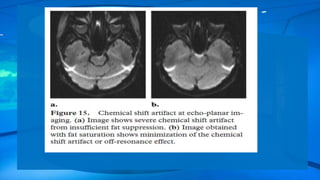
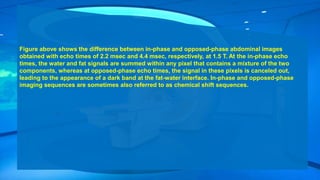
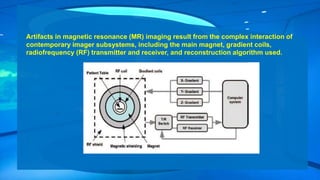
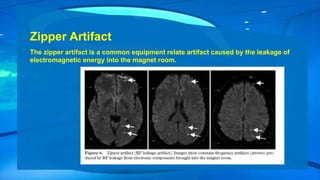
BY : Shaker Nawasrah
Artifacts in magnetic resonance (MR) imaging result from the complex interaction of
contemporary imager subsystems, including the main magnet, gradient coils,
radiofrequency (RF) transmitter and receiver, and reconstruction algorithm used.
We no longer look to MR imaging to provide only structural information, but also
functional information of various kinds. Information about blood flow, cardiac
function, biochemical processes, tumor kinetics, and blood oxygen levels (for
mapping of brain function) are just a few examples of the data that can be
obtained with MR imaging today .
Since the first U.S. Food and Drug Administration (FDA)-approved MR imaging
system arrived
in the marketplace more than 30 years ago, the available magnetic field
strengths have increased 20-fold and more, the gradient capabilities have
increased 100- to 200-fold, and the RF chain has been completely revamped with
phased-array coil imaging and parallel imaging .
rapid imaging techniques :
- echo-planar imaging .
- half-Fourier rapid acquisition with relaxation enhancement
.
- The data that are captured during MR imaging are called k-
space data.
- k-Space data include useful information but can be interpreted
only after they are translated into images with the Fourier
transform .
k-
Space
MRI data are collected by using quadrature detection, which provides
both real and imaginary k-space data.
The y-dimension in this 256 256 array is called the phase encoding
direction, and the x-dimension is called the frequency encoding
direction.
Sampling is much quicker in the frequency encoding direction than in
the phase encoding direction.
the time between adjacent samples is greater than or equal to the
repetition time of the particular sequence (except for fast SE and
echoplanar imaging sequences).
Maps of k-space data (top row)
and corresponding MR images
(bottom row) obtained in a
phantom illustrate the
relationship between raw k-
space data and the
reconstructed MR image after
Fourier transform. (a) Image
reconstructed only with data
from the center of k-space has
high contrast but low spatial
resolution (b) Image
reconstructed only with data
from the periphery of k-space
shows well-defined edges but
has poor contrast resolution.
(c) Image reconstructed with all
the k-space data has both good
contrast and good spatial
Low spatial frequencies are encoded in the center of k-space and provide contrast
resolution to the image .
Whereas high spatial frequencies are encoded toward the edges of k-space and
contribute to the spatial resolution of the image .
Each pixel in the resultant image is the weighted sum of all the
individual points in k-space.
Equipment-related Artifacts
- Spike (Herringbone) Artifact :
Gradients applied at a very high duty cycle (eg, those in echo-planar imaging) may
produce bad
data points, or a spike of noise, in k-space.
The bad data might be a single point or a few points in k-space that have a very high
or low intensity compared with the intensity of the rest of k-space.
The convolution of this spike with all the other image information during the Fourier
transform results in dark stripes overlaid on the image .
Spike noise usually occurs because of loose electrical connections that
produce arcs or because of the breakdown of interconnections in an
RF coil .
Zipper Artifact
The zipper artifact is a common equipment relate artifact caused by the leakage of
electromagnetic energy into the magnet room.
It appears as a region of increased noise with a width of 1 or 2 pixels that extends in
the frequency encoding Direction .
Motion-related Artifacts
The artifact appears as blurring of the image as well as ghosting in the phase encoding
direction.
The time difference in the acquisition of adjacent points in the frequency encoding
direction is relatively short (order of microseconds) and is dependent on the sampling
frequency or the bandwidth used.
The time difference in the acquisition of adjacent points in the phase encoding direction is
much longer and is equal to the repetition time used for the sequence .
Respiratory and cardiac motion also can cause movement-related artifacts in the phase
encoding
direction.
The best way to eliminate respiration-related motion is to perform breath hold. However, the
number of sections that can be obtained during a 20-second breath hold is limited.
Respiratory gating may work better to resolve respiratory motion
artifacts , with image acquisition performed at a certain phase of the
respiratory cycle.
The drawback of respiratory gating is that the acquisition time is
increased.
Another way to effectively reduce respiratory motion artifacts is to use
respiratory compensation or phase reordering (also called respiratory-
ordered phase encoding, or ROPE), whereby the phase encoding steps
are ordered on the basis of the phase of the respiratory cycle .
This technique allows a smooth phase variation across k-space , and
the limitation of variation to a single cycle of respiration instead of
several cycles.
Respiratory-ordered phase encoding works well in patients with regular respiratory
cycles but not in those with irregular breathing.
Real-time navigator echo gating is an elegant non–breath-hold technique that can be
used to compensate for several different types of motion .
Cardiac motion–related artifacts are avoided by using electrocardiographic gating to
time image acquisition , so that it occurs at the same phase of each cardiac cycle.
Further artifact suppression can be achieved while imaging the heart if the
acquisition is performed during breath holding.
N/2 Ghost and Segmented- k-Space Artifacts
Echo-planar imaging is based on the continuous reversal of the echoes by using
a gradient pulse (commonly called gradient recalled echo [GRE] imaging) after a
single excitation for the acquisition of all lines in k-space to form a single image.
In this case, every alternate line in k-space is read in the opposite direction
because of the reversed polarity of the readout gradient.
This reversal process may result in the introduction of phase errors in every
alternate line of k-space.
Phase errors can arise from minor deviations in the linear course of the gradient as it
traverses
from maximum positive polarity to maximum negative polarity, the existence of eddy
currents in
the system, or poor shimming.
The mismatch in phase causes the appearance of ghosts on the reconstructed
images.
Images acquired with fast SE sequences also are susceptible to segmented-k-space
artifacts.
Flow Artifacts
The blood flow is manifested as ghosting in the phase encoding direction.
GRE sequences are much more susceptible to flow artifacts than are SE
sequences.
In SE sequences, the flow usually appears dark (produces no signal) because
the blood void effect - In GRE imaging, the in-flow effect produces the bright
blood phenomenon .
A common way to reduce the motion artifact caused by through-plane flow is to
apply a saturation band adjacent to the imaging section.
With this method, all spins within the slab are tilted toward the axial plane by a
90° RF pulse and then spoiled with the application of strong gradient crusher
pulses before image acquisition starts. The spins, thus saturated, exhibit no
signal when they move into the imaging volume .
Flow artifacts could also be minimized by using flow compensation or gradient
moment nulling. In this technique, flowing spins are rephased by using motion-
compensating gradient pulses.
Figure . Schematics show the MR signal effects of flow compensation with gradient moment
nulling. Top: Typical readout gradient waveform. Bottom: Phase of cumulative stationary spins
(solid line) and constant-velocity spins (dotted and dashed lines). (a) During imaging without
flow compensation, the moving spins are not refocused at the desired echo time (TE), and this
leads to the loss of signal from flowing spins. (b) During imaging with gradient moment
nulling, all the spins are refocused, and flow velocity is compensated for by
the 1:2:1 ratio of the gradient lobe areas. GGMR gradient moment nulling gradient, GR readout
gradient.
With motion compensation, the flowing spins with constant velocity (irrespective of what the
velocity is) are brought back into phase, with no effect on static spins.
The penalty for using motion compensation is increased echo time.
Higher order motion compensation also can be obtained for spins with constant acceleration
and for spins
with varying acceleration (wobbling) by applying additional gradient pulses, but this increases
the
echo time even further .
Susceptibility Effects :
The effect of tissue magnetization slightly alters the local magnetic field. The difference in
tissue susceptibility causes field inhomogeneity between tissue boundaries, which makes
spins dephase faster, producing signals of low intensity.
This signal loss is especially severe at air-tissue or bone–soft tissue boundaries, because air
and bone have much lower magnetic susceptibility than do most tissues .
Local magnetic fields tend to take on different configurations around these interfaces, and the
difference
introduces geometric distortion into the resultant images, especially when sequences with
long echo
times are used.
SE sequences are less affected by local field inhomogeneity because of the 180° refocusing
pulse, which cancels the susceptibility gradients.
Echo-planar images generally are subject to more severe susceptibility artifacts because
the echoes are refocused by using gradient refocusing over a long period.
One way to minimize this distortion is to orient the phase encoding gradient along the
same axis as the susceptibility gradients.
The best way to minimize susceptibility artifacts is to use an SE sequence or reduce
the echo time ,increase the acquisition matrix , and improve shimming .
metal-related artifacts typically are manifested as areas of complete signal loss
because the local magnetic field is so strong that the spins are almost immediately
dephased.
Sometimes, depending on the strength of the
resultant distortion of the magnetic field, part of a
section may appear on images acquired in a
completely different section because of the
frequency difference between the spins in the metal
and those next to the metal.
The visual distortion created by metallic implants on MR images cannot be completely
eliminated, but its effect can be minimized by a large receiver bandwidth and a
decreased echo time.
Fast SE acquisitions with a high bandwidth typically work well in such cases.
Chemical Shift Artifacts
Protons in water and protons in fat have a significantly different chemical
environment, which
causes their resonance frequencies to differ.
The shift in Larmor frequency between water protons and fat protons is referred to
as chemical shift.
The suppression of fat protons at MR imaging is very useful for improving contrast
on images of the breast, abdomen, and optic nerve .
The chemical shift between water and fat can cause artifacts in the frequency
encoding direction.
If this occurs, there will be a slight misregistration of the fat content on images,
because of the slight shift in the frequency of the fat protons.
The number of pixels involved in this slight shift depends on the receiver
bandwidth and the number of data points used to encode the frequency
direction.
In mathematic terms, the result may be expressed as follows:
CSA= ∆ɷ. Nfreq/Bwrec
CSA is a chemical shift artifact, is the frequency difference between fat and
water, Nfreq is the number of samples in the frequency encoding direction, and
BWrec is the receiver bandwidth.
With the use of fast SE sequences, in contrast, the goals are to minimize the echo
spacing and to maximize the decaying T2 signal.
These goals are usually achieved by using a shorter RF pulse and a higher-bandwidth
receiver window.
The signal from fat can dominate the dynamic range of an image and suppress the
contrast between
lesions and normal tissue, especially on abdominal MR images.
Echo-planar images are very susceptible to artifacts from off-resonance frequencies,
and unless the fat frequency is suppressed, the images will be degraded by fat-related
artifacts.
Any off-resonance signal (such as that of fat) will be affected by a position shift along
the image because of the long duration of data sampling (50–100 msec) .
Any off-resonance signal (such as that of fat) will be affected by a position shift
along the image because of the long duration of data sampling (50–100 msec).
Such a shift could affect approximately 12 pixels at a readout time of 50 msec .
A common method for minimizing fat-related artifacts is to apply a frequency-
selective RF pulse to null the fat signal before applying the imaging pulse
sequence .
Another method is to use a short inversion time inversion recovery (STIR) sequence .
If the T1 of any tissue is known, the inversion time needed to null the signal from that
tissue in an inversion recovery sequence is given by 0.7 T1.
In the case of fat, the inversion time is around 150 msec at 1.5 T. The decision to use
fat saturation or a STIR sequence depends on the specific application; both methods
have advantages and disadvantages .
Successful fat saturation will
result only
if the magnetic field homogeneity
is
sufficient throughout the imaging
region.
Successful fat saturation will
result only if the magnetic field
homogeneity is sufficient
throughout the imaging region.
In the case of fat, the inversion time is around 150 msec at 1.5 T.
In-phase versus Opposed-phase Imaging
Chemical shift can be used to advantage, as is routinely done in liver imaging for the detection
of fatty infiltration.
Because the processional frequencies of fat and water are different, they go in and out of phase
from each other after excitation.
Since the difference in frequency between fat and water is about 220 Hz, the fat and water signals
are in phase every 1/220 Hz (4.45 msec, 8.9 msec, and so on ) .
fat and water signals would be 180° out of phase with one another at 2.23 msec, 6.69 msec and so
on .
Figure above shows the difference between in-phase and opposed-phase abdominal images
obtained with echo times of 2.2 msec and 4.4 msec, respectively, at 1.5 T. At the in-phase echo
times, the water and fat signals are summed within any pixel that contains a mixture of the two
components, whereas at opposed-phase echo times, the signal in these pixels is canceled out,
leading to the appearance of a dark band at the fat-water interface. In-phase and opposed-phase
imaging sequences are sometimes also referred to as chemical shift sequences.
Aliasing (Wraparound) Artifacts
A common artifact routinely encountered in MR imaging is aliasing. Aliasing occurs
whenever the imaging field of view is smaller than the anatomy being imaged.
the field of view in both the readout and the phase encoding directions is inversely
proportional to the incremental gradient step required from one point to the next.
Therefore, when a field of view is selected, it is expected that the gradient will move
one cycle (0–2Л) from one end of the field to the other.
If the sensitivity of the RF transmission coil extends beyond this field of view, the
spins outside the field will be excited, but they will be part of the next cycle in the
phase encoding direction (eg, 2–4Л, 4–6Л, and so on).
However, the phase angles of the spins outside the field of view are essentially
equivalent to those of the spins within the selected field of view but on the opposite
side of the image.
For the Fourier transform, spins at 10° are equivalent to spins at 2Л+10°, and the
result is an overlap of signals outside the intended field of view with signals within
that field of view.
Aliasing is always encountered in the phase encoding direction because the frequency
encoding direction is typically oversampled within the system .
Aliasing also can occur in the section direction in a three-dimensional (3D) acquisition.
in the coronal plane, fields of view that are smaller than the object will not only cause
aliasing but also create an interference pattern called the moire´ or fringe artifact.
When aliasing occurs, the overlap of signals from one side of the body to the other side,
with mismatched phases, produces a moire´ artifact .
An easy way to eliminate aliasing is to exchange the readout direction with the
phase encoding
direction (swap the imaging axes) so that the anatomy fits into the phase field of
view , However, this method may result in motion artifacts along the phase
encoding direction that obscure a pathologic entity.
Other ways of decreasing aliasing artifacts are to increase the phase field of view
or to apply spatial saturation pulses outside the field of view so that the signals
from outside the
field of view will not give rise to artifacts within the field.
The interference pattern also occurs when different echoes from different
excitation modes are
received within the same acquisition window but with slightly different echo times.
2 ways to address this problem :
- adjust the timing of the sequence so that the stimulated echo is superimposed on the
main echo .
- use selective saturation to null the signal from the stimulated echo.
Gibbs Effect
Gibbs or truncation artifacts are bright or dark lines that appear parallel with and adjacent to
the borders of an area of abrupt signal intensity change on MR images.
Insufficient collection of samples in either the phase encoding direction or the readout
direction leads to Gibbs rings as a result of the Fourier transform .
One usually sees Gibbs rings in the phase encoding direction because a phase encoding
matrix that is
smaller than the readout matrix is often selected to decrease the acquisition time.
Gibbs rings can be minimized by increasing the acquisition matrix size and maintaining the
same field of view, but the improvement comes with a penalty of increased acquisition time
and a reduced per-pixel
signal-to-noise ratio.
Section Cross
Talk
Cross talk between sections occurs at imaging of contiguous sections (with no gap) in a
multisection
two-dimensional acquisition.
In the presence of cross talk, all sections except the edge sections in a multisection
acquisition have reduced signal intensity.
The RF pulses used for excitation are not perfect in that they do not produce a section
profile with a straight edge.
any side lobes to the RF pulse might excite the neighboring section by a few degrees.
Possible remedies for cross talk between sections :
- RF pulses with sharper section profiles .
- an increased gap between sections .
- multiple sections imaged in separate batches (one batch consisting of all the odd
numbered sections; the other, all the even-numbered sections).
Three-dimensional images are not vulnerable to this effect because the whole volume undergoes
excitation and because sections within the volume are acquired by using the gradients, as is the
case with normal frequency
and phase encoding.
Imaging System Cross Talk
If multiple MR imaging systems are operated at about the same frequency and at the same
time :
You should ground the RF shield separately and keep the RF and gradient amplifiers for the
individual imagers away from each other .
Gradient-related Distortion
When an electrical current is applied to a gradient coil, a varying magnetic field is produced
that is
linear through the isocenter of the magnet but tapers toward the sides of the magnet.
The result is mismapping the spins from their true location
at the edges of images
Parallel Imaging Artifact
New signal acquisition schemes such as SMASH (simultaneous acquisition of spatial harmonics),
SENSE (sensitivity encoding), and GRAPPA (generalized auto calibrating partially parallel
acquisitions), which are categorized as parallel imaging techniques, have spawned a whole new
avenue for growth in MR imaging methods and applications.
References
1. Lauterbur PC. Image formation by induced local
interactions: examples employing nuclear magnetic
resonance. (1973.) Clin Orthop Relat Res
1989;244:3–6.
2. Lewin JS, Laub G, Hausmann R. Three-
dimensional
time-of-flight MR angiography: applications
in the abdomen and thorax. Radiology 1991;179:
261–264.
3. Petitjean C, Rougon N, Cluzel P. Assessment of
myocardial function: a review of quantification
methods and results using tagged MRI. J Cardiovasc
Magn Reson 2005;7:501–516.
4. McKnight TR. Proton magnetic resonance
spectroscopic
evaluation of brain tumor metabolism.
Semin Oncol 2004;31:605–617.
5. Tofts PS. Modeling tracer kinetics in dynamic Gd-
DTPA MR imaging. J Magn Reson Imaging 1997;
7:91–101.
6. Ogawa S, Tank DW, Menon R, et al. Intrinsic signal
changes accompanying sensory stimulation:
functional brain mapping with magnetic resonance
imaging. Proc Natl Acad Sci U S A 1992;89:
5951–5955.
7. Hayes CE, Hattes N, Roemer PB. Volume imaging
with MR phased arrays. Magn Reson Med
1991;18:309–319.
TheEnd

Mri artifacts

  • 1.
    BY : ShakerNawasrah
  • 2.
    Artifacts in magneticresonance (MR) imaging result from the complex interaction of contemporary imager subsystems, including the main magnet, gradient coils, radiofrequency (RF) transmitter and receiver, and reconstruction algorithm used.
  • 3.
    We no longerlook to MR imaging to provide only structural information, but also functional information of various kinds. Information about blood flow, cardiac function, biochemical processes, tumor kinetics, and blood oxygen levels (for mapping of brain function) are just a few examples of the data that can be obtained with MR imaging today . Since the first U.S. Food and Drug Administration (FDA)-approved MR imaging system arrived in the marketplace more than 30 years ago, the available magnetic field strengths have increased 20-fold and more, the gradient capabilities have increased 100- to 200-fold, and the RF chain has been completely revamped with phased-array coil imaging and parallel imaging .
  • 4.
    rapid imaging techniques: - echo-planar imaging . - half-Fourier rapid acquisition with relaxation enhancement . - The data that are captured during MR imaging are called k- space data. - k-Space data include useful information but can be interpreted only after they are translated into images with the Fourier transform .
  • 5.
  • 6.
    MRI data arecollected by using quadrature detection, which provides both real and imaginary k-space data. The y-dimension in this 256 256 array is called the phase encoding direction, and the x-dimension is called the frequency encoding direction. Sampling is much quicker in the frequency encoding direction than in the phase encoding direction. the time between adjacent samples is greater than or equal to the repetition time of the particular sequence (except for fast SE and echoplanar imaging sequences).
  • 7.
    Maps of k-spacedata (top row) and corresponding MR images (bottom row) obtained in a phantom illustrate the relationship between raw k- space data and the reconstructed MR image after Fourier transform. (a) Image reconstructed only with data from the center of k-space has high contrast but low spatial resolution (b) Image reconstructed only with data from the periphery of k-space shows well-defined edges but has poor contrast resolution. (c) Image reconstructed with all the k-space data has both good contrast and good spatial
  • 8.
    Low spatial frequenciesare encoded in the center of k-space and provide contrast resolution to the image . Whereas high spatial frequencies are encoded toward the edges of k-space and contribute to the spatial resolution of the image .
  • 9.
    Each pixel inthe resultant image is the weighted sum of all the individual points in k-space.
  • 10.
    Equipment-related Artifacts - Spike(Herringbone) Artifact : Gradients applied at a very high duty cycle (eg, those in echo-planar imaging) may produce bad data points, or a spike of noise, in k-space. The bad data might be a single point or a few points in k-space that have a very high or low intensity compared with the intensity of the rest of k-space. The convolution of this spike with all the other image information during the Fourier transform results in dark stripes overlaid on the image .
  • 12.
    Spike noise usuallyoccurs because of loose electrical connections that produce arcs or because of the breakdown of interconnections in an RF coil .
  • 13.
    Zipper Artifact The zipperartifact is a common equipment relate artifact caused by the leakage of electromagnetic energy into the magnet room.
  • 14.
    It appears asa region of increased noise with a width of 1 or 2 pixels that extends in the frequency encoding Direction .
  • 15.
    Motion-related Artifacts The artifactappears as blurring of the image as well as ghosting in the phase encoding direction. The time difference in the acquisition of adjacent points in the frequency encoding direction is relatively short (order of microseconds) and is dependent on the sampling frequency or the bandwidth used. The time difference in the acquisition of adjacent points in the phase encoding direction is much longer and is equal to the repetition time used for the sequence . Respiratory and cardiac motion also can cause movement-related artifacts in the phase encoding direction.
  • 17.
    The best wayto eliminate respiration-related motion is to perform breath hold. However, the number of sections that can be obtained during a 20-second breath hold is limited.
  • 18.
    Respiratory gating maywork better to resolve respiratory motion artifacts , with image acquisition performed at a certain phase of the respiratory cycle. The drawback of respiratory gating is that the acquisition time is increased. Another way to effectively reduce respiratory motion artifacts is to use respiratory compensation or phase reordering (also called respiratory- ordered phase encoding, or ROPE), whereby the phase encoding steps are ordered on the basis of the phase of the respiratory cycle . This technique allows a smooth phase variation across k-space , and the limitation of variation to a single cycle of respiration instead of several cycles.
  • 19.
    Respiratory-ordered phase encodingworks well in patients with regular respiratory cycles but not in those with irregular breathing. Real-time navigator echo gating is an elegant non–breath-hold technique that can be used to compensate for several different types of motion .
  • 22.
    Cardiac motion–related artifactsare avoided by using electrocardiographic gating to time image acquisition , so that it occurs at the same phase of each cardiac cycle. Further artifact suppression can be achieved while imaging the heart if the acquisition is performed during breath holding.
  • 23.
    N/2 Ghost andSegmented- k-Space Artifacts Echo-planar imaging is based on the continuous reversal of the echoes by using a gradient pulse (commonly called gradient recalled echo [GRE] imaging) after a single excitation for the acquisition of all lines in k-space to form a single image. In this case, every alternate line in k-space is read in the opposite direction because of the reversed polarity of the readout gradient.
  • 24.
    This reversal processmay result in the introduction of phase errors in every alternate line of k-space. Phase errors can arise from minor deviations in the linear course of the gradient as it traverses from maximum positive polarity to maximum negative polarity, the existence of eddy currents in the system, or poor shimming. The mismatch in phase causes the appearance of ghosts on the reconstructed images. Images acquired with fast SE sequences also are susceptible to segmented-k-space artifacts.
  • 26.
    Flow Artifacts The bloodflow is manifested as ghosting in the phase encoding direction. GRE sequences are much more susceptible to flow artifacts than are SE sequences. In SE sequences, the flow usually appears dark (produces no signal) because the blood void effect - In GRE imaging, the in-flow effect produces the bright blood phenomenon . A common way to reduce the motion artifact caused by through-plane flow is to apply a saturation band adjacent to the imaging section. With this method, all spins within the slab are tilted toward the axial plane by a 90° RF pulse and then spoiled with the application of strong gradient crusher pulses before image acquisition starts. The spins, thus saturated, exhibit no signal when they move into the imaging volume .
  • 27.
    Flow artifacts couldalso be minimized by using flow compensation or gradient moment nulling. In this technique, flowing spins are rephased by using motion- compensating gradient pulses.
  • 29.
    Figure . Schematicsshow the MR signal effects of flow compensation with gradient moment nulling. Top: Typical readout gradient waveform. Bottom: Phase of cumulative stationary spins (solid line) and constant-velocity spins (dotted and dashed lines). (a) During imaging without flow compensation, the moving spins are not refocused at the desired echo time (TE), and this leads to the loss of signal from flowing spins. (b) During imaging with gradient moment nulling, all the spins are refocused, and flow velocity is compensated for by the 1:2:1 ratio of the gradient lobe areas. GGMR gradient moment nulling gradient, GR readout gradient. With motion compensation, the flowing spins with constant velocity (irrespective of what the velocity is) are brought back into phase, with no effect on static spins. The penalty for using motion compensation is increased echo time. Higher order motion compensation also can be obtained for spins with constant acceleration and for spins with varying acceleration (wobbling) by applying additional gradient pulses, but this increases the echo time even further .
  • 30.
    Susceptibility Effects : Theeffect of tissue magnetization slightly alters the local magnetic field. The difference in tissue susceptibility causes field inhomogeneity between tissue boundaries, which makes spins dephase faster, producing signals of low intensity. This signal loss is especially severe at air-tissue or bone–soft tissue boundaries, because air and bone have much lower magnetic susceptibility than do most tissues . Local magnetic fields tend to take on different configurations around these interfaces, and the difference introduces geometric distortion into the resultant images, especially when sequences with long echo times are used. SE sequences are less affected by local field inhomogeneity because of the 180° refocusing pulse, which cancels the susceptibility gradients.
  • 31.
    Echo-planar images generallyare subject to more severe susceptibility artifacts because the echoes are refocused by using gradient refocusing over a long period.
  • 33.
    One way tominimize this distortion is to orient the phase encoding gradient along the same axis as the susceptibility gradients. The best way to minimize susceptibility artifacts is to use an SE sequence or reduce the echo time ,increase the acquisition matrix , and improve shimming . metal-related artifacts typically are manifested as areas of complete signal loss because the local magnetic field is so strong that the spins are almost immediately dephased. Sometimes, depending on the strength of the resultant distortion of the magnetic field, part of a section may appear on images acquired in a completely different section because of the frequency difference between the spins in the metal and those next to the metal.
  • 34.
    The visual distortioncreated by metallic implants on MR images cannot be completely eliminated, but its effect can be minimized by a large receiver bandwidth and a decreased echo time. Fast SE acquisitions with a high bandwidth typically work well in such cases.
  • 35.
    Chemical Shift Artifacts Protonsin water and protons in fat have a significantly different chemical environment, which causes their resonance frequencies to differ. The shift in Larmor frequency between water protons and fat protons is referred to as chemical shift. The suppression of fat protons at MR imaging is very useful for improving contrast on images of the breast, abdomen, and optic nerve .
  • 36.
    The chemical shiftbetween water and fat can cause artifacts in the frequency encoding direction. If this occurs, there will be a slight misregistration of the fat content on images, because of the slight shift in the frequency of the fat protons. The number of pixels involved in this slight shift depends on the receiver bandwidth and the number of data points used to encode the frequency direction. In mathematic terms, the result may be expressed as follows: CSA= ∆ɷ. Nfreq/Bwrec CSA is a chemical shift artifact, is the frequency difference between fat and water, Nfreq is the number of samples in the frequency encoding direction, and BWrec is the receiver bandwidth.
  • 38.
    With the useof fast SE sequences, in contrast, the goals are to minimize the echo spacing and to maximize the decaying T2 signal. These goals are usually achieved by using a shorter RF pulse and a higher-bandwidth receiver window. The signal from fat can dominate the dynamic range of an image and suppress the contrast between lesions and normal tissue, especially on abdominal MR images. Echo-planar images are very susceptible to artifacts from off-resonance frequencies, and unless the fat frequency is suppressed, the images will be degraded by fat-related artifacts. Any off-resonance signal (such as that of fat) will be affected by a position shift along the image because of the long duration of data sampling (50–100 msec) .
  • 39.
    Any off-resonance signal(such as that of fat) will be affected by a position shift along the image because of the long duration of data sampling (50–100 msec). Such a shift could affect approximately 12 pixels at a readout time of 50 msec . A common method for minimizing fat-related artifacts is to apply a frequency- selective RF pulse to null the fat signal before applying the imaging pulse sequence .
  • 41.
    Another method isto use a short inversion time inversion recovery (STIR) sequence . If the T1 of any tissue is known, the inversion time needed to null the signal from that tissue in an inversion recovery sequence is given by 0.7 T1. In the case of fat, the inversion time is around 150 msec at 1.5 T. The decision to use fat saturation or a STIR sequence depends on the specific application; both methods have advantages and disadvantages .
  • 42.
    Successful fat saturationwill result only if the magnetic field homogeneity is sufficient throughout the imaging region. Successful fat saturation will result only if the magnetic field homogeneity is sufficient throughout the imaging region.
  • 43.
    In the caseof fat, the inversion time is around 150 msec at 1.5 T. In-phase versus Opposed-phase Imaging Chemical shift can be used to advantage, as is routinely done in liver imaging for the detection of fatty infiltration. Because the processional frequencies of fat and water are different, they go in and out of phase from each other after excitation. Since the difference in frequency between fat and water is about 220 Hz, the fat and water signals are in phase every 1/220 Hz (4.45 msec, 8.9 msec, and so on ) . fat and water signals would be 180° out of phase with one another at 2.23 msec, 6.69 msec and so on .
  • 45.
    Figure above showsthe difference between in-phase and opposed-phase abdominal images obtained with echo times of 2.2 msec and 4.4 msec, respectively, at 1.5 T. At the in-phase echo times, the water and fat signals are summed within any pixel that contains a mixture of the two components, whereas at opposed-phase echo times, the signal in these pixels is canceled out, leading to the appearance of a dark band at the fat-water interface. In-phase and opposed-phase imaging sequences are sometimes also referred to as chemical shift sequences.
  • 46.
    Aliasing (Wraparound) Artifacts Acommon artifact routinely encountered in MR imaging is aliasing. Aliasing occurs whenever the imaging field of view is smaller than the anatomy being imaged. the field of view in both the readout and the phase encoding directions is inversely proportional to the incremental gradient step required from one point to the next. Therefore, when a field of view is selected, it is expected that the gradient will move one cycle (0–2Л) from one end of the field to the other. If the sensitivity of the RF transmission coil extends beyond this field of view, the spins outside the field will be excited, but they will be part of the next cycle in the phase encoding direction (eg, 2–4Л, 4–6Л, and so on).
  • 47.
    However, the phaseangles of the spins outside the field of view are essentially equivalent to those of the spins within the selected field of view but on the opposite side of the image. For the Fourier transform, spins at 10° are equivalent to spins at 2Л+10°, and the result is an overlap of signals outside the intended field of view with signals within that field of view.
  • 48.
    Aliasing is alwaysencountered in the phase encoding direction because the frequency encoding direction is typically oversampled within the system . Aliasing also can occur in the section direction in a three-dimensional (3D) acquisition. in the coronal plane, fields of view that are smaller than the object will not only cause aliasing but also create an interference pattern called the moire´ or fringe artifact. When aliasing occurs, the overlap of signals from one side of the body to the other side, with mismatched phases, produces a moire´ artifact .
  • 49.
    An easy wayto eliminate aliasing is to exchange the readout direction with the phase encoding direction (swap the imaging axes) so that the anatomy fits into the phase field of view , However, this method may result in motion artifacts along the phase encoding direction that obscure a pathologic entity. Other ways of decreasing aliasing artifacts are to increase the phase field of view or to apply spatial saturation pulses outside the field of view so that the signals from outside the field of view will not give rise to artifacts within the field. The interference pattern also occurs when different echoes from different excitation modes are received within the same acquisition window but with slightly different echo times.
  • 50.
    2 ways toaddress this problem : - adjust the timing of the sequence so that the stimulated echo is superimposed on the main echo . - use selective saturation to null the signal from the stimulated echo.
  • 51.
    Gibbs Effect Gibbs ortruncation artifacts are bright or dark lines that appear parallel with and adjacent to the borders of an area of abrupt signal intensity change on MR images. Insufficient collection of samples in either the phase encoding direction or the readout direction leads to Gibbs rings as a result of the Fourier transform . One usually sees Gibbs rings in the phase encoding direction because a phase encoding matrix that is smaller than the readout matrix is often selected to decrease the acquisition time. Gibbs rings can be minimized by increasing the acquisition matrix size and maintaining the same field of view, but the improvement comes with a penalty of increased acquisition time and a reduced per-pixel signal-to-noise ratio.
  • 52.
    Section Cross Talk Cross talkbetween sections occurs at imaging of contiguous sections (with no gap) in a multisection two-dimensional acquisition. In the presence of cross talk, all sections except the edge sections in a multisection acquisition have reduced signal intensity. The RF pulses used for excitation are not perfect in that they do not produce a section profile with a straight edge. any side lobes to the RF pulse might excite the neighboring section by a few degrees. Possible remedies for cross talk between sections : - RF pulses with sharper section profiles . - an increased gap between sections . - multiple sections imaged in separate batches (one batch consisting of all the odd numbered sections; the other, all the even-numbered sections).
  • 53.
    Three-dimensional images arenot vulnerable to this effect because the whole volume undergoes excitation and because sections within the volume are acquired by using the gradients, as is the case with normal frequency and phase encoding.
  • 54.
    Imaging System CrossTalk If multiple MR imaging systems are operated at about the same frequency and at the same time : You should ground the RF shield separately and keep the RF and gradient amplifiers for the individual imagers away from each other . Gradient-related Distortion When an electrical current is applied to a gradient coil, a varying magnetic field is produced that is linear through the isocenter of the magnet but tapers toward the sides of the magnet. The result is mismapping the spins from their true location at the edges of images
  • 56.
    Parallel Imaging Artifact Newsignal acquisition schemes such as SMASH (simultaneous acquisition of spatial harmonics), SENSE (sensitivity encoding), and GRAPPA (generalized auto calibrating partially parallel acquisitions), which are categorized as parallel imaging techniques, have spawned a whole new avenue for growth in MR imaging methods and applications.
  • 58.
    References 1. Lauterbur PC.Image formation by induced local interactions: examples employing nuclear magnetic resonance. (1973.) Clin Orthop Relat Res 1989;244:3–6. 2. Lewin JS, Laub G, Hausmann R. Three- dimensional time-of-flight MR angiography: applications in the abdomen and thorax. Radiology 1991;179: 261–264. 3. Petitjean C, Rougon N, Cluzel P. Assessment of myocardial function: a review of quantification methods and results using tagged MRI. J Cardiovasc Magn Reson 2005;7:501–516. 4. McKnight TR. Proton magnetic resonance spectroscopic evaluation of brain tumor metabolism. Semin Oncol 2004;31:605–617. 5. Tofts PS. Modeling tracer kinetics in dynamic Gd- DTPA MR imaging. J Magn Reson Imaging 1997; 7:91–101. 6. Ogawa S, Tank DW, Menon R, et al. Intrinsic signal changes accompanying sensory stimulation: functional brain mapping with magnetic resonance imaging. Proc Natl Acad Sci U S A 1992;89: 5951–5955. 7. Hayes CE, Hattes N, Roemer PB. Volume imaging with MR phased arrays. Magn Reson Med 1991;18:309–319.
  • 59.