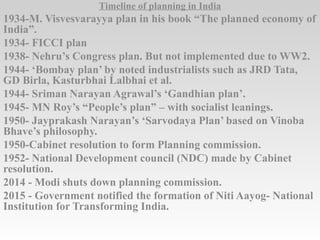
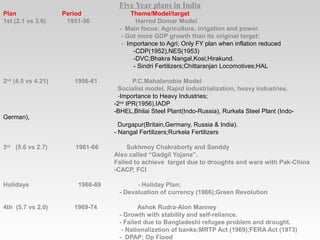
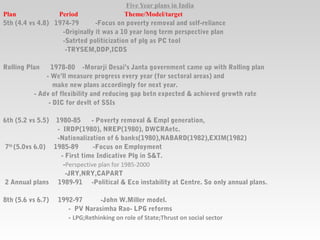
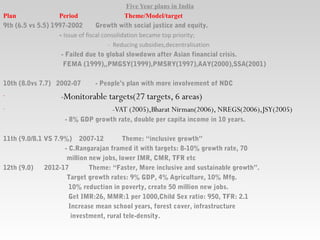
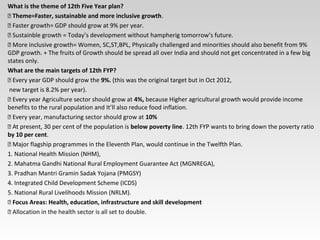
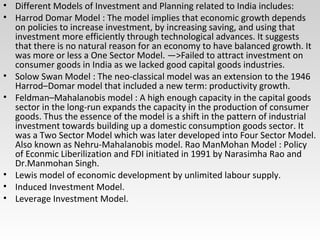
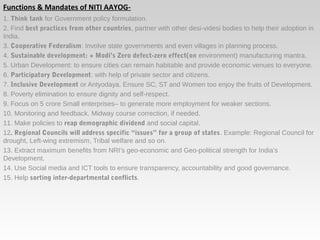
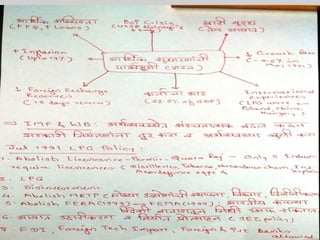
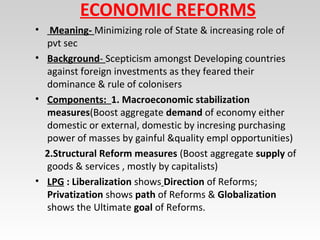
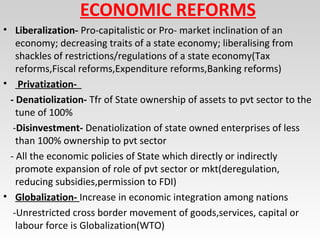
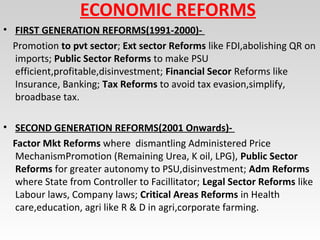
MPSC MAINS ECONOMY
INDIAN ECONOMY
-Syllabus & meaning of Concept
- Types & Process of Planning
- Historical aspects & Timeline of Plg
- Review of Five yr plans
- NITI Aayog
- 14th
Finance Commission
Timeline of planning in India
1934-M. Visvesvarayya plan in his book “The planned economy of
India”.
1934- FICCI plan
1938- Nehru’s Congress plan. But not implemented due to WW2.
1944- ‘Bombay plan’ by noted industrialists such as JRD Tata,
GD Birla, Kasturbhai Lalbhai et al.
1944- Sriman Narayan Agrawal’s ‘Gandhian plan’.
1945- MN Roy’s “People’s plan” – with socialist leanings.
1950- Jayprakash Narayan’s ‘Sarvodaya Plan’ based on Vinoba
Bhave’s philosophy.
1950-Cabinet resolution to form Planning commission.
1952- National Development council (NDC) made by Cabinet
resolution.
2014 - Modi shuts down planning commission.
2015 - Government notified the formation of Niti Aayog- National
Institution for Transforming India.
Five Year plans in India
Plan Period Theme/Model/target
1st (2.1 vs 3.6) 1951-56 Harrod Domar Model
- Main focus: Agriculture, irrigation and power.
- Got more GDP growth than its original target;
- Importance to Agri; Only FY plan when inflation reduced
-CDP(1952),NES(1953)
-DVC;Bhakra Nangal,Kosi;Hirakund.
- Sindri Fertilizers;Chittaranjan Locomotives;HAL
2nd
(4.5 vs 4.21) 1956-61 P.C.Mahalanobis Model
Socialist model, Rapid industrialization, heavy industries.
-Importance to Heavy Industries;
-2nd
IPR(1956),IADP
-BHEL,Bhilai Steel Plant(Indo-Russia), Rurkela Steel Plant (Indo-
German),
Durgapur(Britain,Germany, Russia & India).
- Nangal Fertilizers;Rurkela Fertilizers
3rd
(5.6 vs 2.7) 1961-66 Sukhmoy Chakraborty and Sanddy
Also called “Gadgil Yojana”.
Failed to achieve target due to droughts and wars with Pak-China
-CACP, FCI
Holidays 1966-69 - Holiday Plan;
- Devaluation of currency (1966);Green Revolution
4th (5.7 vs 2.0) 1969-74 Ashok Rudra-Alon Manney
- Growth with stability and self-reliance.
- Failed due to Bangladeshi refugee problem and drought.
- Nationalization of banks;MRTP Act (1969);FERA Act (1973)
- DPAP; Op Flood
Five Year plans in India
Plan Period Theme/Model/target
5th (4.4 vs 4.8) 1974-79 -Focus on poverty removal and self-reliance
-Originally it was a 10 year long term perspective plan
-Satrted politicization of plg as PC tool
-TRYSEM,DDP,ICDS
Rolling Plan 1978-80 -Morarji Desai’s Janta government came up with Rolling plan
- We’ll measure progress every year (for sectoral areas) and
make new plans accordingly for next year.
- Adv of flexibility and reducing gap betn expected & achieved growth rate
- DIC for devlt of SSIs
6th (5.2 vs 5.5) 1980-85 - Poverty removal & Empl generation,
- IRDP(1980), NREP(1980), DWCRAetc.
-Nationalization of 6 banks(1980),NABARD(1982),EXIM(1982)
7th
(5.0vs 6.0) 1985-89 -Focus on Employment
- First time Indicative Plg in S&T.
-Perspective plan for 1985-2000
-JRY,NRY,CAPART
2 Annual plans 1989-91 -Political & Eco instability at Centre. So only annual plans.
8th (5.6 vs 6.7) 1992-97 -John W.Miller model.
- PV Narasimha Rao- LPG reforms
- LPG;Rethinking on role of State;Thrust on social sector
Five Year plans in India
Plan Period Theme/Model/target
9th (6.5 vs 5.5) 1997-2002 Growth with social justice and equity.
- Issue of fiscal consolidation became top priority;
- Reducing subsidies,decentralisation
- Failed due to global slowdown after Asian financial crisis.
FEMA (1999),,PMGSY(1999),PMSRY(1997),AAY(2000),SSA(2001)
10th (8.0vs 7.7) 2002-07 - People’s plan with more involvement of NDC
- -Monitorable targets(27 targets, 6 areas)
- -VAT (2005),Bharat Nirman(2006), NREGS(2006),JSY(2005)
- 8% GDP growth rate, double per capita income in 10 years.
11th (9.0/8.1 VS 7.9%) 2007-12 Theme: “inclusive growth”
- C.Rangarajan framed it with targets: 8-10% growth rate, 70
million new jobs, lower IMR, CMR, TFR etc
12th (9.0) 2012-17 Theme: “Faster, More inclusive and sustainable growth”.
Target growth rates: 9% GDP, 4% Agriculture, 10% Mfg.
10% reduction in poverty, create 50 million new jobs.
Get IMR:26, MMR:1 per 1000,Child Sex ratio: 950, TFR: 2.1
Increase mean school years, forest cover, infrastructure
investment, rural tele-density.
What is the theme of 12th Five Year plan?
 Theme=Faster, sustainable and more inclusive growth.
 Faster growth= GDP should grow at 9% per year.
 Sustainble growth = Today’s development without hampherig tomorrow’s future.
 More inclusive growth= Women, SC,ST,BPL, Physically challenged and minorities should also benefit from 9%
GDP growth. + The fruits of Growth should be spread all over India and should not get concentrated in a few big
states only.
What are the main targets of 12th FYP?
 Every year GDP should grow the 9%. (this was the original target but in Oct 2012,
new target is 8.2% per year).
 Every year Agriculture sector should grow at 4%, because Higher agricultural growth would provide income
benefits to the rural population and It’ll also reduce food inflation.
 Every year, manufacturing sector should grow at 10%
 At present, 30 per cent of the population is below poverty line. 12th FYP wants to bring down the poverty ratio
by 10 per cent.
 Major flagship programmes in the Eleventh Plan, would continue in the Twelfth Plan.
1. National Health Mission (NHM),
2. Mahatma Gandhi National Rural Employment Guarantee Act (MGNREGA),
3. Pradhan Mantri Gramin Sadak Yojana (PMGSY)
4. Integrated Child Development Scheme (ICDS)
5. National Rural Livelihoods Mission (NRLM).
 Focus Areas: Health, education, infrastructure and skill development
 Allocation in the health sector is all set to double.
• Different Models of Investment and Planning related to India includes:
• Harrod Domar Model : The model implies that economic growth depends
on policies to increase investment, by increasing saving, and using that
investment more efficiently through technological advances. It suggests
that there is no natural reason for an economy to have balanced growth. It
was more or less a One Sector Model. —>Failed to attract investment on
consumer goods in India as we lacked good capital goods industries.
• Solow Swan Model : The neo-classical model was an extension to the 1946
Harrod–Domar model that included a new term: productivity growth.
• Feldman–Mahalanobis model : A high enough capacity in the capital goods
sector in the long-run expands the capacity in the production of consumer
goods. Thus the essence of the model is a shift in the pattern of industrial
investment towards building up a domestic consumption goods sector. It
was a Two Sector Model which was later developed into Four Sector Model.
Also known as Nehru-Mahalanobis model. Rao ManMohan Model : Policy
of Econmic Liberilization and FDI initiated in 1991 by Narasimha Rao and
Dr.Manmohan Singh.
• Lewis model of economic development by unlimited labour supply.
• Induced Investment Model.
• Leverage Investment Model.
Position Planning Commission NITI Aayog
Born - 1950, March 15th
2015, January 1st
Chairman - Prime minister PM
Vice Chairman - Last Dy.Chairman was Montek Singh Ahluwalia (Cabinet
minister rank).
Free market economist Arvind Panagriya. He was the Chief economist of Asian
Development bank, and the the brain behind Rajasthan’s land-labour reform.
CEO-Member-Secretary (IAS) Sindhushree Khullar
A secretary level bureaucrat with fixed tenure.
Same Ms. Sindhushree Khullar is the first CEO.
Ex officio members-Finance Minister & Planning minister
PM can nominate four-Union ministers. Modi has nominated following:
1. Home
2. Finance
3. Railway
4. Agriculture
Full time members- 4 to 7 full time members, who enjoy
“Minister of State” rank.
Bibek Debroy (Free market economist) &
Dr. V.K. Saraswat (technocrat, missile scientist and Ex-DRDO chief.)
SpecialInvitees-
Union ministers for
1. Transport
2. HRD
3. Social Justice
+PM can invite other experts as and when needed.
part-time members-Tech experts from research institutes.
Currently none declared. Rotational posts.
Governing Council- Chairman: Prime minister,Chief ministers
of all states,Lieutenant governors of all Union territories.
Ad hoc Regional Councils- Will have CMs of states that
fall in the region. They’ll be dealing with specific issue
concerning a group of states for example irrigation,
naxal-problem, infrastructure etc.
1. Think tank for Government policy formulation.
2. Find best practices from other countries, partner with other desi-videsi bodies to help their adoption in
India.
3. Cooperative Federalism: Involve state governments and even villages in planning process.
4. Sustainable development: + Modi’s Zero defect-zero effect(on environment) manufacturing mantra.
5. Urban Development: to ensure cities can remain habitable and provide economic venues to everyone.
6. Participatory Development: with help of private sector and citizens.
7. Inclusive Development or Antyodaya. Ensure SC, ST and Women too enjoy the fruits of Development.
8. Poverty elimination to ensure dignity and self-respect.
9. Focus on 5 crore Small enterprises– to generate more employment for weaker sections.
10. Monitoring and feedback. Midway course correction, if needed.
11. Make policies to reap demographic dividend and social capital.
12. Regional Councils will address specific “issues” for a group of states. Example: Regional Council for
drought, Left-wing extremism, Tribal welfare and so on.
13. Extract maximum benefits from NRI’s geo-economic and Geo-political strength for India’s
Development.
14. Use Social media and ICT tools to ensure transparency, accountability and good governance.
15. Help sorting inter-departmental conflicts.
Functions & Mandates of NITI AAYOG-
Niti Aayog: Criticism/Anti-Arguments
1.
Bibek Debroy (Fulltime member) himself criticized the vaguely worded press-release
on Niti-Aayog formation. Modi should have specfically pointed out its functions and
jurisdiction.
1. Modi’s “arbitrary decision” to dismantle the Planning Commission, without taking
NDC or states into confidence- this undermines cooperative federalism.
2. From union territory only Lieutenant Governors invited. CM of Delhi and
Puducherry can’t participate in Governing council.
3. Like PC, NITI Aayog too is a non-Constitutional, non-statutory body formed by a
cabinet resolution. It is not accountable to parliament, and if line-ministries fail to
achieve targets, NITI Aayog cannot punish them.
4. Niti Aayog should have been created through a legal/Constitutional amendment.
There should be a perspective plan spanning for 15 to 20 years. Otherwise, what if
another party comes into power and dismantles this.
5. It’ll take minimum 6-8 months for Niti Aayog to set things in motion. In between
that time, Development will be halted due to paucity of funds and ideas.
7. Planning commission and NDC decided “special category states” and gave them additional
funding to help the poor and backward regions. With advent of Niti Aayog, will those states
lose their ‘status’ and extra-funding?.Uncertainty prevails.
8. Niti Aayog will confict with Cabinet Secretariat (for inter-ministerial coordination) and
constitutional body Inter State Council (for coordination with states).
Niti Aayog: Criticism/Anti-Arguments
9. FinMin offcials always try to squeeze budget to keep the fiscal deficit under FRBM
targets. Niti Aayog and its free market economists will further reduce welfare schemes to
help them.
10. At present we’ve 60+ centrally sponsored schemes. Modi aims to combine them into
just 10 schemes. Thus, poor and marginalized communities will suffer.
11. Planning commission used to monitor of human development in the States, Sub-plans
for women, SC and ST. Niti Aayog doesn’t say how they’ll do it.
12. Niti Aayog’s mandate repeatedly says they’ll focus on manufacturing sector. Rajan says
“just because China succeeded on manufacturing focus, doesn’t automatically guarantee
that same Cinderella story will repeat here.”
13. Modi distributed the planning-Expenditure function to FinMin and subject matters to
respective ministries. This will result in loss of perspective and long-term view. Now State
governments will have to lobby at both type of ministries to get funds released.
14. Planning Commission’s Nehruvian Economists advocated decentralized planning.
Modi’s free market economists and technocrats will pursue centralized planning and e-
monitoring.
15. 1961: Indian Economic Service (IES) was born on Nehru’s initiative. Modi doesn’t invite
them in meetings, free market economists look down upon them with utter disdain. How
they’ll be integrated in the new system? No clear answers given in the press-release.
16. There is no need for any Planning commission or Niti Aayog. Good work can be done
even without them- through line ministries and interstate councils.
Anyways, the real work of NITI Aayog is yet to begin. So, most criticism is centred around
the theme that “Since press release doesn’t talk about xyz thing- so only bad thing will
happen.”. But, only time will tell how NITI Aayog fares in real life.
Five Year plans in India
Fourteenth Finance Commission
Appointed every five years the Finance Commission is a constitutional body with the broad mandate to define
centre – state federal relations. Its most important task is to recommend division of states’ revenues collected
by the Centre of the ‘divisibility pool’ between the Centre and the states and the share to be allocated to
each state.
The Fourteenth Finance Commission (FCC) submitted its recommendations to the Government
in December, 2014. Some of its important recommendations include the devolution of a
significantly higher share of 42 per cent of the divisible pool to states compared with the 32 percent share
recommended by the 13th Finance Commission.
Accordingly the total devolution to the states in 2015-16 is to be ₹ 5.26 lakh crores which is ₹1.78 lakh
crores more than the previous year. This is in response to the demand by the states for increased flow of
untied fiscal resources in place of tied resources that come with Centrally Sponsored Schemes.
Other recommendations by FCC concern GST, fiscal consolidation, road map and pricing of
public utilities, public expenditure management.
ECONOMIC REFORMS
• Meaning- Minimizing role of State & increasing role of
pvt sec
• Background- Scepticism amongst Developing countries
against foreign investments as they feared their
dominance & rule of colonisers
• Components: 1. Macroeconomic stabilization
measures(Boost aggregate demand of economic either
domestic or external, domestic by incresing purchasing
power of masses by gainful &quality empl opportunities)
2.Structural Reform measures (Boost aggregate supply of
goods & services , mostly by capitalists)
• LPG : Liberalization shows Direction of Reforms;
Privatization shows path of Reforms & Globalization
shows the Ultimate goal of Reforms.
ECONOMIC REFORMS
• Liberalization- Pro-capitalistic or Pro- market inclination
of an economy; decreasing traits of a state economy;
liberalising from shackles of restrictions/regulations of a
state economy
• Privatization-
- Denatiolization- Tfr of State ownership of assets to pvt
sector to the tune of 100%
-Disinvestment- Denatiolization of state owned
enterprises of less than 100% ownership to pvt sector
- All the economic policies of State which directly or
indirectly promote expansion of role of pvt sector or
mkt(deregulation, reducing subsidies,permission to FDI)
• Globalization- Increase in economic integration among
nations
-Unrestricted cross border movement of goods,services,
capital or labour force is Globalization(WTO)
ECONOMIC REFORMS
• FIRST GENERATION REFORMS(1991-2000)-
Promotion to pvt sector; Ext sector Reforms like
FDI,abolishing QR on imports; Public Sector Reforms to
make PSU efficient,profitable,disinvestment; Financial
Secor Reforms like Insurance, Banking; Tax Reforms to
avoid tax evasion,simplify, broadbase tax.
• SECOND GENERATION REFORMS(2001 Onwards)-
Factor Mkt Reforms where dismantling Administered
Price MechanismPromotion (Remaining Urea, K oil, LPG),
Public Sector Reforms for greater autonomy to
PSU,disinvestment; Adm Reforms where State from
Controller to Fascillitator; Legal Sector Reforms like
Labour laws, Company laws; Critical Areas Reforms in
Health care,education, agri like R & D in agri,corporate
farming.
ECONOMIC REFORMS
• THIRD GENERATION REFORMS-
Panchayat Raj Institutes, so that development reaches
grass root level; Factor of Inclusiveness
• FOURTH GENERATION REFORMS-
IT- enabled reforms
- Reforms is a simultaneous and continuos process and is a
mean to an end.
CURRENT AFFAIRS
 India to Appeal against WTO verdict on solar content usage-
India is set to file an appeal against a recent verdict by WTO on domestic solar content
usage. World Trade Organization has decided in favour of USA, ruling that Indian
domestic solar content requirements under its National Solar Mission programme
were inconsistent with the international trading norms.
The Indian government has set some conditions and rules stipulating a certain
minimum percentage of total capacity of solar content manufacturing to be sourced
from domestically assembled modules.
The U.S. had filed a case against India alleging discrimination against the USA solar
equipment with respect to India mandated sourcing of locally produced solar cells
and panels by offering subsidies and higher capital to entities using domestic
equipment and demanding level-playing field for domestic and foreign solar
component manufacturers.
Previously, Indian manufacturers had complained against USA alleging dumping in
India, which if pursued could have resulted in levying of high anti-dumping duties and
penalties against U.S. A. Committed to shielding its domestic manufacturing sector,
India is planning to appeal the said verdict of WTO.
FOURTH INDUSTRIAL REVOLUTION
‘Fourth Industrial Revolution’ or Industry 4.0 is the theme of the 2016 annual meet of World Economic Forum.
• It is a collective term embracing a number of contemporary automation, data exchange and manufacturing
technologies and denotes a fundamental change in the way business is being done in the present world.
• It is characterized by a wave of innovations and fusion of technologies that is blurring the lines between the
physical, digital, and biological spheres.
• New technology, increased connectivity, artificial intelligence etc. has changed the way any industry functions,
the consumer demand and the competition.
• The inexorable shift from simple digitization (the Third Industrial Revolution) to innovation based on
combinations of technologies (the Fourth Industrial Revolution) is forcing companies to re-examine the way they
do business.
 The First Industrial Revolution started in the 18th century with the use of water and steam power to mechanize
production.
 The Second in 19th century used electric power to create mass production.
 The Third began in the 1960s and used electronics and information technology to automate production.
 Now a Fourth Industrial Revolution is building on the third, that is, the digital revolution.
Challenges posed by Fourth Industrial Revolution
• Risk of greater unemployment especially low skilled ones has increased
• Sustainability of businesses especially small ones is under threat
• Disruptions in existing industries as new ways of serving needs are coming up.
• The innovators are improving the quality, speed and price of services at a much faster rate due to better access to
global digital platforms for research, development, marketing, sales, and distribution.
• Growing transparency and consumer engagement would demand more adaptation from the companies.
• IT security issues
• It also affects the governance system as well.
GARV APP
Why in News?
 Power ministry has launched the GARV (Grameen Vidyutikaran) app to
provide the first hand information with respect to village electrification
programme in the country.
Key Highlights:
 To speed up the work related to village electrification Grameen Vidyut
Abhiyantas (GVAs or rural electrification engineers) have been appointed.
 Reports by these GVAs are shared through the GARV (Grameen
Vidyutikaran) app with officials as well as the public.
Significance
 It will help in monitoring the work of power ministry and respective
state authorities by the common man.
 The GARV app puts pressure on State governments for timely and
quality delivery.
 This is very good step towards better accountability and transparency in
ensuring village electrification.
 It also gives an opportunity to media to scrutinize the rural electrification
work of ministry/state governments and seek accountability.
SETU BHARTAM PROJECT
 The project aims to make all national highways
free from railway level crossings by 2019.
 Under the project, 208 bridges will be built at a
cost of Rs 20,800 crore.
 Also, 1,500 old bridges will be reconstructed,
which will cost Rs 30,000 crore.
 The ministry has also established an Indian
Bridge Management System (IBMS), the aim of
which is to carry out condition survey of all
bridges (approx. 1,50,000) by using mobile
inspection units.
 The Project is thought to not only improve road
safety but also allow for faster transportation and
improve infrastructure network
CURRENT AFFAIRS
Lok Sabha passed Real Estate (Regulation and Development) Bill, 2015-
Main highlights of the Bill
• The Bill seeks to regulate transactions between buyers and promoters and provides for setting up of state level
regulatory authorities.
• It also provides for registration of promoters and agents with the authorities.
• The promoters are mandated to deposit 70 percent of the money collected from buyers in a separate bank account, to
be used only for construction of that project.
• They will also have to disclose project information including details of the promoter, land status, status of approvals,
agreements along with details of real estate agents and contractors.
• Projects under construction are also required to be registered with the RERA.
• If builders cause delays in transferring properties to buyers, the appellate tribunal would intervene and slap fines on
them within 60 days. In case consumers fail to make payments to developers, the appellate tribunal can fine them, too.
• It provides for imprisonment of up to three years in case of promoters and up to one year in case of real estate agents
and buyers for any violation of orders of Appellate Tribunals or monetary penalties or both.
• The builders would also be responsible for fixing structural defects for five years after transferring the property to a
buyer.
• Buyers will now be paying only for the carpet area and not the super built-up area.
• The developers will now have to take consent of 66 per cent of the homebuyers in case they have to increase the
number of floors or change the building plans. This will protect the buyers from any ad-hoc changes that are a norm
presently.
• Projects only below the size of 500 square meters are exempted from the accountability ambit compared to earlier
1000 square meters or 12 apartments.
-The real state sector is the second largest employer after agriculture and contributes 9% to the Gross Domestic Product
(GDP).
CURRENT AFFAIRSLok Sabha passes National Waterways Bill-
The National Waterways Bill, 2015, which provides for declaring certain inland
waterways as national waterways, was passed by the Lok Sabha recently. The bill
seeks to declare 106 additional inland waterways as national waterways. After the
inclusion of 106 additional inlands waterways to the existing five national
waterways, the total number of national waterways goes upto 111.
The Bill repeals the five Acts that declare the existing national waterways. These
five national waterways are now covered under the Bill.
Significance of this Bill:
Inland waterways, comprising rivers, lakes, canals, creeks and backwaters, extend
about 14,500 km across the country. However, potential of this mode of transport
has not been fully exploited so far.
The Statement of Objects and Reasons of the Bill states that while inland waterways
are recognised as a fuel efficient, cost effective and environment friendly mode of
transport, it has received lesser investment as compared to roads and railways. Thus,
the central government has come up with this policy.
It should be noted here that under the Union List of the Seventh Schedule of the
Constitution, the central government can make laws on shipping and navigation on
inland waterways which are classified as national waterways by Parliament by law.
CURRENT AFFAIRSSingapore pips Mauritius as India’s top FDI source
Singapore has replaced Mauritius as the top source of foreign direct
investment (FDI) into India during the first half of the current financial year.
According to the recently released data from the Department of
Industrial Policy and Promotion (DIPP), during April-September 2015, India
has attracted $6.69 billion (Rs 43,096 crore) FDI from Singapore while from
Mauritius, it received $3.66 billion (Rs 23,490 crore). Foreign investment
from Singapore was $2.41 billion in the year-ago period.
Sectors that attracted the highest foreign investment during April-
September 2015 include computer software and hardware ($3.05 billion),
trading ($2.30 billion), services and automobile ($1.46 billion each) and
telecommunications ($659 million).
Foreign investment is crucial for India, which needs about $1 trillion by
March 2017 to overhaul infrastructure such as ports, airports and
highways, and to boost growth.
Question: Which the international non-governmental organization released a report named “An Economy for the
One Percent” on the global economic inequality?
(a) Oxford
(b) Oxfam
(c) IBRD
(d) IMF
Ans (b)
Related facts:
 On 18 January 2016, Oxfam an international non-governmental organization released a report named “An
Economy for the One Percent” on the global economic inequality.
 The report analyzed growing trends of concentration of wealth across the world and suggested remedies to
correct the anomaly.
 According to the report richest 1% now has more wealth than the rest of the world combined. Power and
privilege is being used to skew the economic system to increase the gap between the richest and the rest.
 In 2015, just 62 individuals had the same wealth as 3.6 billion people. This figure is down from 388 individuals as
recently as 2010.
 According to the report the wealth of the richest 62 people has risen by 44% in the five years since 2010 – that's
an increase of more than half a trillion dollars ($542bn), to $1.76 trillion.
 According to Oxfam since the turn of the century, the poorest half of the world’s population has received just
1% of the total increase in global wealth, while half(99%) of that increase has gone to the top 1%
 The average annual income of the poorest 10% of people in the world has risen by less than $3 each year in
almost a quarter of a century. Their daily income has risen by less than a 1% every year.
 The name Oxfam comes from the Oxford Committee for Famine Relief, founded in Britain in 1942, it has
distributed food among affected women and children in the Second World War.
Question: What was the theme of World Development Report released -2016 released on 14 January 2016?
(a) Risk Management
(b) Climate change
(c) Digital Dividend
(d) Transition Economies
Ans (c)
Related facts:
 On January 14, 2016 World Bank had released the World Bank World Development Report -2016.
The theme of this year report is “Digital Dividend”.
 The report is helpful in understanding impact of the internet, mobile phones, and related technologies
on economic development across the world.
 According to the report, more than 40 percent of the world's population has access to Internet.
 In the past decade, the number of Internet users has increased more than threefold it has been increased
from 1 million in 2005 to 3.2 billion at the end of 2015.
 China has the largest number of internet users, followed by the United States, with India, Japan, and Brazil
filling out the top five.
 The lowest mobile penetration is in Sub-Saharan Africa (73 %), against 98 percent in high-incomecountries.
 According to the report internet adoption lags behind considerably, only 31% of the population in
developing countries had access in 2014, against 80 percent in high-income countries.
 Out of world's 3.2 billion Internet users, 1.1 million people use high-speed Internet.
 The benefits of digital technologies filter throughout the economy, For businesses, the internet promotes
inclusion of firms in the world economy by expanding trade, raises the productivity of capital, and intensifies
competition in the marketplace, which in turn induces innovation.
 Three main mechanisms to transmit the digital dividend are described as inclusion, efficiency and
innovation.
Q.1) Which of the following initiative has not been covered under the
Bharatmala Project?
a) Construction of roads along India’s borders and coastal areas
b) Improving connectivity of nonmajor
ports, religious and tourist places
c) Development of newly declared national highways in district headquarters
d) Improving connectivity by inland waterways
Ans d
Bhartmala is an ambitious roads and highways project of the NDA government. It
involves construction of roads and highways to India’s borders, coastal areas, ports,
religious and tourist places as well as over 100 district
headquarters. It will involve construction of around 25000 km of road network.
Following states will have road construction under this-Gujarat, Rajasthan, JnK,HP,
Uk, borders of UP and Bihar near Terai region, Sikkim, Assam, Arunachal Pradesh and
upto Indo-Myanamar border in Manipur and Mizoram. Linking with this, road network
from Maharashtra to Bengal along the coastal areas will be built.
Funding of this will be done mainly by govt itself and rest through PPP model.
Benefits are huge, it will be a strong strategic component with respect to national
security, act as a multiplier effect in our economy, provide backward and forward
linkages to the markets, connect remote mountainous areas, trade and tourism will
boost and generation of huge employment. Major challenge is just of environment
clearances and land acquisition.
INDIAN ECONOMY
- Infrastructure and basic aspects
- Updates on Infrastructure related schemes
- Details of PPP Model
• RURAL & URBAN INFRASTRUCTURE DEVELOPMENT-
 Need
 Types- Physical/ Economic & Social
 Energy: Renewable & NRE; Concept of Sustainable Devlt
 RGGVY (2005)- ‘Electricity to One lac villages & One Cr Households
 DDUGJY(2015)- 24x7 Rural Electricity; Separate feeders; Metering
 100 % village electrification to be achieved by 1 May 2018 (Budget
2016-17)
 NSM (2010)- Targets of Solar Energy-
481 MW(2012);1000MW(2013);20000MW(2022);100000MW(2030);
200000 MW (2050).
 WTO Dispute of solar appliances with USA.
 GARV App- Rural electrification updates.
 Concept of Akshay Urja- 20 Aug(Akshay Urja Din);Concept of Akshay
Urja(NCE); 87000 MW by 2022.
 Problems of Energy Sector- Poor quality coal;Inadequate utilization
of Hydroelectricity projects;Scope for NCE resources; Plutonium
based FBR to be developed instead of Uranium based PHWR which
requires import of Uranium.
 FDI- 100% allowed in production, transmission & distribution
• RURAL & URBAN INFRASTRUCTURE DEVELOPMENT-
 Roads- Arteries of infra;Types;Need to develop
 Timeline- NHAI(1988)-NHDP(1998)-PMGSY(2000)-PMBJPY(2004)-
Bharat Nirman(2006)
 Issues- Quality, Funds, No of vehicles
 Bharatmala Project; Sagarmala Project
 PPP models; Swiss challenge
 Rlwys*- Cross subsidization; 100% FDI in Rail Infra,
 Sethu Bharatam Project-( aims to make all national highways free
from railway level crossings by 2019.)
 Bullet train (Mumbai- Ahmedabad) based on Japanese Shinkansen
system of bullet trains; 98000 Cr
 Shipping & Port- 5 Inland Waterways ( Ganga, Brahmaputra,
Mahanadi, Bunkingham canal, Champakara canal + 106 new National
Waterways bill(2015) passed.
 Airports- Greenfield & Brownfield Projects.
 Social Infra- Already discussed in HRD capsule.
• RURAL & URBAN INFRASTRUCTURE DEVELOPMENT-
 Rural Infra – Electricity (DDUGJY); Roads( PMGSY);
Sanitation(SBM); General (Bharat Nirman, Sansad Adarsh Gram
Yojana, RURBAN, PURA)
 Urban Infra- JNNURM, AMRUT, Smart City, Tourism( PRASAD,
HRUDAY); RERA Act
Union Budget 2016-17
Road Sector
• Sanction for construction of 10000 kms of new National Highways will be given in
2016-17. This will be much higher than in the two previous years.
• In addition, nearly 50000 kms of State highways will also be taken up for
upgradation as National Highways.
• Policy reforms to Fast-track the development of road sector.
Ports
• 450 crore rupees were allocated for Sagar Mala Project in 2016-17.
• New greenfield ports will be constructed both in the eastern and western coasts of
the country.
• 800 crore rupees were allocated for the development of this sector including
development of National Water Highways.
Civil Aviation
• The Government will announce a comprehensive action plan for revival of
unserved and underserved airports in the country.
• At present, there are about 160 airports and air strips with State Governments
which can be revived at an indicative cost of 50 crore to 100 crore each. The Union
Government will partner with the State Governments to develop some of these
airports for regional connectivity.
• Similarly, 10 of the 25 non-functional air strips with the Airport Authority of India
will also be developed.
• .
• ( )
• ,
• ( )-
• ,, , .
•
.
• ( )
•
RAIL BUDGET 2016-17
Theme of the Budget is Overcoming challenges – Reorganize, Restructure, Rejuvenate
Indian Railways: ‘Chalo, Milkar Kuch Naya Karen’.
Railway Budget of 2016-17 is based on three pillars and they are Nav Arjan (New
Revenues), Nav Manak (New Norms) and New Sanrachna (New Structures).
Major Highlights of the Rail Budget
• Delay in running of 95% trains will be ended by 2020
• Rail tickets will be available at all places by 2020
• Aimed at increasing speed of passenger train by 80km/hr
• LIC has agreed to invest 1.5 lakh crore rupees over 5 years on extremely favourable terms
• New Dedicated Freight Corridors announced, namely Delhi-Chennai, Kharagpur-Mumbai,
Kharagpur-Vijayawda.
• To commission broad gauge lines at the rate of 7 km per day against 4.5 km over last five
years
• Institutional financing will be introduced for funding projects
• Aimed at eliminating unmanned level crossings by 2020
• North-East India, especially Mizoram and Manipur, to be connected through broadgauge soon
• To commission 2800 km of new tracks in 2016-17
• Indian Railways to surpass ambitious target of commissioning 2500 kms of broad
gauge lines, almost 30% higher than last year
• e-ticket facility for foreign debit and credit card holders will be provided
• Cancellation facility through 139 helpline number will be provided
• Journalists to get facility of e-booking of tickets on concessional passes
• Bar-coded tickets will be introduced on pilot basis, this will help to tackle menace of ticketless
CURRENT AFFAIRS
• Overnight double-decker trains to be introduced on business travel routes
• Long distance superfast train Antyodaya Express for unreserved passengers will be launched
• Deen Dayal coaches for long distance trains for unreserved passengers will be
introduced
• Full-fledged Railway University will come-up soon
• Enhanced capacity of e-ticketing system from 2000 tickets/min to 7,200/min.
• A framework will be formulated where net saving from electrification will be ableto finance capital
expenditure.
• Wi-Fi will be provided at 400 railway station in 2016-17, as compared to 100 in 2015-16
• 2000 km of electrification proposed for 2016-17
• Chennai will have India’s first rail auto hub. Railway Ministry will partner with Tamil Nadu Government to
develop suburban network in Chennai through innovative financing methods
• FM radio stations will be invited to provide train borne entertainment via PA systems
• Rail Bandhu magazine will be published in all regional languages
• Coolies have been renamed and will be called ‘Sahayaks’
• 50 crore rupees kept aside for providing innovation grants to start-ups
• Drones will be used for remote monitoring of ongoing projects
• 33 percent sub-quota for women under all reserved categories
• Advertising revenue to be increased by more than four times in 2016-17
Golden vs. Diamond quadrilateral
PPP in Airport
start / rebuild
something where
start / rebuild
something where
PPP Model
- Definition
- Charactristics
- Types
- Pros & Cons
- Swiss challenge
3 roles of Government in INFRA.
Development?
PPP Model
-The first BOT was for the China Hotel, built in 1979
by the Hong Kong listed conglomerate Hopewell
Holdings Ltd.
Types- 1.BOT (build–operate–transfer)
2.BOOT (build–own–operate–transfer)
3.BOO (build–own–operate)
4.BOLT (build–own-lease–transfer)
5.DBFO (design–build–finance–operate)
6.DBOT (design–build–operate–transfer)e.g. Refinery construction
7.DCMF (design–construct–manage–finance)
8. JV
9.MC
PPP Model
BOO (build–own–operate)-
In a BOO project ownership of the project remains
usually with the project company for example a
mobile phone network. Therefore, the private company
gets the benefits of any residual value of the project. This
framework is used when the physical life of the project
coincides with the concession period. A BOO scheme
involves large amounts of finance and long
payback period. Some examples of BOO projects come
from the water treatment plants. This facilities run by
private companies process raw water, provided by the
public sector entity, into filtered water, which is after
returned to the public sector utility to deliver to the
customers.
PPP Model
BOLT (build–own-lease–transfer)
Under BLT a private entity builds a complete project and
leases it to the government. On this way the control over
the project is transferred from the project owner to a
lessee. In other words, the ownership remains by the
shareholders but operation purposes are leased. After
the expiry of the leasing the ownership of the asset and
the operational responsibility are transferred to the
government at a previously agreed price. For foreign
investors taking into account the country risk BLT
provides good conditions because the project company
maintains the property rights while avoiding
PPP Model
DBFO (design–build–finance–operate)-
Design–build–finance–operate is a project delivery
method very similar to BOOT except that there is no
actual ownership transfer. Moreover, the contractor
assumes the risk of financing till the end of the
contract period. The owner then assumes the
responsibility for maintenance and operation
PPP Model
DCMF (design–construct–manage–finance)
Some examples for the DCMF model are the prisons or
the public hospitals. A private entity is built to design,
construct, manage, and finance a facility, based on the
specifications of the government. Project cash flows
result from the government's payment for the rent of
the facility. In the case of the hospitals, the government
has the ownership over the facility and has the price
and quality control. The same financial model could be
applied on other projects such as prisons. Therefore,
this model could be interpreted as a mean to avoid new
indebtedness of public finance.
• MAHARASHTRA ECONOMY: SALIENT FEATURES
Agriculture
Although Maharashtra is a highly industrialized state of India, agriculture continues to be the
main occupation in the state. 64.14% of the people are employed in agriculture and allied
activities.
Most of the cultivable land is still rainfed, the Southwest Monsoon season between June and
September is critical to the food sufficiency and quality of life in the state. Therefore, the
agricultural calendar of Maharashtra and other parts of India, is governed by Monsoon. Any
fluctuations in the time distribution, spatial distribution or quantity of the monsoon rains may
lead to conditions of floods or droughts causing the agricultural sector to adversely suffer. This
has a cascading effect on the secondary economic sectors, the overall economy, food inflation
and therefore the overall quality and cost of living for the general population. Districts in
Western Maharashtra on the Deccan plateau such as Pune and Ahmadnagar are particularly
prone to drought.
 Irrigation facilities are being extended so that agriculture could be made less dependent upon
rain water. Maharashtra has by far the largest number of Dams in India. Despite that, the net
irrigated area totals only 33,500 square kilometres or about 18% of cultivable land.
 Principal Monsoon crops include Rice, jowar, and Bajra. Other crops include Wheat, pulses,
vegetables and onions. The main Cash crops include cotton, sugarcane, turmeric, and several oil
seeds including groundnut, sunflower and soyabean.
 The state has huge areas, under fruit cultivation of which mangoes, bananas, grapes, and
oranges are the main ones. Most of the Growers of Cash crops such as sugarcane and cotton in
the state belong to farmers cooperatives. For example, most of the sugar production in
• MAHARASHTRA ECONOMY: SALIENT FEATURES
• Industry
 Maharashtra is India's leading industrial state contributing 13% of national industrial
output.
• Almost 46% of the GSDP is contributed by industry.
• Maharashtra has had a long History in textiles and Mumbai was the original home of India's
textile mills. Solapur, Ichalkaranji, Malegaon and Bhiwandi are some of the cities known for
textile industry today .
• Sugar industry has made considerable progress specially in the cooperative sector.
Maharashtra is well known for the development of cooperative sugar industry whereby the
farmers acquire a share in the sugar mills.
• Pharmaceuticals, petrochemicals, heavy chemicals, electronics, automobiles, engineering,
food processing, and plastics are some of the major industries in the state.
• Maharashtra is renowned for the production of three-wheelers, jeeps, commercial vehicles
and cars, synthetic fibers, cold rolled products and industrial alcohol. Small scale industries
have also come up in a big way in the state.
• The state capital Mumbai and the Mumbai Metropolitan Region has historically been the
most industrialized area in the state. Industrial development in the state is largely
concentrated in the, Pune Metropolitan Area , Nashik, Aurangabad and Nagpur.
• The six important industries in the state are cotton textiles, chemicals, machinery,
electricals, transport and metallurgy. Pune is emerging as one of the largest automobile
hubs in the country.
• To attract industries to different areas of the state, the government of Maharashtra
established Maharashtra Industrial Development Corporation (MIDC) in 1962.
• MIDC provides businesses with infrastructure such as land (open plot or builtup spaces),
roads, water supply, drainage facilities etc. To date 233 areas have been developed around
the state with emphasis on different sectors such as Industrial, IT, Pharmaceutical, and
Wine.
 India's largest stock exchange Bombay Stock Exchange, oldest
in Asia, is located in the city. More than 41% of the S&P CNX
500 conglomerates have corporate offices in Maharashtra.
 After successes in the information technology in the
neighbouring states, Maharashtra has set up software parks
in Pune, Mumbai, Navi Mumbai, Nagpur and Nasik,
Aurangabad and Latur.
• Maharashtra is the second largest exporter of software with
annual exports of 18 000 crores and accounts for more than
30 per cent of the country's software exports, with over
1,200 software units based in the state.
 Maharashtra ranks first nationwide in coal-based thermal
electricity as well as nuclear electricity generation with
national market shares of over 13% and 17% respectively.
Maharashtra is also introducing Jatropha cultivation and has
started a project for the identification of suitable sites for
Jatropha plantations.
FDI IN MAHARASHTRA
• Based on DIPP report (2000-2015 data),Gujarat has emerged as the best state to
do business, but it is Maharashtra that receives the most foreign direct investment
(FDI), followed by the National Capital Region (NCR) of Delhi, Tamil Nadu (and
Pondicherry) and Karnataka.
• Delhi (including parts of UP and Haryana, likely those that fall within the NCR)
accounts for one-fifth (20%) of the total FDI, next only to Maharashtra (including
union territories like Dadra & Nagar Haveli and Daman & Diu) with 29% of total
FDI, based on cumulative inflows (April 2000 – Jun 2015), according to the June
2015 report of the Department of Industrial Policy and Promotion (DIPP).
• Maharashtra is ranked eighth in the ease-of-doing-business ranking. The state,
however, leads in obtaining approvals for infrastructure-related utilities and
enforcing contracts related to dispute resolution.
• Gujarat was ranked first regarding ease of doing business, according to the
Assessment of State Implementation of Business Reforms by the Department of
Industrial Policy and Promotion (DIPP), based on a study conducted by World Bank
and KPMG.
• The assessment report has also highlighted the reason for the government to
come out with the report: India ranks 142nd out of 189 economies in the World
Bank’s Doing Business 2015report and the second-worst-performing economy in
South Asia. The World Economic Forum’s Global Competitiveness Reportranks
India as 71 out of 144 economies.
MAKE IN INDIA/MAKE IN MAHARASHTRA WEEK(13-18 Feb)
• 8 lac cr investment; 30 lac new employment & 2594 MOUs
for Maharashtra.(15.2 lac cr for India)
• Participants nations-102 & 17 states; Visitors-9 lac
• Maharashtra related important agreements- 1.Twin Star
Tech(Vedanta Gr) in Marathwada/ Vidarbha 2000 cr- LCD Fab
Project 2. Coca Cola for Oranges processed products 3.
Raymonds at Nagpur developing Integrated Textile Project
(1400 Cr) 4. Monsanto biggest seed hub of India at Deolgaon
Raja(Buldhana)
• Naina Project at Khalapur & 3500 Hectare land by farmers.
• Magnetic
• Arcarobot Warehousing software by Rajesh Manpat
• Ease of Doing Business- Maitri for projects above 100 cr
DROUGHT IN MAHARASHTRA• Maharashtra is experiencing drought this year too. Why does this happen every year?
• For this, we need to understand the geographical and climatic situation of
Maharashtra. As high as 80% to 84% of the agriculture in Maharashtra is rainfed, which
means that it totally depends on rainfall for its crops but there is a huge variability in
rainfall in different regions of the state.
• One-third of the state falls under the semi-arid climatic zone and has its agriculture
dependent on the monsoons. Deficient rainfall is reported once every 5 years and
drought conditions occur once every 8-9 years.
• Marathwada and Vidarbha have been experiencing severe drought over the last three
years due to deficient rainfall and this has further worsened the situation with a drastic
drop in groundwater levels, acute water shortages and severe loss of crops during the
kharif and rabi seasons.
• Despite this happening over and over again, the irrigation in the state is very low at
16% as compared to the national average of 42%. Over-dependence on private sources
of groundwater use such as tube wells, bore wells, wells and piped water, limits access
of farmers to water resources and has also led to over exploitation and severe drop in
groundwater levels in the area.
• Thus, the major problem in this area is the lack of assured water supply as no other
methods of irrigation are utilised. Rather, irrigation is more developed in western
Maharashtra as compared to Vidarbha and Marathwada, which needs it the most. Both
regions continue to remain relatively backward in terms of socio-economic indicators as
well.
DROUGHT IN MAHARASHTRA• Is it due to geography, climate change or mismanagement of resources?
Geography is a factor that we know about for a long time. Climate change has worsened the situation over the
last few years, but what is more worrying is the lack of planning, short sightedness and pure disregard shown
for the situation at the policy level. The vulnerable situation of the area is already known, but we still depend
on dams for water, which goes to the farmers at a price.
• What will the small and marginal farmers do? We still focus on water-intensive crops like sugarcane. for
better and assured money. The poor farmer is forced to practice an agricultural model ,based on demand and
supply where he is unable to get an output that is at least equal if not more than what he put in. Development
of industries and cities have also put an additional load on water resources from dams, which in many cases
are diverted to cities. The farmer is thus caught in a web of unending demands and a maze of circumstances
from where there is no way out.
What is the actual situation of farmers in the area? Who are the ones committing suicide?
We have to understand the situation of a farmer in a broader context. Our policies have not looked at the
overall development of farming communities. Our farmers in the area are totally dependant on land for their
livelihoods. It is only a few farmers that also have other members in the family working in the cities, who can
provide additional income to the family in times of crisis. And farming is a resource intensive process. You
need money to buy seeds, fertilisers, pesticides, water, manpower, electricity. You put in all the money for
resources and then depend on the rain and climate to do their bit. When the vagaries of climate take their
toll, the farmer has no way out. He is then caught in the loan web to sow the next crop for the next season.
• Take the example of Vidarbha where cotton, tur and soyabeans are the important crops. Low levels of
groundwater and irregular supply of electricity makes it very difficult for farmers. There is only 4% irrigation in
an area where the capacity for irrigation can be as high as 65%. So the farmers have to invest in tube wells,
wells and pipelines in an area which already has dangerously low levels of groundwater. So why then does
farming become unremunerative? It is this emphasis on cash crops, overdependence on monsoons, low
productivity, poor irrigation facilities and dependence on wells in an area where the water tables have
already gone down coupled with poor electrification, which makes it very difficult for the farmer.
DROUGHT IN MAHARASHTRA• After changes in worldwide policies in 1991, privatisation and free economy have changed banking practises. Banks are not
very eager to give loans to farmers. The poor and marginal farmers thus fall into the clutches of moneylenders, who charge
higher rates of interest, which the farmers are unable to repay.
• With no guarantee of a good crop even during the next season within the limitations they have to face, the farmers continue to
borrow from money lenders as they get money on demand. Getting loans from banks and cooperatives often takes long and
they have to go through agents at times, who demand commissions.
What should be done to deal with this situation?
Long term plan- with focus on agri and farmer
• For example:
• Policies need to be designed to improve the education and quality of life of the farmers and their households along with
improvement in infrastructural facilities at the village level. Developing other additional skills or income generating
activities among farmers should also be encouraged to make them better equipped to cope with uncertainties arising out of
cultivation.
• Improvement in bank lending mechanisms that help and respect the farmers and provide support and training should be
encouraged, rather than banks functioning as structures that treat the farmer as a poor victim that needs loan waivers.
• Non institutional lending mechanisms like moneylenders should be brought under regulation so that they stop charging the
farmers high rates of interest that increase the risk of farmers of falling into debt traps.
• Efforts need to be made to improve irrigation facilities in rural areas and to stop emphasis on dams. Farmers must be
encouraged to harvest and use water in their own areas sustainably and equitably. Local streams, canals in the villages should
be identified, deepened and widened to enhance harvesting of water. Rivers should be considered as important units of the
village and revived.
• Development should be targeted at the village and towards small groups of farmers as units to bring about real change. In our
country, farmers suicides have happened due to the failure of the cooperative movement.
• For cash crops like sugarcane, grapes and other fruits, cotton, tur and soyabeans, the crop insurance has to be strengthened.
Innovative methods for loan settlement should be developed to help farmers to cope in times of financial crisis.
• Dependence of farmers on seeds from manufacturers and fertilisers must be stopped by encouraging development of local
seed grower families, development of organic local fertilisers and pesticides and further development in products by using
Ayurveda rather than using technologies based on western models.
• We should encourage research and development that can aid our farmers such as better weather predicting systems,
knowledge generation that is based on the day to day needs and queries of farmers. We should encourage better dialogue
between agriculturalists and farmers who can work together to find solutions to problems.
•
DROUGHT IN MAHARASHTRA
• Jalyukta Shivar Abhiyan-
• Drought free Maharashtra by 2019; Long term solution
to address both drinking water and irrigation problems.
• To make 5000 villages water scarcity free every year.
• Involves deepening and widening of strams,
construction of cement & earthern stop dams, work on
nallahs and digging of farm ponds.
• Nodal Offr- DM at Dist level
• Criteria for evaluation as accepted during Delivering
Change Foundation(DCF) and Pemandu (Performance
Management & Delivery Unit of Malaysia).
• PMKSY; PMFBY-
DROUGHT IN MAHARASHTRA
• Maharashtra has the maximum number of
big dams of any state in India (35 percent of the
total), the most expenditure on big dams (40
percent of the total) since Independence with the
least amount of cropped area under irrigation (18
percent). But the state has nine effectively
"toothless" Acts governing water and irrigation.
This lack of water governance may explain the
paradox of a state with the largest dam
infrastructure facing water scarcity and drought.
MSME SECTOR
MSME
• Small and medium enterprises are the backbone of
industrial development.
• It is very important for both developed and developing
country .Small and medium enterprises always represented
the model of economic development, which emphasized high
contribution to domestic production, significant export
earnings, low investment requirements, employment
generation, effective contribution to foreign exchange
earning of the nation with low import-intensive operations.
• The development of this sector came about primarily due to
the vision of our late Prime Minister Jawaharlal Nehru who
sought to develop core industry and have a supporting
sector in the form of small scale enterprises.
Introduction……..
• SMEs sector has emerged as a dynamic and vibrant sector of the
economy. The Indian economy is expected to grow by over 8 per cent
per annum until 2020 and can become the second largest in the world,
ahead of the United States, by 2050, and the third largest after China
and the United States by 2032.
• Hence the need of important contribution from MSME.
• Importance of MSME- 8% GDP; 40% of exports; 45% of Industrial output
Definition of MSME
• According to new THE MICRO, SMALL AND MEDIUM
ENTERPRISES DEVELOPMENT ACT, 2006 the MSME
Definitions are as follows: In the case of the enterprises
engaged in the manufacture or production of goods
pertaining to any industry specified in the first schedule to
the Industries (Development and Regulation) Act, 1951, as
Definition of MSME for Manufacturing sector
Manufacturing Sector
Enterprises Investment in plant & machinery
Micro Enterprises Does not exceed twenty five lakh rupees
(< 25 LAC)
Small Enterprises More than twenty five lakh rupees but does not
exceed five crore rupees
(25 LAC TO 5 CR)
Medium Enterprises More than five crore rupees but does not
exceed ten crore rupees
(5 CR- 10 CR)
Definition of MSME for Service sector
Service Sector
Enterprises Investment in plant & machinery
Micro Enterprises Does not exceed ten lakh rupees
(<10 LAC)
Small Enterprises More than ten lakh rupees but does not
exceed two crore rupees (10 LAC to 2 Cr)
Medium Enterprises More than two crore rupees but does not
exceed five core rupees ( 2Cr to 5Cr)
Supporting agencies of SMEs
• Some of the important organizations that are associated with SMEs in
India are: Small Industries Development Organization (SIDO), National
Small Industries Corporation Ltd. (NSIC), Small Industries Development
Bank of India (SIDBI), Confederation of Indian Industry (CII), Laghu Udyog
Bharti (LUB), Federation of Indian Chamber of Commerce and Industry
(FICCI), Associated Chamber of Commerce and Industry of India
(ASSOCHAM), National Institute of Small-Industry Extension Training
(NISIET), World Association for Small and Medium Enterprises (WASME),
Small Scale Industries Board (SSIB), PHD Chamber of Commerce and
Industry (PHDCCI), Federation of Indian Exporters Organization (FIEO),
Federation of Associations of Small Industries of India (FASII)
• ROLE OF MSME & ITS SIGNIFICANCE-
• Micro, Small and Medium Enterprises (MSME) sector has emerged as a
highly vibrant and dynamic sector of the Indian economy over the last five
decades.
• MSMEs not only play crucial role in providing large employment
opportunities at comparatively lower capital cost than large industries but
also help in industrialization of rural & backward areas, thereby, reducing
regional imbalances, assuring more equitable distribution of national
income and wealth. MSMEs are complementary to large industries as
ancillary units and this sector contributes enormously to the socio-
economic development of the country.
• Employment Generation: Small Business sector in India creates largest
employment opportunities, next only to Agriculture. It has been estimated
that a lakh rupee invested in fixed assets in the sector results in
generating employment for four persons.
• Production: Small Business sector play a crucial role in the growth of the
country by accounting for 45% of the gross manufacturing output. As per
estimates, a lakh rupee of investment in fixed assets in the sector
produces 4.62 lakh worth of goods or services.
• The Sector consisting of 3.6 cr units, as of today, provides
employment to over 8.05 cr persons. The Sector through more than
6,000 products contributes about 8% to GDP besides 45% to the total
manufacturing output and 40% to the exports from the country. The
MSME sector has the potential to spread industrial growth across the
country and can be a major partner in the process of inclusive
growth.
• MSME- CRUCIAL ROLE- (i)With 3.6 crore units spread across the
country, that employ 8.05 crore people, MSME have a contribution of
37.5 per cent to the country’s GDP.(ii) Huge potential for helping
address structural problems like unemployment, regional
imbalances, unequal distribution of national income and wealth
across the country. Due to comparatively low capital costs and their
forward-backward linkages with other sectors, MSMEs will play a
crucial role in the success of the Make in India initiative. (iii)
Number of schemes/programmes like the Prime Minister’s
Employment Generation Programme (PMEGP), Credit Guarantee
Trust Fund for Micro and Small Enterprises (CGTMSE), Credit
Linked Capital Subsidy Scheme (CLCSS) for and promote start-ups
for innovation and entrepreneurship in rural and agriculture- based
industry.
MSMEs share by sector
Sector wise MSME
Activity wise MSME
• Khadi is the proud legacy of our national freedom movement and the father of
the nation. Khadi and Village Industries (KVI) are two national heritages of
India. One of the most significant aspects of KVI in Indian economy is that it
creates employment at a very low per capita investment. The KVI Sector not
only serves the basic needs of processed goods of the vast rural sector of the
country, but also provides sustainable employment to rural artisans. KVI
today represent an exquisite, heritage product, which is ‘ethnic’ as well as
‘ethical’. The Sector has a potentially strong clientele among the middle and
upper echelons of the society.
• Coir Industry is an agro-based traditional industry, which originated in the
state of Kerala and proliferated to the other coconut producing states like
Tamil Nadu, Karnataka, Andhra Pradesh, Odisha, West Bengal, Maharashtra,
Assam, Tripura, etc. It is an export oriented industry and has greater potential
to enhance exports by value addition through technological interventions and
diversified products like Coir Geotextiles etc. The acceptability of Coir products
has increased rapidly due to its ‘environment friendly’ image.
• Ministry of Micro, Small & Medium Enterprises (M/o MSME) envisions a
vibrant MSME sector by promoting growth and development of the MSME
Sector, including Khadi, Village and Coir Industries, in cooperation with
concerned Ministries/Departments, State Governments and other
Stakeholders, through providing support to existing enterprises and
encouraging creation of new enterprises.
• On 9 May 2007, subsequent to an amendment of the Government
of India (Allocation of Business) Rules, 1961, erstwhile Ministry of
Small Scale Industries and the Ministry of Agro and Rural
Industries were merged to form the Ministry of Micro, Small and
Medium Enterprises (M/o MSME). This Ministry now designs
policies and promotes/ facilitates programs, projects and schemes
and monitors their implementation with a view to assisting
MSMEs and help them to scale up.
• The primary responsibility of promotion and development of
MSMEs is of the State Governments. However, the Government
of India, supplements the efforts of the State Governments
through various initiatives. The role of the M/o MSME and its
organisations is to assist the States in their efforts to encourage
entrepreneurship, employment and livelihood opportunities and
enhance the competitiveness of MSMEs in the changed economic
scenario.
• The schemes/programmes undertaken by the Ministry and its organizations
seek to facilitate/provide:
• (i) adequate flow of credit from financial institutions/banks;
• (ii) support for technology upgradation and modernization;
• (iii) integrated infrastructural facilities;
• (iv) modern testing facilities and quality certification;
• (v) access to modern management practices;
• (vi) entrepreneurship development and skill upgradation through
appropriate training facilities;
• (vii) support for product development, design intervention and packaging;
• (viii) welfare of artisans and workers;
• (ix) assistance for better access to domestic and export markets; and
• (x) cluster-wise measures to promote capacity-building and empowerment
of the units and their collectives.
The opportunities of growth in the SMEs sector
• 1. Less Capital Intensive
• 2. Extensive Promotion & Support by Government
• 3. Reservation for Exclusive Manufacture by small scale sector
• 4. Project Profiles
• 5. Funding - Finance & Subsidies
• 6. Machinery Procurement
• 7. Raw Material Procurement
• 8. Manpower Training
• 9. Technical & Managerial skills
• 10. Tooling & Testing support
• 11. Reservation for Exclusive Purchase by Government
• 12. Export Promotion
• 13. Growth in demand in the domestic market size due to overall
economic growth
• 14. Increasing Export Potential for Indian products
Factors affecting SMEs
• MSMEs in India face several problems such as-
1. lack of availability of adequate and timely credit
2. High cost of credit
3. inadequate infrastructure facilities like power, water and
roads, and lack of access to modern technology.
4. limited access to equity capital
5. problems in supply to government departments and agencies
6. procurement of raw materials at a competitive price
7. Issues of storage
8. Designing, packaging and product display
MSME’s Contribution to Exports
They may also be in the form of export orders from large units or the
production of parts and components has shown excellent growth rates in this
decade.
The product groups which dominate the exports comprises of sports goods,
readymade garments, woollen garments and knitwear, plastic products,
processed food and leather products. Further, MSMEs are re-orienting its
export strategy towards the new trade regime being ushered in by the WTO.
 NEW INITIATIVES-
• Udyog Aadhar Memorandum (UAM):
- The UAM scheme, which was notified in September 2015 under section 8 of
the MSME Development Act 2006, is a pathbreaking step to promote ease
of doing business for MSMEs.
- On self-certification basis and no supporting documents - instantly get a
unique Udyog Aadhaar Number (UAN)
• Employment Exchange for Industries:
To facilitate match making between prospective job seekers and employers
an employment exchange for industries was launched on June 15, 2015 in
line with Digital India.
• Framework for Revival and Rehabilitation of MSMEs: Under this
framework, which was notified in May 2015, banks have to constitute a
Committee for Distressed MSME enterprises at zonal or district level to
prepare a Corrective Action Plan (CAP) for these units.
• A scheme for Promoting Innovation and Rural Entrepreneurs
(ASPIRE): ASPIRE was launched on March 16, 2015 with the objective of
setting up a network of technology centres and incubation centres to
accelerate entrepreneurship and promote start-ups for innovation and
entrepreneurship in rural and agriculture based industry.
• In order to protect, support and promote small enterprises as also to help them become self-supporting,a
number of protective and promotional measures have been undertaken by the Government. This job is taken
up by both centre and state governments. There is separate ministry for MSMEs which helps in following way.
• 1. Reservation – Reservation of products for exclusive manufacture in the small scale sector was introduced
for the first time in 1967 with the reservation of 47 items. As of July 2010, 20 items are reserved for exclusive
manufacture in the small scale sector.
• 2. Government has ‘procurement policy’ which prefers SSI – 358 items are also reserved for exclusive
purchase from MSE sector.
• 3. Interest Subvention schemes are started from time to time.
• 4. Technology Upgradation Fund Scheme – under this subsidy is available to small and medium scale industry
to adopt new technology. Subsidy is available either on Capital Expenditure, or as interest Subvention.
• 5. Export Assistance & Facilities – In certain cases duty free or with concessional rate of Custom Duty, so as to
ensure higher production for exports.
• There were less restriction for exports by this sector and overall various supporting facilities such as remission
of duties paid on input materials were available.
• Exporters are recognized as Export House, Trading Houses, Star Trading Houses and Super Star Trading Houses
on the basis of certain criteria as laid down in the Export-Import Policy 1997-2002.
• Criteria are quantitative targets, such as turnover or FOREX earned. For Small Scale Sector their respective
figures are considered 3 times the actual. By this they are granted special import license, which gives them
rebate on import duty.
• 6. They get government support for participation and exhibition in International Fairs
• 7. Technical & Managerial Consultancy Services to the MSME manufacturers/exporters is provided through a
network of field offices
• 8. The National Small Industries Corporation through its ‘export development program’ is playing a vital role
to promote the MSME sector in exporting their products/projects in international, markets by providing
following assistance to the small enterprises.
• 9. These schemes are Small Scale Industry specific and are available in addition to the general schemes
- -2016, -2016, -2016, /-2015 .
• (, ) . MSME .
• , �, , , , , , ,.
• Feb, 2006 () , 2015 241 SEZ Proposals 3.59 .
SEZ
• A Special Economic Zone (SEZ) is a territory within a country with
special rules for facilitating Foreign Direct Investment for export
oriented production, and for purposes of trade and custom duties
i.e. ‘DUTY FREE ENCLAVES’.
• An SEZ is a geographically demarcated region that has economic
laws that are more liberal than the country’s typical economic
laws and where all the units therein have specific privileges (World
Bank)
• EXIM policy defines SEZ as specifically delineated duty-free
enclaves and shall be deemed to be foreign territories for the
purpose of trade operations and duties and tariffs.
• The concept dates back to thirteenth century Spain and in more
recent times late 1950’s and early 1960’s to Ireland and Puerto
Rico, which established Economic Processing Zones. In the early
1980’s one of the earliest and an exemplary Special Economic
Zone ‘Shenzen’ was founded by the government of the Republic
of China under Deng Xiaoping. Recently, Puno in Peru has been
earmarked to become a “Zona Economica”. In the United States,
SEZs are referred to as “Urban Enterprise Zones”.
Indian Set-Up
• To comprehend the development of SEZ in India one needs to
dwell on the stages of its formation. India adopted a mixed
economy after independence. In the year 1950, import
substitution was the focus. Foreign trade as a stimulant to
economic growth was overlooked and inward looking
industrialization was emphasized. The economic policies of
1960’s were geared towards selective import liberalization
and export promotion, thus marking the development of
Export Processing Zone’s (EPZ’s) in the country. The first EPZ
in India which was also the first in Asia was set up at Kandla in
1965.
• In India, the Santa Cruz Electronics Export Processing Zone
(SEEPZ), was set up at Mumbai in 1974. SEEPZ was initially
planned as a single product zone but by 1986 it was made a
two product zone providing for gems and jewellery along with
processed electronic goods.
• Export Oriented Units (EOU) were introduced in the year 1981
which gives customs duty exemption but not tax exemptions.
• In the year 1984,emphasis was on growth led export
and thus, four more zones were set up in the mid-
eighties at NOIDA (NEPZ, Uttar Pradesh), Chennai
(MEPZ, Tamil Nadu),Cochin (CEPZ, Kerala), and Falta
(FEPZ, West Bengal) and the seventh EPZ in the country
was commissioned at Vishakhapatnam (VEPZ, Andhra
Pradesh) in 1994. These aimed to provide export
facilities with better infrastructure such as telecom,
water and power. But the financial incentives were not
attractive and bureaucratic red tape hurdles
continued.
• In the year 1998, the first private SEZ was implemented
in Surat. In 2003-04, four new SEZ; Mahindra World City
in Jaipur and Chennai, Indore and Manikanchan were
created,thereby initiating the development of SEZ in full
swing.
• Salient Features of SEZ
• As per the SEZ Act, 2005, SEZ in India can be set up by the private sector,state
government or joint sector (state sector and private). This offers equal
opportunity to both Indian and International private developers.
• The country is divided into two territories with Special Economic Zones and
Domestic Tariff Area (DTA). The area outside of SEZ is DTA,where laws of the
country are applicable. On the other hand, in the SEZ the laws and controls of the
country may be applicable only partially as they are lead by special laws. Goods
flow from DTA into the SEZ area are treated as exports and goods coming from
SEZ area into DTA are treated as imports.
• SEZ are of three types:-
• a) Multi-product SEZ – occupying minimum of 1000 ha of land,
• b) Sector specific SEZ – occupying minimum of 100 ha of land,
• c) Gems and Jewellery, IT-ITES – BPO’s and Biotech – SEZ occupying 10 ha of land
(may be reduced to 4 ha in special cases). Backward states have the option of
relaxation of minimum size of SEZ.
• The basic approval of the SEZ lies with the commerce ministry. There is a provision
for hundred per cent foreign direct investment (FDI) for all investments in SEZ’s
except activities under negative lists. But there is no relaxation for pollution
control laws and labour laws. The local regime on these subjects will be enforced.
States are required to exempt the electricity duty and sales tax on electricity as
well as remove all controls on electricity generation and sale within the SEZ.
Private generation, transmission and distribution of power in SEZ are allowed.
Developers are even permitted to build roads, airports etc as per their
requirement.
• TYPES OF SEZ
• 1. ON THE BASIS OF SECTOR
• Sector Specific: Manufacture one or more goods in particular sector.
• Render one or more services in particular sector.
• Multi-Product SEZ: Manufactures multiple goods in one sector or
• multiple sectors.eg Trading and Warehousing. Render two or more services in a sector or multiple sectors.
• 2. ON THE BASIS OF AREA
• Processing area: Where SEZ units can be located for the manufacture of goods or rendering of services.
• Non-processing area: Which is intended to provide support facilities to the SEZs processing area facilility.
• 3. ON THE BASIS OF ACTIVITY
• Manufacturing SEZ: Apparel, Garments and leather, Automobile and
• Auto-component, Engineering-light, heavy and application,
• Pharmaceutical, Food processing, Telecom equipment, Computer
• Hardware, and Microelectronics, Consumer Electronics and
• Appliances, Gems and Jewellery and Diamonds.
• Service SEZ: IT enabled Services, Biotechnology, R&D, Health Care,
• Financial Services, Knowledge Services, Entertainment, Leisure and
• Recreation, Sports and Related Activity, Organised Retail Business
• Services Conventional and Exhibitions, Warehousing and Trade
• Related Services.
• 4. ON BASIS OF APPROVAL STATUS
• Formally approved: Given when land is available to set up the SEZ
• In principle: Given when the land has not yet been secured but all other
• criteria are fulfilled.
• Notified: Final stage after which physical development work begins
• Special Economic Zone is one or more areas of a country where the tariffs
and quotas are eliminated and bureaucratic requirements are lowered so
that more companies are attracted to the area. The companies establishing
in the area also gets extra incentives for doing business.
• In India, the policy for setting up SEZ was introduced on April 1, 2000 with a
view to provide an internationally competitive and hassle free environment
for exports. The policy offered setting up of SEZ in the public, private, joint
sector or by State Governments. Prior to Special economic zones, Expert
processing Zones (EPZ) were in vogue. With a view to overcome the
shortcomings experienced on account of the multiplicity of controls and
clearances(SEZ provides ‘single window clearance’), absence of world-class
infrastructure, an unstable fiscal regime and with a view to attract larger
foreign investments in India, the Special Economic Zones (SEZs) Policy was
announced in April 2000. For all specified procedural purposes Special
Economic Zones are considered foreign territory within the country.
Domestic trade with SEZ is generally eligible for export concessions.
• For IT industry there are similar Software Technology Parks . Benefits are
available to Export Oriented Units under separate Scheme.
• Export Promotion Capital Goods Scheme – Scheme allows import capital
goods at zero or concessional custom duty, provided importer exports
specified goods of value not less than 6 times duty saved
• What is an SPV?
• . In the USA, the term used is special purpose entity (SPE). The name SPV is given to an entity which is formed for a single, well-
defined and narrow purpose. An SPV can be formed for any lawful purpose. No SPV can be formed for an unlawful purpose, or
for undertaking activities which are contrary to the provisions of law or public policy. An SPV is, primarily, a business association
of persons or entities eligible to participate in the association. According to Joy Jain of PricewaterhouseCoopers, an SPV is
mainly formed to raise funds by collateralising future receivables.
• Is there a difference between a special purpose vehicle and a company?
• SPVs are mostly formed to raise funds from the market. Technically, an SPV is a company. It has to follow the rules of
formation of a company laid down in the Companies Act. Like a company, the SPV is an artificial person. It has all the attributes
of a legal person. It is independent of members subscribing to the shares of the SPV. The SPV has an existence of its own in the
eyes of law. It can sue and be sued in its name. The SPV has to adhere to all the regulations laid down in the Companies Act.
Members of an SPV are mostly the companies and individuals sponsoring the entity.
e.g. SPV for Turkmenistan-Afghanistan-Pakistan-India (TAPI) pipeline project. Cabinet has also granted permission to GAIL
(India) to join the SPV. The Dubai-based SPV, TAPI Ltd., will scout for consortium leader, who will develop and operate the
project, arrange finances and be accountable for safe supply of gas through the pipeline.
What is an SPV? What is the difference between a company and an SPV? How an SPV is set up? What are the benefits of
creating an SPV? What is an SPV? SPV is the acronym for Special Purpose Vehicle which is also called Special Purpose Entity. An
SPV is primarily a business association of persons or entities eligible to participate in the association meant for a single, well-
defined and narrow lawful purpose. No SPV can be formed for an unlawful purpose, or for undertaking activities which are
contrary to the provisions of law or public policy. An SPV is very similar to a company which is mainly formed to raise funds by
collateralizing future receivables. What is the difference between a company and an SPV? Although both these entities are
established as per Company Act and also follow the all the regulations in the Company Act, the difference lies in the purpose.
The company, as distinguished from an SPV, may be called a general purpose vehicle. A company may do several things which
are mentioned in the memorandum of association (MoA) or permitted by the Companies Act. An SPV may also do the same,
but its scope of operation is limited and focused. The MoA is quite narrow in the case of an SPV. This is primarily to provide
comfort to lenders who are concerned about their investment. How an SPV is set up? An SPV is set up with the help of its
promoter(s) or sponsor(s). The sponsoring company diverts some of its assets from the rest of the company into an SPV. This
isolation of assets creates a distance b/w the SPV and the sponsoring company which is important as it provides comfort to
investors by almost insulating the SPV from the ups and downs of the originating entity. What is significant here is the distance
b/w the sponsoring company and the SPV. In the absence of adequate distance b/w the sponsor and the new entity, the later
will not be an SPV but only a subsidiary company. A good SPV should be able to stand on its feet, independent of the sponsoring
company. Unfortunately, this does not happen in practice.
What are the benefits of creating an SPV? The key advantage is that it helps in separating the risk and freeing up the capital. As
a result, the SPV and the sponsoring company are protected against risks like insolvency, which may arise during the course of
operation. The SPV also allows securitization of assets without disturbing the managerial relationship. Under the arrangement,
any predictable income stream generated by secure assets can be securitized.
•
• Special Investment Regions (SIR)
• Special Investment Region (SIR) is a concept similar to Special Economic Zone. However, this
is a unique term applied in the territory of one of the states in India called Gujarat.
• The Gujarat government has enacted a legal framework for the SIR –
The Gujarat Special Investment Region Act – 2009(GSIR -2009) which has come into effect
from 6th January, 2009.
• SIR refers to an existing or proposed Investment Region with an area of more than 100 sq.
Kms or Industrial Area with an area of 50-100 sq. Kms declared so by the Government of
Gujarat under Section 3 of the Gujarat Special Investment Region Act – 2009 .
• By giving SIR status, Gujarat Government proposes to develop the investment region
/industrial area as global hubs of economic activity supported by world class
infrastructure, premium civic amenities, centres of excellence and proactive policy
framework.
• Here "Economic Activity" is defined in the GSIR Act to mean the activities and services
including but not limited to industrial, manufacturing, commercial, financial, processing,
packaging, logistics, transport, tourism, hospitality, health, housing, entertainment, research
and development, education and training, information and communication, management
and consultancy, corporate offices and the activities and services connected therewith or
incidental thereto and other economic activities as the Apex Authority may specify;
• While Special Economic Zones are primarily developed by private parties, the Gujarat
Government may set up or designate Government agencies including companies formed
under the Companies Act, 1956 as the project development agencies and assign them the
powers and functions relating to project Development of a Special Investment Region.
• Only Gujarat Government is empowered to establish, develop, operate and regulate the
Special Investment Regions (SIR).
• An Investment Region or Industrial Area declared as a SIR may be known with the name of
its location or its predominant economic activity.
• 5.0 Strategies:
• The State has entered into the phase of second generation economic reforms, with emphasis on structural changes in addition to fiscal incentives for the promotion of industry and balanced regional growth.
This has coincided with increasing international competition and rapid technological changes, which pose new challenges for industry. The Industrial Policy 2001 set out below has been formulated in this
context, keeping in view the objectives of sustained growth and employment and an expansion in livelihood opportunities. It supplements the provisions of the Information Technology and other sectoral
policies announced earlier. The components of the new Package Scheme of Incentives contained in this Policy will be operative from 1st April, 2001 upto 31st March, 2006:
• 5.1 Strategies:
• New industries establishing in C, D, and D+ areas an No-Industry District(s) will be exempted from payment of Electricity Duty for a period of 15 years. In other parts of the State, 100% Export Oriented Units
(EOUs), Information Technology (IT) and Bio-Technology (BT) units, and industries setting up in Special Economic Zones (SEZs), and Electronic Hardware Technology Parks will be exempted from payment of
Electricity Duty for a period of 10 years.
• 5.2 Waiver of Stamp Duty and Registration Fees: At present, IT units in
• Waiver of Stamp Duty and Registration Fees: At present, IT units in public IT Parks are exempted from stamp Duty and Registration fees upto 31st March 2006. Now all new industrial units (including IT and BT
units) and expansions, will be exempted from payment of Stamp Duty and Registration fees up to 31st March 2006 in C, D and D+ areas and No-Industry District(s). However, 50% of the Stamp Duty and
Registration fees will be waived for IT units set up in other IT Parks in talukas/areas in the State in "A" and "B" categories.
• 5.3 Octroi Refund:
• The scheme of refund of octroi provided under the Package Scheme of Incentives, 1993 will be included in the new Scheme up to 31-3-2006 on the same pattern. Where account-based cess or other levy is
charged instead of or in lieu of octroi, such change will also be eligible for refund as in the case of octroi.
• 5.4 Incentives to SSI units:
• The subsidy will be disbursed in equal annual instalments over 5 years. Existing SSI and small-scale IT and BT units will be eligible for 75% of the subsidy admissible as above for expansion, diversification or
modernization involving additional investment to the extent of 25% or more.
• 5.4.2 Interest Subsidy to new textile, hosiery and knitwear SSI units: New textile, hosiery and knitwear small-scale industries setting up indifferent parts of the Start will also be eligible for Interest Subsidy on
the interest actually paid to the financial institution/bank on the term loan for creating fixed capital assets, equal to the interest payable at 5% per annum as stated in the table below. The monetary ceiling will
be applicable for the complete period of eligibility.
5.5 Development of non-conventional energy:In order to give an impetus to the development of non-conventional energy, such projects will be eligible for benefits under the new Package Scheme of
Incentives.
• 5.6 Classification of talukas/areas:The present classification of different talukas/areas in the State in A, B, C, D and D+ categories on the basis of their level of development is contained in the Package Scheme
of Incentives, 1993, and will continue for the present. The matter of revision of the area classification will be separately considered by a Committee under the Chairmanship of the Minister (Industries). Norms
for the mid-term reclassification of talukas depending on changes in their development status will also be considered, and No Industry District(s) will be separately categorized.
• 5.7 Financing of capital incentives and refunds under the Package Scheme:A budgetary provision of at least Rs. 200 crores will be made each year from 2001-2002 onwards to meet past commitments and the
incentives under the new Scheme. Additional resources will also be raised through bonds linked with Sales Tax repayments under past Schemes.
• 5.8 Exemption from Sales Tax for Khadi & Village Industries:24 khadi and village industries are exempt from Sales Tax up to certain limits on annual turnover. Considering the potential of this sector for
employment generation and rural industrialization, Sales Tax will also be waived in respect of the 72 remaining industries for their turnover up to Rs. 20 lakhs pr annum. This concession would be available to
khadi and village industry units registered with and assisted by the Maharashtra State Khadi and Village Industries Board.
• 5.9 Sales Tax on IT products:Up to 31st March, 2006, the Sales Tax rates on IT products would be maintained at the level of the minimum floor rates, wherever applicable. No turn-over tax, additional Sales Tax,
surcharge or any other additional levy related to Sales Tax shall be applied to IT products.
• 5.10 Sick SSI units:Issues relating to the rehabilitation of sick SSI units are reviewed in the State-Level Inter Institutional Committee and Sub Committee of the Reserve Bank of India, and in the District Level
Committee which have been set up as an adjunct of the Zilla Udyog Mitras. Sick SSI units taken up for re-schedulement of arrears of Government and electricity dues, to be repaid in 36 monthly installments at
13% interest. The interest rate on the rescheduled arrears will now be reduced to 10%, in all except 'A' areas of the State. The repayment of such arrears would be allowed in 60 monthly installments.
• 5.11 Stamp Duty on Corporate Restructuring:The stamp duty for demerger of companies as defined under section 2(19-AA) of Income Tax Act, 1961 will be made applicable on lines of the stamp duty structure
applicable for amalgamation of companies under every order made by the High Court under section 394 of the Companies Act, 1956.
• 5.12 Establishment of IT/BT units on textile mill lands in Greater Mumbai:while granting permission for the sale of textile mill lands in Greater Mumbai, the lands becoming available to the Maharashtra
Housing and Area Development Authority (MHADA) for residential use would also be permitted to be used for the development of IT and BT industries by MHADA itself, or by MIDC.
• 5.13 FSI for IT Units:Twice the admissible Floor Space Index (FSI) is allowed for certain types of IT units setting up in IT Parks promoted by public bodies. Such units are also permitted in No-Development Zones
of cities up to FSI of 0.2. Such IT units will now be permitted to establish in No-Development Zones with an enhanced FSI of 1.0.
• 5.14 New Industrial Townships:Maharashtra pioneered the establishment or institutions of democratic decentralizations and local self-governance several decades ago. More recently, these concepts were
extended through statutory amendments to enable the establishment of independent Industrial Townships. In the first phase, self-governing Industrial Townships with the power to raise resources and
determine their application will be established in industrial areas being developed by MIDC at twelve locations across the State, i.e. at Vile-Bhagad (Raigad), Airoli (Thane), Talegaon (Pune), Hinjewadi - Man
(Pune), Shendre (Aurangabad), Additional Latur (Latur), Nandgaon Peth (Amravati), Additional Yavatmal (Yavatmal), Tadali (Chandrapur), Butibori (nagpur), Additional Sinnar (Nashik) and Nardhana (Dhule). The
industrial townships so set up will pay 25% of their revenue to the concerned Gram Panchayat(s) or local bodies for the initial period of 5 years.
• 5.15 Special Economic Zones:The establishment of Special Economic Zones has been allowed under the recent policy of Government of India. India's most successful Export Processing Zone (SEEPZ), which was
promoted by the State Government at Mumbai nearly three decades ago, has been converted into one of the country's first Special Economic Zones. Another Special Economic Zone is being developed by the
City and Industrial Development Corporation (CIDCO) at Dronagiri, near the Jawaharlal Nehru Port. All the concessions, benefits and facilities extended to such Special Economic Zones promoted by public bodies
will also be extended to Special Economic Zones set up by other parties. The establishment of Special Economic Zones at Aurangabad and Nagpur will also be proposed to the Government of India.
• 5.16 Specialized Industrial Areas:In the last few years, specialized industrial infrastructure has been developed by State agencies for various sectors, including Information Technology, leather, chemicals, etc.
More recently, the establishment of textiles and food processing zones have been taken up. Taking into account the potential and requirements of agro-industry in different parts of the State, MIDC will set up
new complexes for this sector, including 'Grape Wine Parks' at Nashik and Sangli, 'Orange City Park' for orange processing, Floriculture Complexes and Biotechnology Parks at suitable locations.
• 5.17 Promotion of Education and Research Institutions:Educational and research institutions of international or national standards, including world-class business education institutions, would be provided
land in industrial areas/estates at nominal or concessional rates.
• 5.18 Captive Power Generation:Captive power generation is permitted for industries throughout the State in respect of IT units, and in the case of co-generation, hydroelectric power and non-conventional
energy. Other types of captive power generation are at present permitted in respect of new industries in D+ and tribal areas. New as well as existing industries in D and D+ areas and No Industry District(s) will
also be permitted to set up captive power plants. Public bodies or joint ventures promoted by them can establish 'Independent Power Producers' for the dedicated provision of power to IT and BT Park and
special Economic Zones promoted by them.
• 5.19 Gas Cooperation Agreement:Gas is an important fuel and raw material for industry. As Mumbai High gas supply declines, commercial supply of LNG will become increasingly important for industrial units.
To facilitate the planned development of gas supply infrastructure in the State, the Gas Authority of India Limited (GAIL), MIDC and the Maharashtra Petrochemicals Corporation Limited (MPCL) have recently
•
• 1995 .
•
• . . . , , , , .
•
• . . . .
•
• . .
•
• , . . , .
•
• , , , . . .
•
• , , .
•
• .
•
• . . .   . , .
. . .
. ( )
( ) .
• :
• .
. , , , , , , , , , , , , , , .
• . .
.
( ),
.  
. , .
.
•         
97 19 (1) ( )
. 43 ( )
,
.
•   1960
14.2.2013 . 13.8.2013 1960 .
• .
• 2-, .
• 24-  , .
• 27- .
• 73CA- 146 147 /.
• 73CB- .
• 75- .
• 79- .
• 83-   6 ( 3 ) .
• 88-   ( 6 ) .
• 97th amendment aimed at autonomy &
transparency in cooperative sector.
• Managing committee for 5 yrs instead of 3 yrs
• Max cap on strength of a committee members is
21.
• Compulsory 2 women & 2 expert coopted
members.
• Recovery officer from Office of Registrar,
Cooperative societies for defaulters action.
ECO SURVEY DATA
• As on 31st March, 2015 there were about 2.26 lakh co-operative societies
in the State, with about 539.30 lakh members.
• Primary Agricultural Credit Societies (PACS) provide short-term agricultural
credits mainly for seasonal agricultural operations. PACS also include
Farmers Service Societies and Adivasi Co-operative Societies. As on 31st
March, 2015, about 55.2 per cent PACS were in loss.
• Dr. Punjabrao Deshmukh Interest Rebate Scheme
• Interest subsidy is given to motivate farmers for timely repayment of the
short term crop loan. Under this scheme, three per cent interest subsidy is
given for the loan up to ` one lakh and one per cent interest subsidy is given
for loan amount exceeding ` one lakh but less than ` three lakh. The farmer
has to repay the loan by 30th June of each year .
• The State provides financial assistance to societies for setting up agro-
processing units. Co-operative sugar factories, cotton ginning & pressing,
spinning mills, handloom & powerloom, dairy societies & dairy unions and
fisheries societies are the major constituents of agro-processing co-
operatives.
• Members in agro-processing cooperatives-Sugar factories (53%), Dairy
(22%),Spinning mills (11%), Fisheries(7%)....
ECO SURVEY DATA
• Sugar Factories- Of the total sugar factories in the country, 33 per cent are located
in the State followed by 22 per cent in Uttar Pradesh. As on 31st March, 2015, out
of the total sugar production in the country, the share of State was 37 per cent
followed by 25 per cent of Uttar Pradesh.
• Dairy sector- At the end of March, 2015, there were 24,762 co-operative dairy
societies and 88 co-operative dairy unions in the State. About 43 per cent co-
operative dairy societies and about 51 per cent dairy unions were in loss.
• Co-operative marketing societies have a three-tier organisational structure. The
Maharashtra State Co-operative Marketing Federation Ltd. is the apex body. The
District Co-operative Marketing Societies and the Primary Co-operative Marketing
Societies are functioning at district and village level respectively. About 36 per cent
co-operative marketing societies were in loss at the end of March, 2015 as
compared to 39 per cent at the end of March, 2014 .
• Non-agri credit societies- As on 31st March, 2015, there were 517 urban co-
operative banks, 14,577 urban co-operative credit societies and 7,232 salary
earners’ co-operative credit societies in the State. About 22 per cent of the total
non-agricultural credit societies were in loss.
• Out of the 1,583 total urban co-operative banks in the country, 32 per cent are
located in the State. As on 31st March, 2015, in all 109 banks in the State are under
liquidation. The Deposit Insurance Credit Guarantee Corporation has approved
reimbursement of deposits up to one lakh (in insured banks) and the disbursement
for 102 banks is in process, one bank has made appeal to GoI and the process for
submitting claims of remaining banks is in progress.
• ,: , . , , , , , . . , MNC , ,, . . , , , . .
Timeline
• During the British rule , Nicholson a British Officer in India suggested to
introduce Raiffersen model of German agricultural credit Cooperatives in
India. As a follow-up of that recommendation, the first Cooperative Society
Act of 1904 was enacted to enable formation of "agricultural credit
cooperatives" in villages in India under Government sponsorship. With the
enactment of 1904 Act, Cooperatives were to get a direct legal identity as
every agricultural Cooperative was to be registered under that Act only. The
1904 Cooperative Societies Act, was repealed by 1912 Cooperative
Societies Act which provided formation of Cooperative societies other than
credit. Under 1919 Administrative Reforms act , Cooperatives was made a
provincial subject making each province responsible for Cooperative
development. In 1942, the British Government enacted the Multi-Unit
Cooperative Societies Act, 1942 with an object to cover societies whose
operations are extended to more than one state. The impulses of the Indian
freedom movement gave birth to many initiatives and institutions in the
post independence era in India and armed with an experience of 42 years in
the working of Multi Unit Cooperative Societies and the Multi-Unit
Cooperative Societies Act, 1942, the Central Government enacted a
comprehensive Act known as Multi State Cooperative Societies
Act,1984,repealing the Act of 1942.
Timeline
• The Co-operative Societies Act, which was passed in
1904 envisaged the formation of village credit
societies. In 1912, the Act was amended to enable
formation of other types of societies for activities
relating to sale, purchase, production, housing etc. This
Act also provided for the creation of federations of
primary societies and for supervision, audit, mutual
control and overall development of the co-operative
movement. In 1919, the subject of co-operation was
transferred to the provinces and most of the provinces
enacted their own laws to regulate the working of co-
operative societies. To give a stimulus to the co-
operative movement, the Government of India set up
an Agricultural Credit Department in the Reserve Bank
of India with a view to providing financial assistance
and credit to the co-operatives.
Problems of sugar industries• PROBLEMS OF SUGAR INDUSTRY IN MAHARASHTRA
• In India sugar industry is a second largest agro-based industry with over 600 operating
sugar mills across India, about 50 million sugarcane farmers and a large number of
agricultural labourers are involved in sugarcane cultivation and ancillary activities.
Maharashtra state is the one of the biggest sugarcane production state in India. Sugar
industry play the main role to development in Maharashtra. The sugar industry in
Maharashtra is most popular in co-operative sector. The Maharashtra sugar industry has
been contributing 37% of India's total sugar production. And sugar industry plays an
important role in the national as well as state economy
• The Sugar industry in Maharashtra is the perfect example of a sweet dream turned sour. It
have been the backbone of Maharashtra agriculture sector. Of the total sugar factories in
the country, 33 per cent are located in the State followed by 22 per cent in Uttar Pradesh.
As on 31st March, 2015, out of the total sugar production in the country, the share of State
was 37 per cent followed by 25 per cent of Uttar Pradesh .
• Investment- 10% shares of cooperative society members; 25% GoM; 65% Financial support
from financial agencies/market.
• Multitudinal effects of sector and imp personalities related to it- Vikhe Patil, Vasantrao Patil,
YB Chavan, Sharad Pawar,etc
• Sugar factories have become livelihood of 2.5 crore population in the state. This cooperative
sugar industry provides employment to 1.65 lakh people directly. Almost 8 lakh people are
engaged in the harvesting and transportation of sugarcane to factories from the fields. The
sugar industry provide annual revenue of over 2200 crores the government Due to the
cooperative sugar industry allied business like milk cooperatives, fertilizer supply, irrigation
systems have flourished. All this together have led to development of rural places form
where the sugarcane is drawn to factories in form of improved road network, transportation
facilities, medical facilities, Education facilities, Banking etc.
Problems of sugar industries• Problems:
Sick Sugar industries- Shivajirao Patil Committee to review; 27 Sick Sugar Cooperative industries
•  Cropping pattern management and cane cultivation
•  Increasing cost of Sugar production
•  Low recovery rate
•  Price determination of cane
•  Fall in the price of sugar
•  Lack of Technical efficiency
•  Mismanagement
•  Government policies
•  Challenges of private industry
•  Lack of By-products
•  Sugar Cane Cutter Migrants
• SUGGESTIONS
•  Support price of sugarcane should be fixed so as to stabilize sugarcane production.
•  Another area of consideration is greater corporatisation of the industry.
•  To compensate for the losses incurred by growers the sugar factories.
•  Lack of optimum utilization of by-products needs attention because it would not only help
in reduction of cost of production but also improve the economic status of the sugarcane
growers.
•  The co-operative sugar factories should give more attention on the professional
management, new techniques in administration, to produce the by-products, cogeneration
projects, increase efficiency of workers, control on corruption, increase market
competitiveness, away from politics, instant decision making etc.
ECO SURVEY DATA
ECONOMIC REFORMS
• Meaning- Minimizing role of State & increasing role of
pvt sec
• Background- Scepticism amongst Developing countries
against foreign investments as they feared their
dominance & rule of colonisers
• Components: 1. Macroeconomic stabilization
measures(Boost aggregate demand of economy either
domestic or external, domestic by incresing purchasing
power of masses by gainful &quality empl opportunities)
2.Structural Reform measures (Boost aggregate supply of
goods & services , mostly by capitalists)
• LPG : Liberalization shows Direction of Reforms;
Privatization shows path of Reforms & Globalization
shows the Ultimate goal of Reforms.
ECONOMIC REFORMS
• Liberalization- Pro-capitalistic or Pro- market inclination of an
economy; decreasing traits of a state economy; liberalising from
shackles of restrictions/regulations of a state economy(Tax
reforms,Fiscal reforms,Expenditure reforms,Banking reforms)
• Privatization-
- Denatiolization- Tfr of State ownership of assets to pvt sector to the
tune of 100%
-Disinvestment- Denatiolization of state owned enterprises of less
than 100% ownership to pvt sector
- All the economic policies of State which directly or indirectly
promote expansion of role of pvt sector or mkt(deregulation,
reducing subsidies,permission to FDI)
• Globalization- Increase in economic integration among nations
-Unrestricted cross border movement of goods,services, capital or
labour force is Globalization(WTO)
ECONOMIC REFORMS
• FIRST GENERATION REFORMS(1991-2000)-
Promotion to pvt sector; Ext sector Reforms like FDI,abolishing QR on
imports; Public Sector Reforms to make PSU
efficient,profitable,disinvestment; Financial Secor Reforms like
Insurance, Banking; Tax Reforms to avoid tax evasion,simplify,
broadbase tax.
• SECOND GENERATION REFORMS(2001 Onwards)-
Factor Mkt Reforms where dismantling Administered Price
MechanismPromotion (Remaining Urea, K oil, LPG), Public Sector
Reforms for greater autonomy to PSU,disinvestment; Adm Reforms
where State from Controller to Facillitator; Legal Sector Reforms like
Labour laws, Company laws; Critical Areas Reforms in Health
care,education, agri like R & D in agri,corporate farming.
ECONOMIC REFORMS
• THIRD GENERATION REFORMS-
PRI so that development reaches grass root level; Factor of
Inclusiveness
• FOURTH GENERATION REFORMS-
IT- enabled reforms
- Reforms is a simultaneous and continuos process and is a
mean to an end.
IMPACT OF LIBERALIZATION
• Sectoral composition change
• GDP Growth Rate
• Agri sector
• Industrial sector & SSIs
• Services sector
• Telecom sector
• Economic inequality
• Unemployment
• IMPACT OF LIBERALIZATION-
• Composition – Services – Steady significant Increase (w
as more marked after
reforms), Industry Less marked increase (stagnated
after reforms) , Agriculture Significant Decline
IMPACT OF LIBERALIZATION• GDP growth rate – 
India’s annual average growth rate from 1990 to2010 has been 6.6 % which is almost double than pre reforms
. GDP growth rate surpassed 5% mark in early 1980’s. This made impact of 1990’s reforms on growth uncle
ar.     
Some,believe that 1980’s reforms were precursor to LPG reforms. Other things apart, it is clear that 1980 ref
orms led to crash of economy in 1991, which was,remedied by LPG reforms which were quite more compreh
ensive. It was IMF loan which gave government to adjust its economy. It was largest ever loangiven by IMF
. Initially there were global doubts on India’s credibility for loan, but India has been so far a disciplined borrow
er. 
• Industrial Growth Rate ..Barring few years industrial growth rate has been not much impressive. Share of  
 Industry still remains stagnantly low at 25%.Worst is that India has transitioned to be a service led econo
my, directly from an agrarian one. One explanation of this is end of policy of imports substitution 
which derived industrial growth upto 1990. Foreign companies got free access to Indian markets and ma
de domestic products uncompetitive. They,obviously had better access to tech & larger economies of scal
e.India position also lagged on account of Research and innovation. Import substitution required certain degr
ee of investment and efforts in domestic,production. It was carried out even when imports were cheaper. This
 resulted in  good and better capacity building upto that time. This was coupled with 
constant technology denial by west, which further pushed government to spend on R&D. Technology Denial   
   
 ended with liberalization and globalization. Till,that time Indian Industry was better and modern than that of    
    China. But in two decades China has surpassed India by huge margin in case of both 
Industry and innovation
Impact on Small Scale in India -
• This impact shall be studied right from the beginning of colonization in 18th 
 century. Colonization can be considered as 1st 
 wave of globalization. In precolonization era, India’s textiles and handicraft was renowned worldwide and wa
s backbone of Indian economy. With coming of industrial revolution with foreign rule in India, Indian economy
 suffered a major setback and much of its indigenous small scale cottage Industry was destroyed.  
After independence, government attempted to revive small scale sector by reserving items exclusively for it t
o manufacture. With     
LPG,reserved items was substantially curtailed and many new sectors were thrown open to big playe
r
• Small scale industry however exists and still remains backbone of Indian Economy. It contributes to major po
rtion of exports and private   
sector,employment. Results are mixed, many erstwhile Small scale industries got bigger and better. But over
all value addition, product i 
Innovation and tech,adoption remains dismal and they exist only on back of government support. Their produ
cts are contested by cheaper        imports from China. 
• Impact on Agriculture-
• Share of agriculture in domestic economy has declined to about 17%. However, people dependent upon
 agriculture are still around 48%.Cropping patterns has undergone a huge change, but impact of liberalizati
on can’t be properly assessed. There are still all pervasive government controls and interventions starting fro
m production to distribution. 
• Global agricultural economy is highly distorted. This is mainly because imbalance in economic and p
olitical power in hands of farmers of developed and,developing countries. In developed countries, co
mmercial and capitalistic agriculture is in place which is owned by influential Agri corporations. They
        influence policies of WTO and extract a better deal  at cost of farmers of developing,world. 
• Farming in developing world is subsistence and supports large number of poor people. With globalizat
ion there has been high fluctuation in commodity,prices which put them in massive risk. This is particularly tru
e for cash crops like Cotton and Sugarcane. Recent crises in both crops indicate towards this conclusively. 
• GM crops
• On the positive note, India’s largely self­
sufficient and high value distinguished products like Basmati Rice are in high demand all over. Generally spe
aking,India is better placed to take up challenge of globalization in this case. If done in sustainable and inclus
ive manner, it will have a huge multiplier impact on,whole economy. Worldwide implicit compulsion to develop
 Food processing Industry is another landmark effect of  LPG
.
• Impact on Services Sector
• In this case globalization has been boon for developing countries and bane for developed ones. Due to historic econo
mic disparity between two groups,
human resources have been much cheaper in developing economies. This was further facilitated by IT revolution an
d this all culminated in exodus of
numerous jobs from developed countries to developing countries. Here US have to jealously guard its jobs as we
guard our agriculture.
• IT industry
• Software, BPO, KPO, LPO industry boom in India has helped India to absorb a big chunk of demographic dividend, whic
h otherwise could have wasted.Best part is that export of services result in export of high value. There is almost no mat
erial exported which consume some natural resource. Only thing,exported is labor of Professionals, which doesn’t depl
ete, instead grows with time. Now India is better placed to become a truly Knowledge Economy.
• Exports of these services constitute big part of India’s foreign Exchange earnings. In fact, the only three years India ha
d Current Account surplus, I.e. 2000-2002, was on back of this export only.
• Banking
• Further, in banking too India has been a gainer. Since reforms, there have been three rounds of License Grants for priv
ate banks. Private Banks such as,ICICI, HDFC, Yes Bank and also foreign banks, raised standards of Indian Banking
Industry. Now there is
cut through competition in the banking industry,and public sector banks are more responsive to customers.
• Education and Health Sector
• It should be noted that food (Agriculture), Health and education are among basic necessities, which every human being
deserves and can’t do without. Unfortunately, in developing countries there is market failure in all these sectors and m
ajority of people can’t afford beyond,a certain limit (or can’t afford at all). Concept of free markets, globalization, liber
alization etc. fails here miserably. Free markets provide goods &services to people who can afford paying for them,
not to those who deserve and need these.
• Now if we consider these sectors from angle of our inclination towards free markets, certainly there has been lot of pr
ogress. There has been world class,education available in India and Deregulation has resulted in Mushrooming of pri
vate engineering and Medical Colleges. But in reality, this had far,reaching devastating effect on society.
These new colleges accommodate only a miniscule proportion of aspirants at very high costs.
• Economic inequalities
• Deindustrialisation & unemployment
  DISINVESTMENT
 Concept of Maharatnas (5) , Navratnas (15), Miniratnas (61)
 Disinvestment Timeline in India
Disinvestment: When Government sells its shares of a PSU, to private sector company / individual.
Privatization: when Government sells so many shares, that it no longer remains the majority shareholder of the given 
PSU.
1991­Interim budget, Government announced 20% disinvestment in selected PSUs.
Their shares were sold to Mutual funds and financial institutions (UTI, EPFO, LIC etc.)­1992
1993-Rangarajan Committee suggests:­49% disinvestment in PSUs reserved for public sector;74% disinvestment in all 
other PSUs
Government did not implement.
1996-Disinvestment commission under GV Ramakrishna. It was a non­statutory, advisory body.
1998­2000­­Vajpayee Government classifies PSUs into two parts
Strategic: arms­ammunition, railway, nuke energy – NO disinvestment
Non-strategic: Disinvestment in a phased manner. Hindustan Zinc, BALCO, Maruti
To implement above policy, Department of disinvestment set up under Finance ministry. 
2004­UPA comes into power, Common Minimum program (CMP) updates disinvestment policy
Sick PSUs will be revived;No disinvestment in profit making PSUs;PSUs will get commercial autonomy
2005­Whatever Money Government earns from selling its PSU shares­ it’ll go to National investment fund (NIF). 
2005­09­Disinvestment remains stagnant because Left allies of the UPA Government stonewall everything.
2009 onwards­UPA­2 without left parties. Government resumes disinvestment process.
All PSUs can be disinvested, but upper limit: 49%
2013­14­­Plan for 40,000 crores via disinvestment of Indian Oil, BHEL, NHPC, Neyveli lignite etc. but hardly managed to 
get ~16,000 because­­Oil ministry, mining ministry, trade unions opposed the move, files were delayed; Lukewarm 
response from investors because sharemarket was down due to internal & external factors.
2014­Modi cabinet approves disinvestment in NHPC, Coal India, ONGC.
  
  Modi PSU-reform1: Disinvesting NHPC, Coal India, ONGC
Issues-
NHPC­Has 20 hydroelectric power stations.;Unable to recover dues from electricity utility 
companies= company making huge losses.
Hence it share price won’t fetch truckload of cash to Government.
Coal India Ltd­Labour union strike may bring down share price. 
ONGC­Maharatna PSU­If Government clears the gas price policy, ONGC’s share prices will go up 
(And after that Government should sell it­
Modi PSU-reform2: Revive 5 and shut down 6
Hindustan Photo Films
HMT Bearings
HMT Watches
HMT Chinar Watches
Hindustan Cables.
Tungabhadra Steel Products Ltd
HMT Machine Tools
Heavy Engineering Corporation
NEPA
Nagaland Paper & Pulp Co
Triveni Structurals
  
 Disinvestment: arguments in favour and against
1.Socialist / leftist ideology­ Limitation of pvt sector in fulfilling social commitments
Private enterprises only focus on profit maximization. They won’t cater  for poor people.
Therefore Government needs to control all or some industrial sectors.             vs
Such Govt controlled units can’t compete in free market economy due to political interference and price
control mechanisms.Ultimately more public money is wasted in running these loss making entities.
2. Dividend Income­Government’s dividend income will decline. (Because they’ll have less shares).
Consequently, Fiscal deficit will increase.     Vs
“dividend” Government earned so far vis a vis Government has spent more for their revival.
3. Financial Inclusion-  It’ll not help in “financial inclusion”  as  only 0.5% retail participation in equity 
market i.e. only Large corporates and financial institutions benefit from this drive    vs
Absurd logic, that just because corporates will benefit, we shouldn’t begin disinvestment.
Government already taken plenty of initiatives on financial inclusion front.
4. Jobs loss- After disinvestment employees of PSUs will loss their jobs.    vs
private sector experts in Board of Directors, plans to reduce staff strength, to increase profitability.
Overstaffing = One of the main reasons why PSUs don’t make optimum profit. Firm action needed.
Besides, such employees are given attractive VRS offers.
5. Monopoly of pvt- Disinvestment would lead to private monopolies     vs
Unlikely to happen in today’s world. CCI is always watching and punishing the firms that try to create 
monopoly or oligopoly.
  
 6. Less valuation- Allegations  that PSEs are sold cheap to preferred parties e.g. 
BALCO         vs
 Used to happen in 90s, when Govt sold shares to specific pvt companies at an arbitrary 
price.
But, Unlikely to happen if shares directly sold via stock exchange. + CAG, Media very 
active now
7. Changing ownership amongst Govt org-To complete the disinvestment targets, 
Government asks one PSU to buy shares of another PSU.
e.g. ordering LIC to buy ONGC’s shares……. In such cases, disinvestment doesn’t 
decrease Govt control over those companies.
Need for a clear policy on disinvestment to stop this practice.
Speed of Disinvestment- International experiences-
Rapid speed
1993: Czech Republic disinvested ~1000 state owned enterprises.;  Russia did same.
Results were disappointing in both the cases.
Hence rapid approach=  not recommended for India
Slow speed
China­ after more “Open Door Policy” in 1978.
But speed too slow­ thousands of enterprises still under Government ownership.
Middle speed-  Most suitable for India
 
CURRENT AFFAIRSDIPAM-DEPARTMENT OF INVESTMENT AND PUBLIC ASSET MANAGEMENT
 In order to revive strategic stake sale of PSUs, the Department of Disinvestment, has been renamed as the Department
of Investment and Public Asset Management (DIPAM).
 Department of Disinvestment was carved out of the Finance Ministry in 1999.
New Responsibilities
 The government has also redefined the responsibilities to include efficient management of the government investment
in CPSEs through capital restructuring, dividend, bonus shares and monetization of idle assets.
 Public asset management would also include buyback of shares.
Objectives of disinvestment
 To reduce the financial burden on the Government.
 To improve public finances.
 To introduce, competition and market discipline.
 To fund growth.
 To encourage wider share of ownership.
 To depoliticize non-essential services.
Targets
 The government aims to collect Rs 56,500 crore through disinvestment in PSUs in the next fiscal, 2016-17.
 Of the total budgeted proceeds, Rs 36,000 crore is estimated to come from minority stake sale in PSUs.
 The remaining Rs 20,500 crore is projected to come from strategic sale in both profit and loss-making companies.
What is Strategic Sale?
According to Department of Disinvestment, In the strategic sale of a company, the transaction has two elements:
 Transfer of a block of shares to a Strategic Partner and
 Transfer of management control to the Strategic Partner
CPSE- 
 ONGC Ltd, Coal India Ltd, NTPC Ltd, the National Mineral Development Corporation (NMDC) Ltd and Power 
Finance Corporation Ltd were top 5 profIt-making CPSEs  during 2014­15, whereas Bharat Sanchar Nigam Ltd, 
Air India Ltd, Mahanagar Telephone Nigam Ltd, Hindustan Photo Films Manufacturing Company Ltd &Mangalore 
Refinery and Petrochemicals Ltd were  top 5 loss-making CPSEs.
 CPSEs contribute  to the central exchequer  by way of dividend  payment, interest on government loans and 
payment of taxes and duties. Their contribution to the central exchequer decreased.
INDIA- INTERNATIONAL TRADE
 India’s share in International trade:
1950 (1.78%)– 1955 (0.6%)-- 2005 (1%) – 2008 (1.64%)---2020 (3.28%)
 Based on composition of international trade, country’s economic status as developed or
developing .
 Composition:
Import- 1. Food group- 1960 (2.1%) to 2010 (2.9%, out of which 1.8% is of edible oil)
2. POL – 1960 (6.1%) to 1980 (41.9%) to 2010 (28.6%).
3. Steel – 1960 (11%) to 2010 (2.9%)
4. Metalloids like Gold,Silver,etc- Through Govt agency, 2001 (9.3%) to 2010
(11.5%)
5. Capital goods- 1960 (31.7%) to 2010 (13.1%, max of n.c.e. 6.4%)
6. Gems & Jewelleries- 1960 (0.1%) to 2010 (9.4%)
Export- 1. Agri & allied prod- 1960 (44.2%, initially jute max 21%) to 2010 (9.9%)
2. Engg goods – 1960 (3.4%) to 2010 (23.8%).
3. POL – 1960 (1.1%) to 2010 (16.8%); Reasons- price & refining capability
4. Chemicals- 1960 (1.1%) to 2010 (11.4%)
5. Gems & Jewelleries- 1960 (0.1%) to 2000 (16.6%) to 2010 (14.7%)
India’s exports shifted from traditional goods like tea, rice, spices, tobacco, jute to
chemicals, Engg goods,gems, jewelleries,etc (non traditional/manufactured goods).
INDIA- INTERNATIONAL TRADE
India is becoming increasingly integrated with the global economy. India’s total merchandise
trade as a percentage of GDP increased from 29.5 per cent in 2004-05 to 40.2 per cent in
2014-15 and merchandise exports increased from 12.6 per cent in 2004-05 to 16.4 per cent in
2014-15. Here although growth is driven by domestic demand, contribution of exports to
economic growth is important as exports of goods and services account for about one fourth of
the GDP. Increase in exports along with focus on manufacturing and industrial development,
results in a multiplier effect bringing about increase in income, as well as, employment
generation.- As per the disaggregated data on exports of principal commodities during 2014-15, the top
five
commodities of export include petroleum (crude and products), gems and jewellery, textiles
and allied products, chemicals and related products and agri and allied products.
On the other hand, top five import items constitute petroleum (crude and products), gems
and
jewellery, chemicals and related products, electronic items and machinery.-Several factors contributed to the sluggishness of trade and output in 2014 and at the start of
2015, including slowing GDP growth in emerging economies, an uneven recovery in developed
countries, and rising geopolitical tensions, among others.
As per the current rankings for 2014, India was the 19th largest exporter (with a share of 1.7
percent) and 12th largest importer (with a share of 2.4 per cent) of merchandise trade in the
world.China is the top ranked exporter and United States of America (USA) is the top
importer of merchandise trade in the world. In Commercial Services Exports, India is 8th
largest exporter in 2014 (with a share of 3.20 per cent). In imports of commercial services
India ranks 10th (with a share of 2.6 per cent). USA is the top exporter as well as the top
importer of commercial services trade in the world.
The sixth Trade Policy Review (TPR) of India by the WTO was held in Geneva on 2 and 4 June
2015, as a part of the WTO’s Trade Policy Review Mechanism that aims at achieving greater
transparency in and understanding of the trade policies and practices of WTO members. India’s
trade policy review takes place once every 4 years, as determined in terms of its share in world
trade. The last TPR of India was held in September 2011.
Key Findings (2003-2013)-
 Exports - India’s exports recorded growth of 21.3% (CAGR) during the period FY03-FY13, and
stood at USD 300.2 billion in FY13.
o Manufactured goods account for major share of exports (61.2% as of FY13), followed by
petroleum and crude products (20.1% in FY13) and agri-products (13.5% in FY13).
o Contribution of petroleum and crude products in India’s export basket has risen over the
years, while that of manufactured goods has declined. Other commodity groups have registered
range-bound changes in share.
o Asia has always dominated as India’s exports-partner over the years; followed by Europe,
America and Africa. However, exports to America and Africa have declined from FY03 to FY13
and increased with Asia instead.
 Imports - The country’s imports, on the other hand, grew by 26.0% (CAGR) during the same
period, FY03-FY13. Value of imports in FY13 stood at USD 490.3 billion.
o Imports may be classified as POL items (petroleum, oil and lubricants) and non-POL items. As
of FY13, POL items accounted for 34.5% of imports of the country and non-POL items
accounted for the rest of 65.5%.
o Within non-POL items, capital products and chemicals (and chemical related) products have
been important.
o Import sourcing appears to follow the same country composition as exports. India imports
the most from Asia, followed by Europe and America. Imports from both Asia and America to
India have increased, however from Europe has declined in FY13 (when compared with FY03).
Direction of Exports
India’s largest export partner has been Asia. Exports to Asia have grown by more than 23.0%
(CAGR), from USD 22.2 billion in FY03 to USD 150.4 billion in FY13.
The next largest export destination is Europe (USD 58.8 billion in FY13), followed by America
(USD 53.4 billion);
Direction of Exports
Conclusions
Trade flows for India have grown at a robust pace during the past decade (FY03 to FY13). In general,
India has expanded its commodity basket of trade from primary agri-products to manufactured
goods and petro-related products; with Asia emerging as the largest trade partner in recent years.
 Exports have registered shift in commodity compositions, with share of manufacturing goods
coming down to give way to export of petroleum and crude products. In a way this does reflect
India’s strength in refining capability. In terms of export-destination, Asia has been and continues
to be a major partner through the years. This has helped to diversify our exports basket and
buffered to an extent the impact of any slowdown in the western world.
 Imports on the other hand, have registered shifts in country-sources as well as commodity basket.
While POL share has increased, within non-POL category, there has been an increase in import of
gold, coal and ores in recent times. From a geographically-dispersed country-source profile, imports
sources are now concentrated in the Asia region itself. Partly, this is due to the higher import of POL
products and also the emergence of China as a major trading partner.
These shifts in India’s trade profile may be attributed to intrinsic and extraneous factors, namely
 Trade Policy – as a conscious change in trade policy, India has moved to effective trade through
reduction in transportation costs, diversifying commodity basket and boosting regional trade, by
the EXIM policies over the years to facilitate the growth of exports. It has ensured some ring
fencing against external vulnerabilities & shocks from advanced economies.
 Global dynamics – advanced economies have in the last few years registered slowdown in
economic activity. This has caused production activity in advanced economies to moderate (which
impacts exports to India i.e. India’s imports) coupled with a contraction in demand for imported
goods from advanced countries (i.e. India’s exports). Trade flows to these regions have hence, been
affected, giving way to increased inter-regional trade. Trade with Europe however, appears to be
impacted more adversely when compared with India’s trade with America.
Source: DGCI&S, Kolkata
International Financing institutes(IMF,WB,ADB,UNCTAD)
IMF• Background- 1930s Depression
• Bretton Woods Twins-The representatives of the USA, the UK and 42 other (total
44 countries) nations met at Bretton Woods, New Hampshire, USA in July 1944 to
decide a new international monetary system (IMS). The International Monetary
Fund (IMF) and the World Bank (with its first group-institution IBRD) were set up
together—popularly called as the Bretton Woods’ twins—both having their
headquarters in Washington, DC, USA.
• The International Monetary Fund (IMF) came up in 1944 whose Articles of
Agreement were signed by 29 countries on the December 27, 1945 with the main
functions as exchange rate regulation, purchasing short-term foreign currency
liabilities of the member nations from around the world, allotting special drawing
rights (SDRs) to the member nations and the most important one as the bailor to
the member economies in situation of any BoP crisis ( by giving short term loans)
• France is First country to get loans from IMF.
• Presently, total no of members in IMF- 188.
• The Board of Governors of the IMF consists of one Governor and one Alternate
Governor from each member country. For India, Finance Minister is the Ex-officio
Governor while the RBI Governor is the Alternate Governor on the Board. The day-
to-day management of the IMF is carried out by the Managing Director who is
Chairman(currently, Ms Christine Lagarde) of the Board of Executive Directors.
• Quota- Quota means member country’s share of capital investment in IMF, based
on which voting rights are decided.
• Concept of Reserve Tranche & EFF
WB
• The World Bank (WB) Group today consists of five closely associated institutions propitiating in the
role of development in the member nations in different areas.
• 1. IBRD(1945)
International Bank for Reconstruction and Development is the oldest of the World Bank institutions
which started functioning (1945) in the area of reconstruction of the war-ravaged regions (WW II) and
later for the development of the middle-income and creditworthy poorer economies of the world.
• 2. IDA(1960)
• The International Development Agency (IDA) which is also known as the soft window of the WB was set
up in 1960 with the basic aim of developing infrastructural support among the member nations, long-
term lending for the development of economic services especially in poor countries.
• 3. IFC(1956)
• The International Finance Corporation (IFC) was set up in 1956 which is also known as the private arm
of the WB. It lends money to the private sector companies of its member nations.
• 4. MIGA(1988)
Multilateral Investment Guarantee Agency (MIGA), encourages foreign investment in developing
economies by offering insurance (guarantees) to foreign private investors against loss caused by non-
commercial (i.e. political) risks, like currency transfer, expropriation, war &civil disturbance.
• 5. ICSID(1966)
• The International Centre for Settlement of Investment Disputes (ICSID), set up in 1966 is an investment
dispute settlement body whose decisions are binding on the parties.
• India is not its member (that is why the Enron issue was out of its preview).
• India is largest loanee from IDA & IBRD for devlt & infra devlt.
IMF Vs World Bank Difference in functions
Function of IMF and World Bank in the context of the world economy.
International monetary Fund
IMF gives short-term loans to its members, and helps in recovering from BoP crisis (balance of
payment crisis).In simplest terms, BoP crisis means you don’t have enough money/ foreign
currency to pay for your imports. So in that case you run to IMF.
→Then IMF gives loans, they’ll ask you to change your policies accordingly. eg. they’ll ask you
to
1. let the MNCs enter your market,
2. reduce the jobs or shutting down the loss making Public sector units etc.
3. stop giving subsidies to particular section (petrol/fertilizer etc.)
and so on…
IMF gives loans, it expects you to pay full amount back + interest rate.
In IMF there is a thing called Quota i.e.
Every member has to give some money to IMF, (IMF will give it to loan as other members). The
rich nations with bigger Quota has more voting rights (USA).So rich nations can effectively
decide how IMF should function.
World Bank
In short, They give soft loans to poor nations for Development purpose and various health
education,poverty removal programs.
Soft loan= minimal interest rates, the EMIs have longer time brackets in between, and they
don’t expect your to pay back the principle. They facilitate private players to setup business in
poor nations. (via insurance and loans)
WTO & AGRICULTURE
 It required member countries to report their total AMS for the
period between 1986 and 1988, bind it, and reduce it
according to an agreed upon schedule. Developed countries
agreed to reduce these figures by 20% over six years starting in
1995. Developing countries agreed to make 13% cuts over 10
years. Least – developed countries do not need to make any
cuts.
 As we can note that Subsidies were bind to levels of 1986-
1988, there was inequality at very beginning of the agreement.
At that time subsidies which latter came under ‘Amber Box’
were historically high in western countries. In developing
countries, including India these subsidies were very limited. It is
only now under pressure of Inflation in prices of agricultural
Inputs, and wide differences between market prices and
Minimum support Price, subsidies have grown to this level. In
effect developed countries are allowed to maintain substantially
higher amount of trade distorting subsidies.
Blue Box- This is the amber box with conditions.The
conditions are designed to reduce distortion subsidy
that would normally be in the amber box & is placed in
the blue box if it requires farmer or ascertain
production level.These subsidies are nothing but
certain direct payments Made to farmers by the
government in the form of assistance program to
encourage agriculture, rural development,etc.At
present there are no limits on spending on the blue
box subsidies.In the current negotiation, countries
want to keep blue box as it is because they see it as a
crucial means of moving away distorting the amber
box subsidies without causing too much hardship.
WTO & AGRICULTURE
• De-Minimis provision
 Developed countries are allowed to maintain trade distorting
subsidies or ‘Amber box’ subsidies to level of 5% of total value
of agricultural output & for developing countries upto 10%.
 So far India’s subsidies are below this limit, but it is growing
consistently. This is because MSP are always revised upward
whereas Market Prices have fluctuating trends.
 Market Access: The market access requires that tariffs fixed
(like custom duties) by individual countries be cut
progressively to allow free trade. It also required countries to
remove non-tariff barriers and convert them to Tariff duties.
• India has agreed to this agreement and substantially reduced
tariffs. Only goods which are exempted by the agreement are
kept under control.
WTO & AGRICULTURE
 Export Subsidy: These can be in form of subsidy on inputs of
agriculture, making export cheaper or can be other incentives
for exports such as import duty remission etc. These can result
in dumping of highly subsidized (and cheap) products in other
country. This can damage domestic agriculture sector of other
country.
 These subsidies are also aligned to 1986-1990 levels.But USA is
dodging this provision by its Export credit guarantee program. In
this, USA Govt gives subsidized credit to purchaser of US
agricultural products, which are to be paid back in long periods.
e.g. Food Aid programs, such as (Public Law-480) under which
food aid is send massively to under developed countries.It
results in perpetual dependence on foreign grain in recipient
countries and destroys their domestic agriculture. So this is
equally trade distorting subsidy, which is not currently under
ambit of WTO’s AOA.
WTO & AGRICULTURE
 Special Safeguard Mechanism
 A Special Safeguard Mechanism (SSM) would allow
developing countries to impose additional (temporary)
safeguard duties in the event of an abnormal surge in
imports or the entry of unusually cheap imports.
 Debates have arisen around this question, some
negotiating parties claiming that SSM could be repeatedly
and excessively invoked, distorting trade. In turn,
the G33 bloc of developing countries, a major SSM
proponent, has argued that breaches of bound tariffs
should not be ruled out if the SSM is to be an effective.
remedy. SSM is quite important in a scenario in which West
has significant powers to subsidize their production and in
turn, exports.
WTO & AGRICULTURE
• Bali Summit 2013-
 LDC- DFQF mkt access
 Peace clause (upto 2017, later on permanent without time limit)
 Trade facilitation
• The Bali Package(2013) had 10 agreements, which can be clubbed under three heads :
TFA, Agriculture (Food Security) and Least Developed Nations (LDC). While developed
nations’ primary attention was on TFA, India’s concern was regarding moving ahead
without finding a permanent solution to the food security issue. India has been insisting
that it would not agree to the TFA unless the entire Bali package, which includes allowing
developing countries to buy food from farmers for food security needs, is simultaneously
firmed up. No Permanent solution to the issue of public stockpiling for food security; but
only a peace clause under Bali agreement New Delhi has been seeking a permanent
solution to the issue of public stockpiling for food security because under the current
rules, subsidies are capped at 10% of value of total production based on 1986-88 prices.
India is close to breaching this on account of high inflation over the past few years. India
wants inflation to be taken into account when calculating subsidy limits. The country
buys rice and wheat from farmers at minimum support prices (MSP) to provide a
reasonable income to producers. The stockpile is used to provide heavily subsidised food
to the poor.
• Peace Clause under Bali agreement-
Peace clause’ available to India under the Bali agreement that says no member can take
action against another on the food subsidy issue till a final agreement is reached on the
issue, the deadline for which is the 11th ministerial in 2017.
WTO & AGRICULTURE
• Nairobi Summit 2015-
 Abolish export subsidies
 Public stock holding for food security (on hold)
 Spl Safeguard mech (SSM) for developing
countries (on hold)
 DDA- (no firm commitment)
Bargaining tool by India- Trade facilitation.
• What did India Gain from WTO?
• 1. India got boom in exports because WTO gradually lowered Barriers internationally.
• 2. Our export was only $33.22 billion in 1998-99, right now India’s exports are worth more than $100 billion
• 3. India won multilateral dispute settlement against such powerful economies as USA
• 4. Due to TRIPS, India had to adopt international standards in Intellectual property rights.
• 5. flow of Foreign investment & technology. (because Foreigners established research labs/ manufacturing
units in India & started selling their products here.)
• 6. Textiles boom (because MFA = Multilateral Fiber Agreement was scrapped under WTO’s Agreement on
Texttile clothings.) otherwise previously UK and other nations had put quantitative limits on Indian Cotton’s
Entry in their market.
• Criticism of WTO
• Mostly comes from environment activities.
• 1. WTO promotes industries, MNC (Multi-national corporations)
• a. But these MNCs sometimes are involved in bad things. Eg. They pay huge bribes to Burma’s military regime
for operating the gas lines, nickel mines etc. And employ forced laborers in it.
• 2. The infrastructure boom because of WTO (more foreign companies making factories in India) – leads to
habitat / bio-diversity loss & pollution etc.
• 3. Its hard to put barriers on imported items, thus the domestic industries face tough competition which
sometimes ruins them. (e.g. its not possible for Indian Toy maker to compete with Chinese toys in retail price.)
and yet not much the Indian Govt. can do. If they put some ban on it, then China will go to WTO, and WTO will
impose heavy fines on India.
• 4. 3rd world has to open its market for first world product without much benefit in the reverse process. (=3rd
world’s products lag in race in 1st world’s market.)
• 5. e.g. as you know in colonial era, when India was under British Rule, if we exported ourIndian Textiles to
Britain, they’d put huge import tax on it. Thus our cloths would become very expensive in their market. So
Britishers would only buy locally made cloths from Manchester. This sort of ‘protectionism’ in old times
(almost upto 1995) = their companies made lot of profit during that era & had lot profit invested in Research
and technology, so currently their products will be technically and in quality far superior than ours. So even if
there is no barrier today, British people will buy their product and not ours. This argument runs on the same
line like of climate change. America allowed its factories to pollute the atmosphere and thus became a
developed nation but now, it wants the developing nations to stop polluting the world & cut their emissions.
CURRENT AFFAIRS
Afghanistan’s WTO membership approved after 11 years of talks -
The World Trade Organisation (WTO) has formally approved Afghanistan’s membership at its 10th
ministerial conference in the Kenyan capital Nairobi.
Afghanistan has become the 164th WTO member and the 36th least developed country (LDC) to join the
global trade body after 11 years of negotiations.
How a new member is admitted? -accession process:
1. A country wishing to accede to the WTO submits an application to the General Council, and has to
describe all aspects of its trade and economic policies that have a bearing on WTO agreements. The
application is submitted to the WTO in a memorandum which is examined by a working party open to all
interested WTO Members.
2. After all necessary background information has been acquired, the working party focuses on issues of
discrepancy between the WTO rules and the applicant’s international and domestic trade policies and
laws. The working party determines the terms and conditions of entry into the WTO for the applicant
nation, and may consider transitional periods to allow countries some leeway in complying with the WTO
rules.
3. The final phase of accession involves bilateral negotiations between the applicant nation and other
working party members regarding the concessions and commitments on tariff levels and market access for
goods and services. The new member’s commitments are to apply equally to all WTO members under
normal non-discrimination rules, even though they are negotiated bilaterally.
4. When the bilateral talks conclude, the working party sends to the general council or ministerial
conference an accession package, which includes a summary of all the working party meetings, the Protocol
of Accession (a draft membership treaty), and lists of the member-to-be’s commitments.
5. Once the general council or ministerial conference approves of the terms of accession, the applicant’s
parliament must ratify the Protocol of Accession before it can become a member.
The process of becoming a WTO member is unique to each applicant country, and the terms of accession
are dependent upon the country’s stage of economic development and current trade regime. The process
takes about five years, on average, but it can last longer if the country is less than fully committed to the
process or if political issues interfere.
•  CPSE- 
  ONGC Ltd, Coal India Ltd, NTPC Ltd, the National Mineral Development Corporation 
(NMDC) Ltd and Power Finance Corporation Ltd were top 5 profIt-making CPSEs  
during 2014­15, whereas Bharat Sanchar Nigam Ltd, Air India Ltd, Mahanagar 
Telephone Nigam Ltd, Hindustan Photo Films Manufacturing Company Ltd 
&Mangalore Refinery and Petrochemicals Ltd were  top 5 loss-making CPSEs.
  CPSEs contribute  to the central exchequer  by way of dividend  payment, 
interest on government loans and payment of taxes and duties. Their contribution to 
the central exchequer decreased.
•  FDI- 
  With a view to liberalizing and simplifying the FDI policy to provide ease of doing 
business climate in the country that will also lead to larger FDI inflows, the 
government has undertaken various reforms. A number of sectors have been 
liberalized, including defence, construction, broadcasting, civil aviation, 
plantation, trading, private sector banking, satellite establishment and 
operation and credit information companies. 
  During 2015­16, FDI policy in the pension sector has been revised to permit 
foreign investment up to 49 per cent, with 26 percent under automatic route. 
Manufacturing of medical devices and white label ATM operations have been 
opened up to 100 percent FDI under automatic route.
•  The various reforms in the FDI sector have led to a significant increase in FDI 
inflows into India, showing a 26 per cent surge in 2015.
 The high growth in services FDI inflows is mainly due to higher growth of three major categories, namely
computer software and hardware; services sector category which itself consists of a basket of items like
financial, banking, insurance, non-financial, outsourcing and R&D; and trading. This was in spite of the high
negative growth at - 61.6 per cent in FDI equity inflows in telecommunications.
WTO Services Negotiations and Bilateral Negotiations including Services Trade in Nairobi
• Service trade- Implementation of preferential treatment in favour of services and service suppliers of LDC
and increasing LDC participation in services trade; and moratorium on payment of customs duties on
electronic transmissions until 2017.
• Preferential treatment for LDCs: So far, 21 members, including India, have notifed preferential treatment to
LDCs in services trade. India has offered this in respect of: (i) article XVI of the General Agreement on Trade
• in Services (GATS) (Market Access); (ii) technical assistance and capacity building; and (iii) waiver of visa fees
for LDC applicants applying for Indian business and employment visas. The fee waiver will be valid until 31
December 2030. India is the only member which has offered waiver of visa fees. This is a unique and almost
path-breaking offer by India. So far, visa issues have remained untouched in the WTO/free trade agreements
(FTA). India’s offer should give signifIcant advantage to service suppliers from LDCs vis-à-vis service suppliers
from any other country.
• E-commerce: The WTO Members agreed to maintain the current practice of not imposing customs duties on
electronic transmissions until the next Ministerial Conference which will be held in 2017.
• Bilateral agreements:
• India has signed comprehensive bilateral trade agreements, including trade in services, with the governments
of Singapore, South Korea, Japan and Malaysia. And also FTA with ASEAN.
• India has joined the Regional Comprehensive Economic Partnership (RCEP) plurilateral negotiations. The RCEP
is a proposed FTA which includes the 10 ASEAN countries and its six FTA partners, viz. Australia, China, India,
Japan, South Korea and New Zealand. The RCEP is the only mega-regional FTA of which India is a part.
• India is also engaged in bilateral FTA negotiations including trade in services with Canada, Israel, Thailand, the
EU, the European Free Trade Association (EFTA), Australia and New Zealand. Dialogue is under way with the US
under the India-US Trade Policy Forum (TPF), with Australia under the India-Australia Joint Ministerial
Commission (JMC), with China under the India-China Working-Group on Services, and with Brazil under the
India-Brazil Trade Monitoring Mechanism (TMM).
• FDI
• Foreign investment- FDI & FPI
•  Concept of P-notes
•  FDI ROUTES- Automatic & Govt/ FIPB ROUTE
• Govt/ FIPB route sectors
•  FDI prohibited sectors
•  Country wise FDI inflows  2015-16
•  FDI -Pros & Cons
•  FDI
• AUTOMATIC ROUTE :
• Under this route no Central Government permission is required.
• GOVERNMENT ROUTE :Under this route applications are considered by the Foreign 
Investment Promotion Board (FIPB). Approval from Cabinet Committee on Security is required 
for more than 49% FDI in defence. The proposals involving investments of more than INR 30 
billion are considered by Cabinet committee on economic affairs.
• The Indian company receiving FDI either under the automatic route or the government route is 
required to comply with provisions of the FDI policy including reporting the FDI and issue of 
shares to the Reserve Bank of India. 
• SECTORS REQUIRING CENTRAL GOVERNMENT APPROVAL i.e. FIPB Route
• Mining and mineral separation of titanium­bearing minerals and ores, its value addition and 
integrated activities ­100%.
• FDI in enterprise manufacturing items reserved for small scale sector – 100%.
• Defence – up to 49% under FIPB/CCEA approval, beyond – 49% under CCS approval (on a 
case­to­case basis, wherever it is likely to result in access to modern and state­of­the­art 
technology in the country).
• Teleports (setting up of up­linking HUBs/Teleports), Direct to Home (DTH), Cable Networks 
(Multi­system operators operating at National or State or District level and undertaking 
upgradation of networks towards digitalisation and addressability), Mobile TV and Headend­in­
the Sky Broadcasting Service(HITS) – beyond 49% and up to 74%.
• Broadcasting Content Services: uplinking of news and current affairs channels – 26%, uplinking 
of non­news and current affairs TV channels – 100%.
•  Publishing/printing of scientific and technical magazines/specialty journals/periodicals – 100%.
• Print media: publishing of newspaper and periodicals dealing with news and current affairs­ 
26%, Publication of Indian editions of foreign magazines dealing with news and current affairs­ 
26%.
• Terrestrial Broadcasting FM (FM Radio) – 26%.
• Publication of  of foreign newspaper – 100%.
• Airports – brownfield – beyond 74%.
• Non­scheduled air transport service – beyond 49% and up to 74%.
• Ground­handling services – beyond 49% and up to 74%.
• Satellites – establishment and operation ­ 74%.
• Private securities agencies – 49%.
• Telecom­beyond 49%.
• Single brand retail – beyond 49%.
• Asset reconstruction company – beyond 49% and up to 100%.
• Banking private sector – beyond 49% and up to 74%, public sector – 20%.
• Insurance ­ beyond 26% and up to 49%.
• Pension Sector ­ beyond 26% and up to 49%.
• Pharmaceuticals – brownfield – 100%.
• SECTORS UNDER AUTOMATIC ROUTE
• All the items other than above are under the automatic route.
• SECTORS WHERE FOREIGN DIRECT INVESTMENT IS PROHIBITED :
• Lottery Business including Government /private lottery, online lotteries, etc.
• Gambling and Betting including casinos etc.
• Chit funds
• Nidhi company­(borrowing from members and lending to members only).
• Trading in Transferable Development Rights (TDRs)
• Real Estate Business (other than construction development) or Construction of Farm Houses
• Manufacturing of Cigars, cheroots, cigarillos and cigarettes, of tobacco or of tobacco substitutes
• Activities / sectors not open to private sector investment e.g. Atomic Energy and Railway 
Transport (other than construction, operation and maintenance of
(i) Suburban corridor projects through PPP,
(ii) High speed train projects,
(iii) Dedicated freight lines,
(iv) Rolling stock including train sets, and locomotives/coaches manufacturing and maintenance 
facilities,
(v) Railway Electrification,
(vi) Signaling systems,
(vii) Freight terminals,
(viii) Passenger terminals,
(ix) Infrastructure in industrial park pertaining to railway line/sidings including electrified railway 
lines and connectivities to main railway line and
(x) Mass Rapid Transport Systems.)
• Services like legal, book keeping, accounting & auditing.
                                                              FDI-MAKE IN INDIA
• India has already marked its presence as one of the fastest growing economies of the world. It 
has been ranked among the top 3 attractive destinations for inbound investments. Since 1991, 
the regulatory environment in terms of foreign investment has been consistently eased to make 
it investor­friendly.
• RECENT POLICY MEASURES
• Government eases FDI norms in 15 major sectors.
• Townships, shopping complexes & business centres –  up to 100% FDI under the auto 
route. Conditions on minimum capitalisation & floor area restrictions have now been removed 
for the construction development sector.
• India's defence sector now allows consolidated FDI up to 49% under the automatic route. FDI 
beyond 49% will now be considered by the Foreign Investment Promotion Board. Govt approval 
route will be required only when FDI results in a change of ownership pattern.
• Private sector banks now allow consolidated FDI up to 74%.
• Up to 100% FDI is now allowed in coffee/rubber/cardamom/palm oil & olive oil plantations 
via the automatic route.
• 100% FDI is now allowed via the auto route in duty free shops located and operated in the 
customs bonded areas.
• Manufacturers can now sell their products through wholesale and/or retail, including through e-
commerce without Government Approval.
• Foreign Equity caps have now been increased for establishment & operation of satellites, 
credit information companies, non-scheduled air transport & ground handling services 
from 74% to 100%.
• 100% FDI allowed in medical devices
• FDI cap increased in insurance & sub-activities from 26% to 49%
• FDI up to 49% has been permitted in the Pension Sector.
• Construction, operation and maintenance of specified activities of Railway sector
opened to 100% foreign direct investment under automatic route.
• FDI policy on Construction Development sector has been liberalised by relaxing
the norms pertaining to minimum area, minimum capitalisation and repatriation of
funds or exit from the project. To encourage investment in affordable housing,
projects committing 30 percent of the total project cost for low cost affordable housing
have been exempted from minimum area and capitalisation norms.
• Investment by NRIs under Schedule 4 of FEMA (Transfer or Issue of Security by
Persons Resident Outside India) Regulations will be deemed to be domestic
investment at par with the investment made by residents.
• 100% FDI allowed in White Label ATM Operations.
• Note : Citizen or entity from Bangladesh & Pakistan can invest only under the
government route also investor from Pakistan cannot invest in defence, space,
atomic energy and sectors prohibited for foreign investment.
ECONOMIC SURVEY 2016- Industrial, Corporate & infrastructural
performance
• As per latest data released in January 2016 on revised estimates of national income the
growth of Industrial sector broadly comprising mining, manufacturing, electricity and
construction is 5.9 per cent during 2014-15, as against a growth of 5.0 per cent during
2013-14. The advance estimates of national income 2015-16 shows that the growth of
industrial sector is estimated to be 7.3 per cent with manufacturing sector
growing at 9.5 per cent.
• Recent Reforms- Reducing the list of industries that can be considered defence
industries requiring industrial licence; and amendments in FDI policy which include
allowing FDI in defence up to 49 per cent, in railway infrastructure up to 100 per
cent and in the insurance and pension sector up to 49 per cent. The investment
limit requiring prior permission from the Foreign Investment Promotion Board
(FIPB)/Cabinet Committee on Economic Affairs has been increased from R1200
crore to R3000 crore. The definition of investment by Non Resident Indians (NRI),
Persons of Indian Origin (PIO) &Overseas Citizens of India (OCI) in FDI policy has been
revised.
• The government has launched several programmes/initiatives such as ease of doing
business, Make in India, Invest India, and e-biz Mission Mode Project under the National
e-Governance Plan. Further, the Government of India is also building a pentagon of
corridors across the country to boost manufacturing and to project India as a global
manufacturing destination. The National Investment and Infrastructure Fund (NIIF)
has been approved to extend equity support to infrastructure Non-Bank Financial
Companies (NBFC). Issue of tax- free infrastructure bonds has been allowed for rail,
roads and irrigation programmes.
 FDI inflows of last fifteen years –( Pneumonic- SC IT A/atics)
Services sector (17.6%) > Construction development (8.8 per cent)> Computer
hardware and software (7.2 per cent)> Telecommunications (6.6 percent) >
Automobile industry (5.2 percent).
 Country-wise FDI Inflow (2015-16):
Singapore ,Mauritius, Netherlands and USA account for the major share . During
2015-16 (April- November), more than 60 per cent have come from two
geographically small countries named Singapore and Mauritius. (These inflows
need perhaps to be examined more closely to determine whether they constitute
actual investment or are diversions from other sources to avail of tax benefits under
the Double Tax Avoidance Agreement that these countries have with India)
 State-wise analysis of FDI inflows in last 15 yrs : Delhi, Haryana, Maharashtra,
Karnataka, Tamil Nadu, Gujarat and Andhra Pradesh have together attracted more
than 70 per cent of total FDI inflows to India during last 15 years.
CURRENT AFFAIRS100 PER CENT FDI IN E-COMMERCE
E-commerce in India
 The e-commerce industry has grown rapidly in India logging a growth rate of over 60 per cent.
 Studies have pegged the size of the industry at around USD 38 billion by 2016 and it is expected to touch USD 50 billion mark in
2020.
 It is an industry that has the potential to create jobs and spur economic growth.
 This sector has attracted the maximum FDI in 2015.
 Some of the prominent e-commerce marketplace players in India are Amazon, Flipkart, Snapdeal, ShopClues and Paytm - all
funded by foreign investors.
 At present, 100 per cent FDI is permitted in B2B transactions under automatic route.
 Companies such as Amazon India, Flipkart, Snapdeal and many others hosted thousands of sellers, were described as technology
enablers rather than e-retailers. They claimed to have no inventory of their own. That kept them going even with a ban on FDI in e-
commerce.
New Guidelines
 Government permitted 100 per cent FDI in the market place format of e-commerce retailing under the automatic route.
 The government extended the definition of marketplace to include support services to sellers with respect to warehousing,
logistics, order fulfillment, call Centre, payment collection and other services.
 The marketplace model of e-commerce means providing of an IT platform by an e-commerce entity on a digital and electronic
network to act as a facilitator between buyer and seller.
 Further, the inventory-based model of e-commerce means an e-commerce activity where inventory of goods and services is owned
by e-commerce entity and is sold to consumers directly.
 FDI has not been permitted in inventory-based model of e-commerce.
 The guidelines allowed e-commerce marketplace to provide several support services to sellers, but, it said that such entities will not
exercise ownership over the inventory.
 The e-commerce entities providing marketplace will not directly or indirectly influence the sale price of goods or services and shall
maintain level playing field.
100 percent FDI under automatic route is permitted in marketplace model of e-commerce.
• FDI is not permitted in inventory based model of e-commerce.
•Marketplace model vs. Inventory model
• Marketplace based model of e-commerce means providing of an information technology platform by an e-commerce entity on a
digital and electronic network to act a facilitator between buyer and seller.
• Inventory based model of e-commerce means e-commerce activity where inventory of goods and services is owned by e-commerce
entity and is sold to the consumers directly.
• Indian Scenario: In India, 100 percent FDI under automatic route is permitted in marketplace model, while no FDI is permitted in
inventory based model of e-commerce.
• In marketplace model, any warrantee or guarantee of goods and services sold will be responsible of the seller.
• E-COMMERCE IN INDIA
• Why in news?
• The report by CII-DELOITTE REPORT calls the e-commerce in India as a game changer
for the economy .
• Reasons
•  By 2020, B2B (Business to Business) model is expected to see a 2 fold increase while
B2C(Business to Customer) will see 7 fold increase.
•  On a long term it has potential to generate employment, increase export revenues and
enhance tax-collections.
•  Since B2B model is showing more acceptability, this would see an increase in the
number of MSMEs and entrepreneurs from hinterland.
• Challenges to e-commerce industries
•  Lack of uniform taxation across states leading to difficulty in movement of goods.
•  Logistics issues and infrastructure.
•  Payments and banking penetration as cash transaction comes with high administration
cost.
•  Internet penetration.
•  Skilled manpower.
• Recommendation by the report
•  Uniform tax structure in the form of GST to ensure free flow of goods.
•  Timely implementation of programmes like Digital India, Skill India, Startup India etc to
support e commerce ecosystem and rural penetration.
•  Increasing the number of years within which the tax holiday can be availed by startups
in the e-commerce industry.
Boost Export HOW? = Foreign Trade Policy 2015-20
• TERMS- TRADE AGREEMENTS (RTA)
• Free Trade Agreement (FTA): A free trade agreement is a preferential arrangement in
which members reduce tariffs on trade among themselves, while maintaining their
own tariff rates for trade with nonmembers.
• Customs Union (CU): A customs union (CU) is a free-trade agreement in which
members apply a common external tariff (CET) schedule to imports from non-
members.
• Common Market (CM): A common market is a customs union where movement of
factors of production is relatively free amongst member countries
• Economic Union (EU): An economic union is a common market where member
countries coordinate macro-economic and exchange rate policies.
• Trade liberalization, give rise not only to beneficial trade creation but also to trade
diversion. Trade diversion occurs when tariff preferences offered under an FTA causes a
shift of imports from firms in non- FTA member countries to less efficient firms within the
trade bloc, which now become competitive due to tariff reliefs.
5 Stages / evolution
Export
Targets
FTP-2015FTP-2015
1. WTO SPS/TBT: EU/US block
entry of our goods. (e.g.
Mangoes)
2. WTO food subsidies related
issues.
3. WTO trade rounds dragged
for decades without
consensus.
4. Therefore, non-WTO
Bilateral, multilateral and
regional trade agreements
to counter 1+2+3
Trade
Agreement
: WHY?
FTP-2015FTP-2015
CECA, CEPA, BTIA
• Comprehensive Economic
Cooperation Agreements
(CECAs)
• Comprehensive Economic
Partnership Agreements
(CEPAs)
• Broadbased Trade and
Investment Agreements
(BTIA)
• Free trade agreement
• FTA
What’s the difference?
CECA, CEPA, BTIA
• Goods
• Services
• Investment
• IPR
• Movement of people.
• = more trade, jobs than FTA
• Traditionally concerned
with Goods only.
• FTA
What’s the difference? As per FTP-
2015?
Multilateral trade
1+2 = Erode Indian grip over US-EU
markets
50% of world trade captured.
33% of World
Trade
50% of population
Trans-Atlantic Trade and
Investment Partnership
Between US and EU
~0% import duty for their
products= India hurt.
Stringent quality norms,
environment norms = Indian
hurt.
E.g. pesticide residues in
oranges (Nagpur vs Florida);
Lead / heavy metals in mfg.
goods/toy etc.
TATIP
AgreementAgreement
~0% import duty for their
products= Tariff barrier for
India, China
Stringent quality norms,
environment norms, faster
clearance to US/EU = Non-
Tariff barrier for India China.
E.g. pesticide residues in
oranges (Nagpur vs Florida);
Lead / heavy metals in mfg.
goods/toy etc.
TATIP
AgreementAgreement
TPP: 12 members :USA + Canada +
10 Asia-Pacific
1. Trans pacific partnership
2. ▲ Export of “Made in
USA” goods and services.
3. Tariff barriers: 0%
4. Non tariff barriers:
Minimal.
5. Sync. All partners with
American environment,
labour, IPR laws
Salient
Features
TPPTPP
RCEP: China, India, ASEAN, Jap,
Korea, Aus., NZ
1. TPP: timing and terms yet
unclear
2. If we want to join, then must
reform environment, labour,
IPR front in advance, to
align with developed
nations.
3. India cannot be a part of it
bcoz our social-economic
development goals.
Compliance Cost high Agro,
Mfg. & service industries.
India
should join
TPP?
RCEP/TPPRCEP/TPP
R
C
E
P
M
e
m
b
e
r
1. India: a member.
2. Obligations to reform
environment / Labour laws:
not much.
3. Generous Exemptions to
protect local industry: yes
4. lenient time-tables for
implementation: yes
5. Ideal to join such global
value added chain. Produce
in nearest low cost
destination. (CMLV)
RCEP
Trade
grouping
Trade
grouping
~400 trade agreement in
action among countries
India should Make
agreements with countries
where
1.India has potential
market
2.India can source raw
material / components.
Way
ahead?
FTP-2015FTP-2015
FTP-2015: Region wise Strategies (8)
Export
Targets
FTP-2015FTP-2015
Salient features of EXIM Policy 2015-2020-
• Merchandise Export from India Scheme: The 6 different schemes of the earlier FTP (Focus Product
Scheme, Market Linked Focus Product Scheme, Focus Market Scheme, Agriculture Infrastructure Incentive
Scrip, Vishesh Krishi and Gram Udyog Yojana and Incremental Export Incentive Scheme) which had varying
sector-specific or actual user only conditions attached to their use have been merged into a single scheme,
namely the Merchandise Export from India Scheme (MEIS).
• Service Export from India Scheme: The Served from India Scheme (SFIS) has been replaced with the
Service Export from India Scheme (SEIS). The SEIS applies to 'service providers located in India' instead of
'Indian service providers'. Thus, it provides for incentives to all service providers of notified services who are
providing services from India.
• Incentives (MEIS & SEIS) to be available for SEZs: EXIM Policy 2015-20 extends the benefits of the MEIS
and SEIS to special economic zones (SEZ) as well, which will give a new impetus to the development and
growth of SEZs.
•Other Measures:
(a) Under the Export Promotion Capital Goods (EPCG) scheme, in case capital goods are procured from
indigenous manufacturers, specific export obligation has been reduced to 75%. This is designed to help the
indigenous capital goods manufacturing industry.
(b) Under the MEIS, export items with high domestic content and value addition have generally been
provided higher levels of incentives.
(c) EASE OF BUSINESS-
Hard copies of applications and specified documents which were required to be submitted earlier for
incentive schemes and duty exemption schemes have now been dispensed with.
- Landing documents of export consignments as proof for notified market can now be digitally uploaded as
specified.
-There will be no need to submit copies of permanent records/documents repeatedly with each application,
once the same are uploaded in the exporter/importer profile.
- Dedicated e-mail addresses have been provided for faster and paperless communication with various
committees of the Directorate General of Foreign Trade (DGFT), e.g. Norms Committee and Exim
Facilitation Committee.
CURRENT AFFAIRS100 PER CENT FDI IN E-COMMERCE
E-commerce in India
 The e-commerce industry has grown rapidly in India logging a growth rate of over 60 per cent.
 Studies have pegged the size of the industry at around USD 38 billion by 2016 and it is expected to touch
USD 50 billion mark in 2020.
 It is an industry that has the potential to create jobs and spur economic growth.
 This sector has attracted the maximum FDI in 2015.
 Some of the prominent e-commerce marketplace players in India are Amazon, Flipkart, Snapdeal,
ShopClues and Paytm - all funded by foreign investors.
 At present, 100 per cent FDI is permitted in B2B transactions under automatic route.
 Companies such as Amazon India, Flipkart, Snapdeal and many others hosted thousands of sellers, were
described as technology enablers rather than e-retailers. They claimed to have no inventory of their own.
That kept them going even with a ban on FDI in e-commerce.
New Guidelines
 Government permitted 100 per cent FDI in the market place format of e-commerce retailing under the
automatic route.
 The government extended the definition of marketplace to include support services to sellers with respect
to warehousing, logistics, order fulfillment, call Centre, payment collection and other services.
 The marketplace model of e-commerce means providing of an IT platform by an e-commerce entity on a
digital and electronic network to act as a facilitator between buyer and seller.
 Further, the inventory-based model of e-commerce means an e-commerce activity where inventory of
goods and services is owned by e-commerce entity and is sold to consumers directly.
 FDI has not been permitted in inventory-based model of e-commerce.
 The guidelines allowed e-commerce marketplace to provide several support services to sellers, but, it said
that such entities will not exercise ownership over the inventory.
 The e-commerce entities providing marketplace will not directly or indirectly influence the sale price of
goods or services and shall maintain level playing field.
CURRENT AFFAIRSAdvantages
 It will give the much-needed clarity to undertake business with certainty in longer term
attracting foreign investment in this sector.
 Enabling the marketplace operator to provide value added services.
Disadvantages
 The new regime will increase bureaucratic discretion and open the door to rent-seeking.
 It has further increased complexity of e-retail by drawing an artificial distinction between
inventory based model and marketplace based e-commerce.
 The cap of 25 per cent on sales by a single vendor in a marketplace may prove to be
restrictive, more so if the vendor sells high value items particularly in sale of electronic
items, where a vendor may be offering exclusive access to certain items or discounts.
 The above limit of 25 percent, without a strong commercial principle, may result in firms
creating newer entities to avoid being caught.
 The rule that states e-retailers “will not directly or indirectly influence the sale price of
goods and services and maintain a level playing field” goes against “pricing freedom” which
is central to the functioning of a market and it also faces practical difficulties in enforcing
this.
Way Forward
Government should dissolve the distinction between physical- and e-retail and simplify
norms that allow businesses to flourish, creating jobs as well as providing a richer array of
goods and services to consumers at the lowest price.
CURRENT AFFAIRS
DIPP notified Guidelines for 100% FDI in B2B E-commerce
The Department of Industrial Policy and Promotion (DIPP) on 29 March 2016 notified Guidelines for 100
percent Foreign Direct Investment (FDI) in Business to Business (B2B) e-commerce. The guidelines were
issued under the Consolidated FDI Policy Circular 2015 that was notified by the DIPP of the Ministry of
Commerce and Industry.
• E-commerce means buying and selling of goods and services including digital products over digital and
electronic network.
• 100 percent FDI under automatic route is permitted in marketplace model of e-commerce.
• FDI is not permitted in inventory based model of e-commerce.
•Marketplace model vs. Inventory model
• Marketplace based model of e-commerce means providing of an information technology platform by an
e-commerce entity on a digital and electronic network to act a facilitator between buyer and seller.
• Inventory based model of e-commerce means e-commerce activity where inventory of goods and services
is owned by e-commerce entity and is sold to the consumers directly.
• Indian Scenario: In India, 100 percent FDI under automatic route is permitted in marketplace model, while
no FDI is permitted in inventory based model of e-commerce.
• In marketplace model, any warrantee or guarantee of goods and services sold will be responsible of the
seller.
Strategies to boost
Salient features of EXIM Policy 2015-2020-
• Merchandise Export from India Scheme: The 6 different schemes of the earlier FTP (Focus Product
Scheme, Market Linked Focus Product Scheme, Focus Market Scheme, Agriculture Infrastructure Incentive
Scrip, Vishesh Krishi and Gram Udyog Yojana and Incremental Export Incentive Scheme) which had varying
sector-specific or actual user only conditions attached to their use have been merged into a single scheme,
namely the Merchandise Export from India Scheme (MEIS).
• Service Export from India Scheme: The Served from India Scheme (SFIS) has been replaced with the
Service Export from India Scheme (SEIS). The SEIS applies to 'service providers located in India' instead of
'Indian service providers'. Thus, it provides for incentives to all service providers of notified services who are
providing services from India.
• Incentives (MEIS & SEIS) to be available for SEZs: EXIM Policy 2015-20 extends the benefits of the MEIS
and SEIS to special economic zones (SEZ) as well, which will give a new impetus to the development and
growth of SEZs.
•Other Measures:
(a) Under the Export Promotion Capital Goods (EPCG) scheme, in case capital goods are procured from
indigenous manufacturers, specific export obligation has been reduced to 75%. This is designed to help the
indigenous capital goods manufacturing industry.
(b) Under the MEIS, export items with high domestic content and value addition have generally been
provided higher levels of incentives.
(c) EASE OF BUSINESS-
Hard copies of applications and specified documents which were required to be submitted earlier for
incentive schemes and duty exemption schemes have now been dispensed with.
- Landing documents of export consignments as proof for notified market can now be digitally uploaded as
specified.
-There will be no need to submit copies of permanent records/documents repeatedly with each application,
once the same are uploaded in the exporter/importer profile.
- Dedicated e-mail addresses have been provided for faster and paperless communication with various
committees of the Directorate General of Foreign Trade (DGFT), e.g. Norms Committee and Exim
Facilitation Committee.
FTP-2015: Region wise Strategies (8)
1. South Asian Association
for Regional Cooperation
2. Mere 20 billion$ trade.
3. Largest trading partner:
Bangladesh > Sri Lanka >
Nepal > Pak.
4. 0% duty market access
given to L.D.C – Bhutan,
Maldives et al.
5. problem: Pakistan
SAARC
Present
FTP-2015FTP-2015
International Credit Rating agencies
Countries are issued sovereign credit ratings. This rating analyzes the general
creditworthiness of a country or foreign government. Sovereign credit ratings take into
account the overall economic conditions of a country including the volume of foreign,
public and private investment, capital market transparency and foreign currency
reserves. Sovereign ratings also assess political conditions such as overall political
stability and the level of economic stability a country will maintain during times of
political transition. Institutional investors rely on sovereign ratings to qualify and
quantify the general investment atmosphere of a particular country.
Fitch Ratings
John Knowles Fitch founded the Fitch Publishing Company in 1913. Fitch published financial statistics
for use in the investment industry via "The Fitch Stock and Bond Manual" and "The Fitch Bond Book." In
1924, Fitch introduced the AAA through D rating system that has become the basis for ratings
throughout the industry. With plans to become a full-service global rating agency, in the late 1990s
Fitch merged with IBCA of London, subsidiary of Fimalac, S.A., a French holding company. Fitch also
acquired market competitors Thomson BankWatch and Duff & Phelps Credit Ratings Co. Beginning in
2004, Fitch began to develop operating subsidiaries specializing in enterprise risk management, data
services and finance industry training with the acquisition of Canadian company, Algorithmics, and the
creation of Fitch Solutions and Fitch Training.
Moody's Investors Service
John Moody and Company first published "Moody's Manual" in 1900. The manual published basic
statistics and general information about stocks and bonds of various industries. From 1903 until the
stock market crash of 1907, "Moody's Manual" was a national publication. In 1909 Moody began
publishing "Moody's Analyses of Railroad Investments", which added analytical information about the
value of securities. Expanding this idea led to the 1914 creation of Moody's Investors Service, which, in
the following 10 years, would provide ratings for nearly all of the government bond markets at the time.
By the 1970s Moody's began rating commercial paper and bank deposits, becoming the full-scale rating
agency that it is today.
Standard & Poor's (S & P)
Henry Varnum Poor first published the "History of Railroads and Canals in the United States" in
1860, the forerunner of securities analysis and reporting to be developed over the next century.
Standard Statistics formed in 1906, which published corporate bond, sovereign debt and municipal
bond ratings. Standard Statistics merged with Poor's Publishing in 1941 to form Standard and Poor's
Corporation, which was acquired by The McGraw-Hill Companies, Inc. in 1966. Standard and Poor's has
become best known by indexes such as the S&P 500, a stock market index that is both a tool for
investor analysis and decision making, and a U.S. economic indicator.
MNC s
• Pros n Cons
POVERTY
 Schemes-MNREGA, Urban and Rural livelihood missions
• Scheme#1: MNREGA Act 2005
• under Rural Development ministry
• Promises minimum 100 days of unskilled manual
work
• To each rural household. (not to each person)
• In a financial year (1st
April to 31st
March)
POVERTYPoverty is the deprivation of common necessities such as food, clothing, shelter and safe drinking water,
all of which determine our quality of life. It may also include the lack of access to opportunities such as
education and employment which aid the escape from poverty and/ or allow one to enjoy the respect of
fellow citizens.
According to World Bank, “Poverty is an income level below some minimum level necessary to meet basic
needs. This minimum level is usually called the “poverty line”.
Definition agreed by the World Summit on Social Development in Copenhagen in 1995:
 Poverty is a condition characterized by severe deprivation of basic human needs, including food, safe
drinking water, sanitation facilities, health, shelter, education and information. It depends not only on
income but also on access to services.
 It includes a lack of income and productive resources to ensure sustainable livelihoods; hunger and
malnutrition; ill health; limited or lack of access to education and other basic services; increased morbidity
and mortality from illness; homelessness and inadequate housing; unsafe environments and social
discrimination and exclusion.
 It is also characterized by lack of participation in decision making and in civil, social and cultural life.
 It occurs in all countries: as mass poverty in many developing countries, pockets of poverty amid wealth
in developed countries, loss of livelihoods as a result of economic recession, sudden poverty as a result of
disaster or conflict, the poverty of low-wage workers, and the utter destitution of people who fall outside
fam support systems, social institutions, safety nets.
Poverty has many dimensions
 A material dimension (food, clothing etc.)
 A psychological dimension (respect, self-esteem, trust, fear)
 A political dimension (power, representation) and
 A social dimension (education, health, work).
:: The latter 2 dimensions point to the fact that poverty, while often suffered alone and in solitude,
requires social cooperation if it is to be eliminated.
POVERTY
- The proportion of the developing world's population living in
extreme economic poverty fell from 28% in 1990 to 21% in 2001.
Most of this improvement has occurred in East and South Asia. In
East Asia the World Bank reported that "The poverty headcount rate
at the $2-a-day level is estimated to have fallen to about 27% (in
2007), down from 69% in 1990." In Sub-Saharan Africa extreme
poverty went up from 41% in 1981 to 46% in 2001.
- Ultra-poverty, a term apparently coined by Michael Lipton,
connotes being amongst poorest of the poor in low-income
countries. Lipton defined ultra-poverty as receiving less than 80%
of minimum caloric intake whilst spending more than 80% of
income on food.
POVERTY
Types- Absolute poverty & Relative Poverty
-Measures- Gini Coefficient & Lorenz Curve
- HPI (Life expectancy, knowlege & std of living)
- GHI (by IFPRI- Internat Food Policy Research Inst)
- MPI (10 INDICATORS)
1. Lakdawala Committee (1984-89)2400 C (Rural)& 2100C
(Urban)
1. Tendulkar Committee (2005-09)-Per Capita Exp per
mnth(Only counts Expenditure on food, health, education,
clothing); 816(R) & 1000 (U) i.e. 27&33 resp per day- PCE
per month; 27 cr poor
TENDULKAR COMMITTEE REPORT :: There has been a growing concern on the official estimates of poverty. In
view of this, Planning Commission set up an expert group under the chairmanship of Suresh Tendulkar to
examine the issue and suggest a new poverty line and estimates. Following are the salient features of the
proposed poverty lines:
1 The expert group has also taken a conscious decision to move away from anchoring the poverty lines to a
calorie intake norm in view of the fact that calorie consumption calculated by converting the consumed
quantities in the last 30 days as collected by NSS has not been found to be well correlated with the nutritional
outcomes observed from other specialized surveys either over time or across space (i.e. between states or rural
and urban areas).
2 NSSO has decided to shift to Mixed Reference Period (MRP) for all its consumption surveys in future, namely,
365-days for low frequency items (clothing, footwear, durables, education and institutional health expenditure)
and 30-days for all the remaining items. This change captures the household consumption expenditure of the
poor households on low-frequency items of purchase more satisfactorily than the earlier 30-day recall period.
The Expert Group decided to adopt the MRP-based estimates of consumption expenditure as the basis for future
poverty lines as against previous practice of using Uniform Reference Period estimates of consumption
expenditure.
3 The estimated urban share of the poor population (described as headcount ratio or poverty ratio) in 2004-05,
namely, 25.7% at the all-India level, is generally accepted as being less controversial than its rural counterpart at
28.3% that has been heavily criticized as being too low. It was decided to recommend MRP-equivalent of urban
PLB corresponding to 25.7% urban head count ratio as the new reference PLB to be provided to rural as well as
urban population in all the states after adjusting it for within-state urban-relative-to-rural and rural and urban
state-relative-to-all-India price differentials.
4 The new poverty lines have been arrived at after assessing the adequacy of private household expenditure on
education and health, while the earlier calorie-anchored poverty lines did not explicitly account for these.
5 It may be noted that although those near the poverty line in urban areas continue to afford the original calorie
norm of 2100 per capita per day, their actual observed calorie intake from 61st Round of NSS of is 1776 calories
per capita. This actual intake is very close to the revised calorie intake norm of 1770 per capita per day currently
recommended for India by the Food and Agriculture Organization (FAO). Actual observed calorie intake of those
near the new poverty line in rural areas (1999 calories per capita) is higher than the FAO norm.
6 Separate allowance for private expenditure on transport and conveyance has been made in the recommended
poverty lines. For rent and conveyance, actual expenditure share for these items were used to adjust the
poverty line for each state.
3. Rangarajan Committee(2012-14)- per mth exp for fam of five (food + nonfood items such as
education, healthcare, clothing, transport (conveyance), rent. + non-food items that meet nutritional
requirements)
4860 (R) & 7035 (U)i.e. 32 & 47 resp per day; 37 cr poor
- ICMR recommendation for calories, proteins & fat- 2155 C,48gm & 28gm Rural and 2090C,50 gm &
26 gmUrban+-10%
--Controversy
4. Saxena Committee for BPL Census in Rural area(2009)-
Automatic exclusion like double the avg agri land of dist,four or three wheelers , mechanised farm eqpt
like tractor,thresher,salary 10000, ITR
Automatic inclusion like primitive tribal group,mahadalit, family head as minor or destitute or disabled or
single woman.
5. Hashim Committee for BPL fam in Urban Areas
• Highest rural poverty
• Odisha, MP,Bihar,Assam
• Lowest poverty
• Kerala (7.1%),Himachal (8.1%),Punjab (8.3%)
• Engel’s law says: when income rises, % of overall income spent on food item decreases.
We can see this happening in urban areas. Urban popln spending ~39% while villagers spending ~49% of
their income on food.
• Among states: Kerala spends the least money on food.
• Principles of Amartya Sen offer useful alternative
to understand poverty. Capability approach to
understanding poverty goes beyond income and
stresses the whole range of means, available to
achieve human capabilities such as literacy,
longevity and access to income. From this
viewpoint, poverty is seen as the failure of some
basic capabilities to function- a person lacking
the opportunity to achieve some minimally
accepted level of these functionings.
Social & distributional justice
CURRENT AFFAIRS
 Niti Aayog supports Tendulkar Poverty estimates-
The country has witnessed reigning controversies on the subject of
determining poverty line over the decades since Independence. Following the
criticism of poverty estimates recommended by Tendulkar and Rangarajan
Committee, had led the government to appoint a Niti Aayog task force to
devise ways of reducing poverty.
The Panagriya-headed Niti Aayog task force on Eliminating Poverty has backed
the Tendulkar poverty line. This poverty line categorises people earning less
that Rs. 33 a day as poor.
The Niti Aayog has argued that poverty line is just an indicator and not
identification of the poor in the country. The State governments use BPL
census viz Socio-Economic Census 2011 to identify the poor in the state.
The task force defends a low poverty line arguing that a high poverty line
would only track the number of people who have achieved a certain level of
comfort and would do precious little in terms of correctly identifying and
targeting the actual poor in the country.
UNEMPLOYMENT
• TYPES- 1. INVOLUNTARY (No Demand)
2. STRUCTURAL (Tech Change)
3. CYCLICAL (Unempl during downtrend)
4. FRICTIONAL (Change of job)
RURAL UNEMPLOYMENT- 1. SEASONAL
2. DISGUISED
3.UNDEREMPLOYMENT
• The National Sample Survey Organization (NSSO),since its inception in 1950, does the measurement of employment /
unemployment in India.
• The National Sample Survey Organization (NSSO) provides three different estimates of employment and unemployment based
on different approaches / reference periods used to classify an individual’s activity status. These are the
• Usual status approach with a reference period of 365 days preceding the date of survey
• Current weekly status approach with a reference period of seven days preceding the date of survey
• Current daily status approach with each day of the seven days preceding date of survey as the reference period.
• In order to find out whether an individual is employed or unemployed it needs to be first determined whether h/she belongs to
the ‘Labour Force’ or not, which in turn depends on the Activity Status of the individual during the chosen reference period.
• Activity Status refers to the activity situation in which the individual is found during the reference period with respect to his
participation in economic or non-economic activities.
• The NSSO defines following three broad Activity Status i) Working (engaged in an economic activity) i.e. ‘Employed’ ii) Seeking
or available for work i.e. ‘Unemployed’ iii) Neither seeking nor available for work.
• All those individuals having a broad activity status as i) or ii) above are classified as being in the Labour Force and those having
activity status iii) are classified as outside the Labour Force. Thus labour force constitutes of both employed and unemployed.
• In other words, Labor force (also called work force) is the total number of people employed or seeking employment in a country
or region.One is classified as ‘not in labour force’, if he or she was engaged in relatively longer period in any one of the non-
gainful activities
• The NSSO collected employment data based on ‘usual status (UPS)’ only upto its eighth round. However from 9th round
onwards, it started collecting data based on ‘current weekly status (CWS)’ approach also. Planning Commission set up the
Committee of Experts on Employment Estimates (Dantwala Committee) in 1960. The Committee recommended concepts and
definitions for conducting such surveys. It recommended collection of data based on CDS in addition to UPS and CWS.
Accordingly, beginning with the 27th round (1972-73),quinquennial(5-yearly) surveys were being conducted by NSSO to
collect employment-unemployment data based on all the three approaches of UPS,CWS and CDS.
• In the annual survey rounds of NSSO, only employment-unemployment data based on ‘usual activity status’ and ‘current weekly
status’ were collected up to 59th round. However in 60th round, a separate schedule was canvassed to collect employment and
unemployment data on ‘current daily status’ also. In fact, since 60th round, NSSO is collecting data on employment and
unemployment on current daily status also in its annual rounds.
• NSSO surveys are conducted on quinquennial basis. In order to measure employment-unemployment on an annual basis,
Employment-Unemployment Survey is being conducted by Labour Bureau since 2009. This survey also captures the labour
estimates in terms of usual principal status, usual principal and subsidiary status, current weekly status and current daily status
• NSSO defined work or gainful activity as the
activity pursued for pay, profit or family gain
i.e. Activity which adds value to national
product.

MPSC मुख्य परीक्षा २०१६. अर्थशास्त्र भाग १. सामान्य अध्ययन पेपर ४

  • 1.
  • 2.
    INDIAN ECONOMY -Syllabus &meaning of Concept - Types & Process of Planning - Historical aspects & Timeline of Plg - Review of Five yr plans - NITI Aayog - 14th Finance Commission
  • 3.
    Timeline of planningin India 1934-M. Visvesvarayya plan in his book “The planned economy of India”. 1934- FICCI plan 1938- Nehru’s Congress plan. But not implemented due to WW2. 1944- ‘Bombay plan’ by noted industrialists such as JRD Tata, GD Birla, Kasturbhai Lalbhai et al. 1944- Sriman Narayan Agrawal’s ‘Gandhian plan’. 1945- MN Roy’s “People’s plan” – with socialist leanings. 1950- Jayprakash Narayan’s ‘Sarvodaya Plan’ based on Vinoba Bhave’s philosophy. 1950-Cabinet resolution to form Planning commission. 1952- National Development council (NDC) made by Cabinet resolution. 2014 - Modi shuts down planning commission. 2015 - Government notified the formation of Niti Aayog- National Institution for Transforming India.
  • 4.
    Five Year plansin India Plan Period Theme/Model/target 1st (2.1 vs 3.6) 1951-56 Harrod Domar Model - Main focus: Agriculture, irrigation and power. - Got more GDP growth than its original target; - Importance to Agri; Only FY plan when inflation reduced -CDP(1952),NES(1953) -DVC;Bhakra Nangal,Kosi;Hirakund. - Sindri Fertilizers;Chittaranjan Locomotives;HAL 2nd (4.5 vs 4.21) 1956-61 P.C.Mahalanobis Model Socialist model, Rapid industrialization, heavy industries. -Importance to Heavy Industries; -2nd IPR(1956),IADP -BHEL,Bhilai Steel Plant(Indo-Russia), Rurkela Steel Plant (Indo- German), Durgapur(Britain,Germany, Russia & India). - Nangal Fertilizers;Rurkela Fertilizers 3rd (5.6 vs 2.7) 1961-66 Sukhmoy Chakraborty and Sanddy Also called “Gadgil Yojana”. Failed to achieve target due to droughts and wars with Pak-China -CACP, FCI Holidays 1966-69 - Holiday Plan; - Devaluation of currency (1966);Green Revolution 4th (5.7 vs 2.0) 1969-74 Ashok Rudra-Alon Manney - Growth with stability and self-reliance. - Failed due to Bangladeshi refugee problem and drought. - Nationalization of banks;MRTP Act (1969);FERA Act (1973) - DPAP; Op Flood
  • 5.
    Five Year plansin India Plan Period Theme/Model/target 5th (4.4 vs 4.8) 1974-79 -Focus on poverty removal and self-reliance -Originally it was a 10 year long term perspective plan -Satrted politicization of plg as PC tool -TRYSEM,DDP,ICDS Rolling Plan 1978-80 -Morarji Desai’s Janta government came up with Rolling plan - We’ll measure progress every year (for sectoral areas) and make new plans accordingly for next year. - Adv of flexibility and reducing gap betn expected & achieved growth rate - DIC for devlt of SSIs 6th (5.2 vs 5.5) 1980-85 - Poverty removal & Empl generation, - IRDP(1980), NREP(1980), DWCRAetc. -Nationalization of 6 banks(1980),NABARD(1982),EXIM(1982) 7th (5.0vs 6.0) 1985-89 -Focus on Employment - First time Indicative Plg in S&T. -Perspective plan for 1985-2000 -JRY,NRY,CAPART 2 Annual plans 1989-91 -Political & Eco instability at Centre. So only annual plans. 8th (5.6 vs 6.7) 1992-97 -John W.Miller model. - PV Narasimha Rao- LPG reforms - LPG;Rethinking on role of State;Thrust on social sector
  • 6.
    Five Year plansin India Plan Period Theme/Model/target 9th (6.5 vs 5.5) 1997-2002 Growth with social justice and equity. - Issue of fiscal consolidation became top priority; - Reducing subsidies,decentralisation - Failed due to global slowdown after Asian financial crisis. FEMA (1999),,PMGSY(1999),PMSRY(1997),AAY(2000),SSA(2001) 10th (8.0vs 7.7) 2002-07 - People’s plan with more involvement of NDC - -Monitorable targets(27 targets, 6 areas) - -VAT (2005),Bharat Nirman(2006), NREGS(2006),JSY(2005) - 8% GDP growth rate, double per capita income in 10 years. 11th (9.0/8.1 VS 7.9%) 2007-12 Theme: “inclusive growth” - C.Rangarajan framed it with targets: 8-10% growth rate, 70 million new jobs, lower IMR, CMR, TFR etc 12th (9.0) 2012-17 Theme: “Faster, More inclusive and sustainable growth”. Target growth rates: 9% GDP, 4% Agriculture, 10% Mfg. 10% reduction in poverty, create 50 million new jobs. Get IMR:26, MMR:1 per 1000,Child Sex ratio: 950, TFR: 2.1 Increase mean school years, forest cover, infrastructure investment, rural tele-density.
  • 7.
    What is thetheme of 12th Five Year plan?  Theme=Faster, sustainable and more inclusive growth.  Faster growth= GDP should grow at 9% per year.  Sustainble growth = Today’s development without hampherig tomorrow’s future.  More inclusive growth= Women, SC,ST,BPL, Physically challenged and minorities should also benefit from 9% GDP growth. + The fruits of Growth should be spread all over India and should not get concentrated in a few big states only. What are the main targets of 12th FYP?  Every year GDP should grow the 9%. (this was the original target but in Oct 2012, new target is 8.2% per year).  Every year Agriculture sector should grow at 4%, because Higher agricultural growth would provide income benefits to the rural population and It’ll also reduce food inflation.  Every year, manufacturing sector should grow at 10%  At present, 30 per cent of the population is below poverty line. 12th FYP wants to bring down the poverty ratio by 10 per cent.  Major flagship programmes in the Eleventh Plan, would continue in the Twelfth Plan. 1. National Health Mission (NHM), 2. Mahatma Gandhi National Rural Employment Guarantee Act (MGNREGA), 3. Pradhan Mantri Gramin Sadak Yojana (PMGSY) 4. Integrated Child Development Scheme (ICDS) 5. National Rural Livelihoods Mission (NRLM).  Focus Areas: Health, education, infrastructure and skill development  Allocation in the health sector is all set to double.
  • 8.
    • Different Modelsof Investment and Planning related to India includes: • Harrod Domar Model : The model implies that economic growth depends on policies to increase investment, by increasing saving, and using that investment more efficiently through technological advances. It suggests that there is no natural reason for an economy to have balanced growth. It was more or less a One Sector Model. —>Failed to attract investment on consumer goods in India as we lacked good capital goods industries. • Solow Swan Model : The neo-classical model was an extension to the 1946 Harrod–Domar model that included a new term: productivity growth. • Feldman–Mahalanobis model : A high enough capacity in the capital goods sector in the long-run expands the capacity in the production of consumer goods. Thus the essence of the model is a shift in the pattern of industrial investment towards building up a domestic consumption goods sector. It was a Two Sector Model which was later developed into Four Sector Model. Also known as Nehru-Mahalanobis model. Rao ManMohan Model : Policy of Econmic Liberilization and FDI initiated in 1991 by Narasimha Rao and Dr.Manmohan Singh. • Lewis model of economic development by unlimited labour supply. • Induced Investment Model. • Leverage Investment Model.
  • 9.
    Position Planning CommissionNITI Aayog Born - 1950, March 15th 2015, January 1st Chairman - Prime minister PM Vice Chairman - Last Dy.Chairman was Montek Singh Ahluwalia (Cabinet minister rank). Free market economist Arvind Panagriya. He was the Chief economist of Asian Development bank, and the the brain behind Rajasthan’s land-labour reform. CEO-Member-Secretary (IAS) Sindhushree Khullar A secretary level bureaucrat with fixed tenure. Same Ms. Sindhushree Khullar is the first CEO. Ex officio members-Finance Minister & Planning minister PM can nominate four-Union ministers. Modi has nominated following: 1. Home 2. Finance 3. Railway 4. Agriculture Full time members- 4 to 7 full time members, who enjoy “Minister of State” rank. Bibek Debroy (Free market economist) & Dr. V.K. Saraswat (technocrat, missile scientist and Ex-DRDO chief.)
  • 10.
    SpecialInvitees- Union ministers for 1.Transport 2. HRD 3. Social Justice +PM can invite other experts as and when needed. part-time members-Tech experts from research institutes. Currently none declared. Rotational posts. Governing Council- Chairman: Prime minister,Chief ministers of all states,Lieutenant governors of all Union territories. Ad hoc Regional Councils- Will have CMs of states that fall in the region. They’ll be dealing with specific issue concerning a group of states for example irrigation, naxal-problem, infrastructure etc.
  • 11.
    1. Think tankfor Government policy formulation. 2. Find best practices from other countries, partner with other desi-videsi bodies to help their adoption in India. 3. Cooperative Federalism: Involve state governments and even villages in planning process. 4. Sustainable development: + Modi’s Zero defect-zero effect(on environment) manufacturing mantra. 5. Urban Development: to ensure cities can remain habitable and provide economic venues to everyone. 6. Participatory Development: with help of private sector and citizens. 7. Inclusive Development or Antyodaya. Ensure SC, ST and Women too enjoy the fruits of Development. 8. Poverty elimination to ensure dignity and self-respect. 9. Focus on 5 crore Small enterprises– to generate more employment for weaker sections. 10. Monitoring and feedback. Midway course correction, if needed. 11. Make policies to reap demographic dividend and social capital. 12. Regional Councils will address specific “issues” for a group of states. Example: Regional Council for drought, Left-wing extremism, Tribal welfare and so on. 13. Extract maximum benefits from NRI’s geo-economic and Geo-political strength for India’s Development. 14. Use Social media and ICT tools to ensure transparency, accountability and good governance. 15. Help sorting inter-departmental conflicts. Functions & Mandates of NITI AAYOG-
  • 12.
    Niti Aayog: Criticism/Anti-Arguments 1. BibekDebroy (Fulltime member) himself criticized the vaguely worded press-release on Niti-Aayog formation. Modi should have specfically pointed out its functions and jurisdiction. 1. Modi’s “arbitrary decision” to dismantle the Planning Commission, without taking NDC or states into confidence- this undermines cooperative federalism. 2. From union territory only Lieutenant Governors invited. CM of Delhi and Puducherry can’t participate in Governing council. 3. Like PC, NITI Aayog too is a non-Constitutional, non-statutory body formed by a cabinet resolution. It is not accountable to parliament, and if line-ministries fail to achieve targets, NITI Aayog cannot punish them. 4. Niti Aayog should have been created through a legal/Constitutional amendment. There should be a perspective plan spanning for 15 to 20 years. Otherwise, what if another party comes into power and dismantles this. 5. It’ll take minimum 6-8 months for Niti Aayog to set things in motion. In between that time, Development will be halted due to paucity of funds and ideas. 7. Planning commission and NDC decided “special category states” and gave them additional funding to help the poor and backward regions. With advent of Niti Aayog, will those states lose their ‘status’ and extra-funding?.Uncertainty prevails. 8. Niti Aayog will confict with Cabinet Secretariat (for inter-ministerial coordination) and constitutional body Inter State Council (for coordination with states).
  • 13.
    Niti Aayog: Criticism/Anti-Arguments 9.FinMin offcials always try to squeeze budget to keep the fiscal deficit under FRBM targets. Niti Aayog and its free market economists will further reduce welfare schemes to help them. 10. At present we’ve 60+ centrally sponsored schemes. Modi aims to combine them into just 10 schemes. Thus, poor and marginalized communities will suffer. 11. Planning commission used to monitor of human development in the States, Sub-plans for women, SC and ST. Niti Aayog doesn’t say how they’ll do it. 12. Niti Aayog’s mandate repeatedly says they’ll focus on manufacturing sector. Rajan says “just because China succeeded on manufacturing focus, doesn’t automatically guarantee that same Cinderella story will repeat here.” 13. Modi distributed the planning-Expenditure function to FinMin and subject matters to respective ministries. This will result in loss of perspective and long-term view. Now State governments will have to lobby at both type of ministries to get funds released. 14. Planning Commission’s Nehruvian Economists advocated decentralized planning. Modi’s free market economists and technocrats will pursue centralized planning and e- monitoring. 15. 1961: Indian Economic Service (IES) was born on Nehru’s initiative. Modi doesn’t invite them in meetings, free market economists look down upon them with utter disdain. How they’ll be integrated in the new system? No clear answers given in the press-release. 16. There is no need for any Planning commission or Niti Aayog. Good work can be done even without them- through line ministries and interstate councils. Anyways, the real work of NITI Aayog is yet to begin. So, most criticism is centred around the theme that “Since press release doesn’t talk about xyz thing- so only bad thing will happen.”. But, only time will tell how NITI Aayog fares in real life.
  • 14.
    Five Year plansin India Fourteenth Finance Commission Appointed every five years the Finance Commission is a constitutional body with the broad mandate to define centre – state federal relations. Its most important task is to recommend division of states’ revenues collected by the Centre of the ‘divisibility pool’ between the Centre and the states and the share to be allocated to each state. The Fourteenth Finance Commission (FCC) submitted its recommendations to the Government in December, 2014. Some of its important recommendations include the devolution of a significantly higher share of 42 per cent of the divisible pool to states compared with the 32 percent share recommended by the 13th Finance Commission. Accordingly the total devolution to the states in 2015-16 is to be ₹ 5.26 lakh crores which is ₹1.78 lakh crores more than the previous year. This is in response to the demand by the states for increased flow of untied fiscal resources in place of tied resources that come with Centrally Sponsored Schemes. Other recommendations by FCC concern GST, fiscal consolidation, road map and pricing of public utilities, public expenditure management.
  • 15.
    ECONOMIC REFORMS • Meaning-Minimizing role of State & increasing role of pvt sec • Background- Scepticism amongst Developing countries against foreign investments as they feared their dominance & rule of colonisers • Components: 1. Macroeconomic stabilization measures(Boost aggregate demand of economic either domestic or external, domestic by incresing purchasing power of masses by gainful &quality empl opportunities) 2.Structural Reform measures (Boost aggregate supply of goods & services , mostly by capitalists) • LPG : Liberalization shows Direction of Reforms; Privatization shows path of Reforms & Globalization shows the Ultimate goal of Reforms.
  • 16.
    ECONOMIC REFORMS • Liberalization-Pro-capitalistic or Pro- market inclination of an economy; decreasing traits of a state economy; liberalising from shackles of restrictions/regulations of a state economy • Privatization- - Denatiolization- Tfr of State ownership of assets to pvt sector to the tune of 100% -Disinvestment- Denatiolization of state owned enterprises of less than 100% ownership to pvt sector - All the economic policies of State which directly or indirectly promote expansion of role of pvt sector or mkt(deregulation, reducing subsidies,permission to FDI) • Globalization- Increase in economic integration among nations -Unrestricted cross border movement of goods,services, capital or labour force is Globalization(WTO)
  • 17.
    ECONOMIC REFORMS • FIRSTGENERATION REFORMS(1991-2000)- Promotion to pvt sector; Ext sector Reforms like FDI,abolishing QR on imports; Public Sector Reforms to make PSU efficient,profitable,disinvestment; Financial Secor Reforms like Insurance, Banking; Tax Reforms to avoid tax evasion,simplify, broadbase tax. • SECOND GENERATION REFORMS(2001 Onwards)- Factor Mkt Reforms where dismantling Administered Price MechanismPromotion (Remaining Urea, K oil, LPG), Public Sector Reforms for greater autonomy to PSU,disinvestment; Adm Reforms where State from Controller to Fascillitator; Legal Sector Reforms like Labour laws, Company laws; Critical Areas Reforms in Health care,education, agri like R & D in agri,corporate farming.
  • 18.
    ECONOMIC REFORMS • THIRDGENERATION REFORMS- Panchayat Raj Institutes, so that development reaches grass root level; Factor of Inclusiveness • FOURTH GENERATION REFORMS- IT- enabled reforms - Reforms is a simultaneous and continuos process and is a mean to an end.
  • 19.
    CURRENT AFFAIRS  Indiato Appeal against WTO verdict on solar content usage- India is set to file an appeal against a recent verdict by WTO on domestic solar content usage. World Trade Organization has decided in favour of USA, ruling that Indian domestic solar content requirements under its National Solar Mission programme were inconsistent with the international trading norms. The Indian government has set some conditions and rules stipulating a certain minimum percentage of total capacity of solar content manufacturing to be sourced from domestically assembled modules. The U.S. had filed a case against India alleging discrimination against the USA solar equipment with respect to India mandated sourcing of locally produced solar cells and panels by offering subsidies and higher capital to entities using domestic equipment and demanding level-playing field for domestic and foreign solar component manufacturers. Previously, Indian manufacturers had complained against USA alleging dumping in India, which if pursued could have resulted in levying of high anti-dumping duties and penalties against U.S. A. Committed to shielding its domestic manufacturing sector, India is planning to appeal the said verdict of WTO.
  • 20.
    FOURTH INDUSTRIAL REVOLUTION ‘FourthIndustrial Revolution’ or Industry 4.0 is the theme of the 2016 annual meet of World Economic Forum. • It is a collective term embracing a number of contemporary automation, data exchange and manufacturing technologies and denotes a fundamental change in the way business is being done in the present world. • It is characterized by a wave of innovations and fusion of technologies that is blurring the lines between the physical, digital, and biological spheres. • New technology, increased connectivity, artificial intelligence etc. has changed the way any industry functions, the consumer demand and the competition. • The inexorable shift from simple digitization (the Third Industrial Revolution) to innovation based on combinations of technologies (the Fourth Industrial Revolution) is forcing companies to re-examine the way they do business.  The First Industrial Revolution started in the 18th century with the use of water and steam power to mechanize production.  The Second in 19th century used electric power to create mass production.  The Third began in the 1960s and used electronics and information technology to automate production.  Now a Fourth Industrial Revolution is building on the third, that is, the digital revolution. Challenges posed by Fourth Industrial Revolution • Risk of greater unemployment especially low skilled ones has increased • Sustainability of businesses especially small ones is under threat • Disruptions in existing industries as new ways of serving needs are coming up. • The innovators are improving the quality, speed and price of services at a much faster rate due to better access to global digital platforms for research, development, marketing, sales, and distribution. • Growing transparency and consumer engagement would demand more adaptation from the companies. • IT security issues • It also affects the governance system as well.
  • 21.
    GARV APP Why inNews?  Power ministry has launched the GARV (Grameen Vidyutikaran) app to provide the first hand information with respect to village electrification programme in the country. Key Highlights:  To speed up the work related to village electrification Grameen Vidyut Abhiyantas (GVAs or rural electrification engineers) have been appointed.  Reports by these GVAs are shared through the GARV (Grameen Vidyutikaran) app with officials as well as the public. Significance  It will help in monitoring the work of power ministry and respective state authorities by the common man.  The GARV app puts pressure on State governments for timely and quality delivery.  This is very good step towards better accountability and transparency in ensuring village electrification.  It also gives an opportunity to media to scrutinize the rural electrification work of ministry/state governments and seek accountability.
  • 22.
    SETU BHARTAM PROJECT The project aims to make all national highways free from railway level crossings by 2019.  Under the project, 208 bridges will be built at a cost of Rs 20,800 crore.  Also, 1,500 old bridges will be reconstructed, which will cost Rs 30,000 crore.  The ministry has also established an Indian Bridge Management System (IBMS), the aim of which is to carry out condition survey of all bridges (approx. 1,50,000) by using mobile inspection units.  The Project is thought to not only improve road safety but also allow for faster transportation and improve infrastructure network
  • 23.
    CURRENT AFFAIRS Lok Sabhapassed Real Estate (Regulation and Development) Bill, 2015- Main highlights of the Bill • The Bill seeks to regulate transactions between buyers and promoters and provides for setting up of state level regulatory authorities. • It also provides for registration of promoters and agents with the authorities. • The promoters are mandated to deposit 70 percent of the money collected from buyers in a separate bank account, to be used only for construction of that project. • They will also have to disclose project information including details of the promoter, land status, status of approvals, agreements along with details of real estate agents and contractors. • Projects under construction are also required to be registered with the RERA. • If builders cause delays in transferring properties to buyers, the appellate tribunal would intervene and slap fines on them within 60 days. In case consumers fail to make payments to developers, the appellate tribunal can fine them, too. • It provides for imprisonment of up to three years in case of promoters and up to one year in case of real estate agents and buyers for any violation of orders of Appellate Tribunals or monetary penalties or both. • The builders would also be responsible for fixing structural defects for five years after transferring the property to a buyer. • Buyers will now be paying only for the carpet area and not the super built-up area. • The developers will now have to take consent of 66 per cent of the homebuyers in case they have to increase the number of floors or change the building plans. This will protect the buyers from any ad-hoc changes that are a norm presently. • Projects only below the size of 500 square meters are exempted from the accountability ambit compared to earlier 1000 square meters or 12 apartments. -The real state sector is the second largest employer after agriculture and contributes 9% to the Gross Domestic Product (GDP).
  • 24.
    CURRENT AFFAIRSLok Sabhapasses National Waterways Bill- The National Waterways Bill, 2015, which provides for declaring certain inland waterways as national waterways, was passed by the Lok Sabha recently. The bill seeks to declare 106 additional inland waterways as national waterways. After the inclusion of 106 additional inlands waterways to the existing five national waterways, the total number of national waterways goes upto 111. The Bill repeals the five Acts that declare the existing national waterways. These five national waterways are now covered under the Bill. Significance of this Bill: Inland waterways, comprising rivers, lakes, canals, creeks and backwaters, extend about 14,500 km across the country. However, potential of this mode of transport has not been fully exploited so far. The Statement of Objects and Reasons of the Bill states that while inland waterways are recognised as a fuel efficient, cost effective and environment friendly mode of transport, it has received lesser investment as compared to roads and railways. Thus, the central government has come up with this policy. It should be noted here that under the Union List of the Seventh Schedule of the Constitution, the central government can make laws on shipping and navigation on inland waterways which are classified as national waterways by Parliament by law.
  • 25.
    CURRENT AFFAIRSSingapore pipsMauritius as India’s top FDI source Singapore has replaced Mauritius as the top source of foreign direct investment (FDI) into India during the first half of the current financial year. According to the recently released data from the Department of Industrial Policy and Promotion (DIPP), during April-September 2015, India has attracted $6.69 billion (Rs 43,096 crore) FDI from Singapore while from Mauritius, it received $3.66 billion (Rs 23,490 crore). Foreign investment from Singapore was $2.41 billion in the year-ago period. Sectors that attracted the highest foreign investment during April- September 2015 include computer software and hardware ($3.05 billion), trading ($2.30 billion), services and automobile ($1.46 billion each) and telecommunications ($659 million). Foreign investment is crucial for India, which needs about $1 trillion by March 2017 to overhaul infrastructure such as ports, airports and highways, and to boost growth.
  • 26.
    Question: Which theinternational non-governmental organization released a report named “An Economy for the One Percent” on the global economic inequality? (a) Oxford (b) Oxfam (c) IBRD (d) IMF Ans (b) Related facts:  On 18 January 2016, Oxfam an international non-governmental organization released a report named “An Economy for the One Percent” on the global economic inequality.  The report analyzed growing trends of concentration of wealth across the world and suggested remedies to correct the anomaly.  According to the report richest 1% now has more wealth than the rest of the world combined. Power and privilege is being used to skew the economic system to increase the gap between the richest and the rest.  In 2015, just 62 individuals had the same wealth as 3.6 billion people. This figure is down from 388 individuals as recently as 2010.  According to the report the wealth of the richest 62 people has risen by 44% in the five years since 2010 – that's an increase of more than half a trillion dollars ($542bn), to $1.76 trillion.  According to Oxfam since the turn of the century, the poorest half of the world’s population has received just 1% of the total increase in global wealth, while half(99%) of that increase has gone to the top 1%  The average annual income of the poorest 10% of people in the world has risen by less than $3 each year in almost a quarter of a century. Their daily income has risen by less than a 1% every year.  The name Oxfam comes from the Oxford Committee for Famine Relief, founded in Britain in 1942, it has distributed food among affected women and children in the Second World War.
  • 27.
    Question: What wasthe theme of World Development Report released -2016 released on 14 January 2016? (a) Risk Management (b) Climate change (c) Digital Dividend (d) Transition Economies Ans (c) Related facts:  On January 14, 2016 World Bank had released the World Bank World Development Report -2016. The theme of this year report is “Digital Dividend”.  The report is helpful in understanding impact of the internet, mobile phones, and related technologies on economic development across the world.  According to the report, more than 40 percent of the world's population has access to Internet.  In the past decade, the number of Internet users has increased more than threefold it has been increased from 1 million in 2005 to 3.2 billion at the end of 2015.  China has the largest number of internet users, followed by the United States, with India, Japan, and Brazil filling out the top five.  The lowest mobile penetration is in Sub-Saharan Africa (73 %), against 98 percent in high-incomecountries.  According to the report internet adoption lags behind considerably, only 31% of the population in developing countries had access in 2014, against 80 percent in high-income countries.  Out of world's 3.2 billion Internet users, 1.1 million people use high-speed Internet.  The benefits of digital technologies filter throughout the economy, For businesses, the internet promotes inclusion of firms in the world economy by expanding trade, raises the productivity of capital, and intensifies competition in the marketplace, which in turn induces innovation.  Three main mechanisms to transmit the digital dividend are described as inclusion, efficiency and innovation.
  • 28.
    Q.1) Which ofthe following initiative has not been covered under the Bharatmala Project? a) Construction of roads along India’s borders and coastal areas b) Improving connectivity of nonmajor ports, religious and tourist places c) Development of newly declared national highways in district headquarters d) Improving connectivity by inland waterways Ans d Bhartmala is an ambitious roads and highways project of the NDA government. It involves construction of roads and highways to India’s borders, coastal areas, ports, religious and tourist places as well as over 100 district headquarters. It will involve construction of around 25000 km of road network. Following states will have road construction under this-Gujarat, Rajasthan, JnK,HP, Uk, borders of UP and Bihar near Terai region, Sikkim, Assam, Arunachal Pradesh and upto Indo-Myanamar border in Manipur and Mizoram. Linking with this, road network from Maharashtra to Bengal along the coastal areas will be built. Funding of this will be done mainly by govt itself and rest through PPP model. Benefits are huge, it will be a strong strategic component with respect to national security, act as a multiplier effect in our economy, provide backward and forward linkages to the markets, connect remote mountainous areas, trade and tourism will boost and generation of huge employment. Major challenge is just of environment clearances and land acquisition.
  • 29.
    INDIAN ECONOMY - Infrastructureand basic aspects - Updates on Infrastructure related schemes - Details of PPP Model
  • 30.
    • RURAL &URBAN INFRASTRUCTURE DEVELOPMENT-  Need  Types- Physical/ Economic & Social  Energy: Renewable & NRE; Concept of Sustainable Devlt  RGGVY (2005)- ‘Electricity to One lac villages & One Cr Households  DDUGJY(2015)- 24x7 Rural Electricity; Separate feeders; Metering  100 % village electrification to be achieved by 1 May 2018 (Budget 2016-17)  NSM (2010)- Targets of Solar Energy- 481 MW(2012);1000MW(2013);20000MW(2022);100000MW(2030); 200000 MW (2050).  WTO Dispute of solar appliances with USA.  GARV App- Rural electrification updates.  Concept of Akshay Urja- 20 Aug(Akshay Urja Din);Concept of Akshay Urja(NCE); 87000 MW by 2022.  Problems of Energy Sector- Poor quality coal;Inadequate utilization of Hydroelectricity projects;Scope for NCE resources; Plutonium based FBR to be developed instead of Uranium based PHWR which requires import of Uranium.  FDI- 100% allowed in production, transmission & distribution
  • 31.
    • RURAL &URBAN INFRASTRUCTURE DEVELOPMENT-  Roads- Arteries of infra;Types;Need to develop  Timeline- NHAI(1988)-NHDP(1998)-PMGSY(2000)-PMBJPY(2004)- Bharat Nirman(2006)  Issues- Quality, Funds, No of vehicles  Bharatmala Project; Sagarmala Project  PPP models; Swiss challenge  Rlwys*- Cross subsidization; 100% FDI in Rail Infra,  Sethu Bharatam Project-( aims to make all national highways free from railway level crossings by 2019.)  Bullet train (Mumbai- Ahmedabad) based on Japanese Shinkansen system of bullet trains; 98000 Cr  Shipping & Port- 5 Inland Waterways ( Ganga, Brahmaputra, Mahanadi, Bunkingham canal, Champakara canal + 106 new National Waterways bill(2015) passed.  Airports- Greenfield & Brownfield Projects.  Social Infra- Already discussed in HRD capsule.
  • 32.
    • RURAL &URBAN INFRASTRUCTURE DEVELOPMENT-  Rural Infra – Electricity (DDUGJY); Roads( PMGSY); Sanitation(SBM); General (Bharat Nirman, Sansad Adarsh Gram Yojana, RURBAN, PURA)  Urban Infra- JNNURM, AMRUT, Smart City, Tourism( PRASAD, HRUDAY); RERA Act
  • 33.
    Union Budget 2016-17 RoadSector • Sanction for construction of 10000 kms of new National Highways will be given in 2016-17. This will be much higher than in the two previous years. • In addition, nearly 50000 kms of State highways will also be taken up for upgradation as National Highways. • Policy reforms to Fast-track the development of road sector. Ports • 450 crore rupees were allocated for Sagar Mala Project in 2016-17. • New greenfield ports will be constructed both in the eastern and western coasts of the country. • 800 crore rupees were allocated for the development of this sector including development of National Water Highways. Civil Aviation • The Government will announce a comprehensive action plan for revival of unserved and underserved airports in the country. • At present, there are about 160 airports and air strips with State Governments which can be revived at an indicative cost of 50 crore to 100 crore each. The Union Government will partner with the State Governments to develop some of these airports for regional connectivity. • Similarly, 10 of the 25 non-functional air strips with the Airport Authority of India will also be developed.
  • 34.
    • . • () • , • ( )- • ,, , .
  • 35.
  • 36.
    RAIL BUDGET 2016-17 Themeof the Budget is Overcoming challenges – Reorganize, Restructure, Rejuvenate Indian Railways: ‘Chalo, Milkar Kuch Naya Karen’. Railway Budget of 2016-17 is based on three pillars and they are Nav Arjan (New Revenues), Nav Manak (New Norms) and New Sanrachna (New Structures). Major Highlights of the Rail Budget • Delay in running of 95% trains will be ended by 2020 • Rail tickets will be available at all places by 2020 • Aimed at increasing speed of passenger train by 80km/hr • LIC has agreed to invest 1.5 lakh crore rupees over 5 years on extremely favourable terms • New Dedicated Freight Corridors announced, namely Delhi-Chennai, Kharagpur-Mumbai, Kharagpur-Vijayawda. • To commission broad gauge lines at the rate of 7 km per day against 4.5 km over last five years • Institutional financing will be introduced for funding projects • Aimed at eliminating unmanned level crossings by 2020 • North-East India, especially Mizoram and Manipur, to be connected through broadgauge soon • To commission 2800 km of new tracks in 2016-17 • Indian Railways to surpass ambitious target of commissioning 2500 kms of broad gauge lines, almost 30% higher than last year • e-ticket facility for foreign debit and credit card holders will be provided • Cancellation facility through 139 helpline number will be provided • Journalists to get facility of e-booking of tickets on concessional passes • Bar-coded tickets will be introduced on pilot basis, this will help to tackle menace of ticketless
  • 37.
    CURRENT AFFAIRS • Overnightdouble-decker trains to be introduced on business travel routes • Long distance superfast train Antyodaya Express for unreserved passengers will be launched • Deen Dayal coaches for long distance trains for unreserved passengers will be introduced • Full-fledged Railway University will come-up soon • Enhanced capacity of e-ticketing system from 2000 tickets/min to 7,200/min. • A framework will be formulated where net saving from electrification will be ableto finance capital expenditure. • Wi-Fi will be provided at 400 railway station in 2016-17, as compared to 100 in 2015-16 • 2000 km of electrification proposed for 2016-17 • Chennai will have India’s first rail auto hub. Railway Ministry will partner with Tamil Nadu Government to develop suburban network in Chennai through innovative financing methods • FM radio stations will be invited to provide train borne entertainment via PA systems • Rail Bandhu magazine will be published in all regional languages • Coolies have been renamed and will be called ‘Sahayaks’ • 50 crore rupees kept aside for providing innovation grants to start-ups • Drones will be used for remote monitoring of ongoing projects • 33 percent sub-quota for women under all reserved categories • Advertising revenue to be increased by more than four times in 2016-17
  • 38.
    Golden vs. Diamondquadrilateral
  • 39.
    PPP in Airport start/ rebuild something where start / rebuild something where
  • 40.
    PPP Model - Definition -Charactristics - Types - Pros & Cons - Swiss challenge
  • 41.
    3 roles ofGovernment in INFRA. Development?
  • 42.
    PPP Model -The firstBOT was for the China Hotel, built in 1979 by the Hong Kong listed conglomerate Hopewell Holdings Ltd. Types- 1.BOT (build–operate–transfer) 2.BOOT (build–own–operate–transfer) 3.BOO (build–own–operate) 4.BOLT (build–own-lease–transfer) 5.DBFO (design–build–finance–operate) 6.DBOT (design–build–operate–transfer)e.g. Refinery construction 7.DCMF (design–construct–manage–finance) 8. JV 9.MC
  • 43.
    PPP Model BOO (build–own–operate)- Ina BOO project ownership of the project remains usually with the project company for example a mobile phone network. Therefore, the private company gets the benefits of any residual value of the project. This framework is used when the physical life of the project coincides with the concession period. A BOO scheme involves large amounts of finance and long payback period. Some examples of BOO projects come from the water treatment plants. This facilities run by private companies process raw water, provided by the public sector entity, into filtered water, which is after returned to the public sector utility to deliver to the customers.
  • 44.
    PPP Model BOLT (build–own-lease–transfer) UnderBLT a private entity builds a complete project and leases it to the government. On this way the control over the project is transferred from the project owner to a lessee. In other words, the ownership remains by the shareholders but operation purposes are leased. After the expiry of the leasing the ownership of the asset and the operational responsibility are transferred to the government at a previously agreed price. For foreign investors taking into account the country risk BLT provides good conditions because the project company maintains the property rights while avoiding
  • 45.
    PPP Model DBFO (design–build–finance–operate)- Design–build–finance–operateis a project delivery method very similar to BOOT except that there is no actual ownership transfer. Moreover, the contractor assumes the risk of financing till the end of the contract period. The owner then assumes the responsibility for maintenance and operation
  • 46.
    PPP Model DCMF (design–construct–manage–finance) Someexamples for the DCMF model are the prisons or the public hospitals. A private entity is built to design, construct, manage, and finance a facility, based on the specifications of the government. Project cash flows result from the government's payment for the rent of the facility. In the case of the hospitals, the government has the ownership over the facility and has the price and quality control. The same financial model could be applied on other projects such as prisons. Therefore, this model could be interpreted as a mean to avoid new indebtedness of public finance.
  • 47.
    • MAHARASHTRA ECONOMY:SALIENT FEATURES Agriculture Although Maharashtra is a highly industrialized state of India, agriculture continues to be the main occupation in the state. 64.14% of the people are employed in agriculture and allied activities. Most of the cultivable land is still rainfed, the Southwest Monsoon season between June and September is critical to the food sufficiency and quality of life in the state. Therefore, the agricultural calendar of Maharashtra and other parts of India, is governed by Monsoon. Any fluctuations in the time distribution, spatial distribution or quantity of the monsoon rains may lead to conditions of floods or droughts causing the agricultural sector to adversely suffer. This has a cascading effect on the secondary economic sectors, the overall economy, food inflation and therefore the overall quality and cost of living for the general population. Districts in Western Maharashtra on the Deccan plateau such as Pune and Ahmadnagar are particularly prone to drought.  Irrigation facilities are being extended so that agriculture could be made less dependent upon rain water. Maharashtra has by far the largest number of Dams in India. Despite that, the net irrigated area totals only 33,500 square kilometres or about 18% of cultivable land.  Principal Monsoon crops include Rice, jowar, and Bajra. Other crops include Wheat, pulses, vegetables and onions. The main Cash crops include cotton, sugarcane, turmeric, and several oil seeds including groundnut, sunflower and soyabean.  The state has huge areas, under fruit cultivation of which mangoes, bananas, grapes, and oranges are the main ones. Most of the Growers of Cash crops such as sugarcane and cotton in the state belong to farmers cooperatives. For example, most of the sugar production in
  • 48.
    • MAHARASHTRA ECONOMY:SALIENT FEATURES • Industry  Maharashtra is India's leading industrial state contributing 13% of national industrial output. • Almost 46% of the GSDP is contributed by industry. • Maharashtra has had a long History in textiles and Mumbai was the original home of India's textile mills. Solapur, Ichalkaranji, Malegaon and Bhiwandi are some of the cities known for textile industry today . • Sugar industry has made considerable progress specially in the cooperative sector. Maharashtra is well known for the development of cooperative sugar industry whereby the farmers acquire a share in the sugar mills. • Pharmaceuticals, petrochemicals, heavy chemicals, electronics, automobiles, engineering, food processing, and plastics are some of the major industries in the state. • Maharashtra is renowned for the production of three-wheelers, jeeps, commercial vehicles and cars, synthetic fibers, cold rolled products and industrial alcohol. Small scale industries have also come up in a big way in the state. • The state capital Mumbai and the Mumbai Metropolitan Region has historically been the most industrialized area in the state. Industrial development in the state is largely concentrated in the, Pune Metropolitan Area , Nashik, Aurangabad and Nagpur. • The six important industries in the state are cotton textiles, chemicals, machinery, electricals, transport and metallurgy. Pune is emerging as one of the largest automobile hubs in the country. • To attract industries to different areas of the state, the government of Maharashtra established Maharashtra Industrial Development Corporation (MIDC) in 1962. • MIDC provides businesses with infrastructure such as land (open plot or builtup spaces), roads, water supply, drainage facilities etc. To date 233 areas have been developed around the state with emphasis on different sectors such as Industrial, IT, Pharmaceutical, and Wine.
  • 49.
     India's largeststock exchange Bombay Stock Exchange, oldest in Asia, is located in the city. More than 41% of the S&P CNX 500 conglomerates have corporate offices in Maharashtra.  After successes in the information technology in the neighbouring states, Maharashtra has set up software parks in Pune, Mumbai, Navi Mumbai, Nagpur and Nasik, Aurangabad and Latur. • Maharashtra is the second largest exporter of software with annual exports of 18 000 crores and accounts for more than 30 per cent of the country's software exports, with over 1,200 software units based in the state.  Maharashtra ranks first nationwide in coal-based thermal electricity as well as nuclear electricity generation with national market shares of over 13% and 17% respectively. Maharashtra is also introducing Jatropha cultivation and has started a project for the identification of suitable sites for Jatropha plantations.
  • 50.
    FDI IN MAHARASHTRA •Based on DIPP report (2000-2015 data),Gujarat has emerged as the best state to do business, but it is Maharashtra that receives the most foreign direct investment (FDI), followed by the National Capital Region (NCR) of Delhi, Tamil Nadu (and Pondicherry) and Karnataka. • Delhi (including parts of UP and Haryana, likely those that fall within the NCR) accounts for one-fifth (20%) of the total FDI, next only to Maharashtra (including union territories like Dadra & Nagar Haveli and Daman & Diu) with 29% of total FDI, based on cumulative inflows (April 2000 – Jun 2015), according to the June 2015 report of the Department of Industrial Policy and Promotion (DIPP). • Maharashtra is ranked eighth in the ease-of-doing-business ranking. The state, however, leads in obtaining approvals for infrastructure-related utilities and enforcing contracts related to dispute resolution. • Gujarat was ranked first regarding ease of doing business, according to the Assessment of State Implementation of Business Reforms by the Department of Industrial Policy and Promotion (DIPP), based on a study conducted by World Bank and KPMG. • The assessment report has also highlighted the reason for the government to come out with the report: India ranks 142nd out of 189 economies in the World Bank’s Doing Business 2015report and the second-worst-performing economy in South Asia. The World Economic Forum’s Global Competitiveness Reportranks India as 71 out of 144 economies.
  • 51.
    MAKE IN INDIA/MAKEIN MAHARASHTRA WEEK(13-18 Feb) • 8 lac cr investment; 30 lac new employment & 2594 MOUs for Maharashtra.(15.2 lac cr for India) • Participants nations-102 & 17 states; Visitors-9 lac • Maharashtra related important agreements- 1.Twin Star Tech(Vedanta Gr) in Marathwada/ Vidarbha 2000 cr- LCD Fab Project 2. Coca Cola for Oranges processed products 3. Raymonds at Nagpur developing Integrated Textile Project (1400 Cr) 4. Monsanto biggest seed hub of India at Deolgaon Raja(Buldhana) • Naina Project at Khalapur & 3500 Hectare land by farmers. • Magnetic • Arcarobot Warehousing software by Rajesh Manpat • Ease of Doing Business- Maitri for projects above 100 cr
  • 52.
    DROUGHT IN MAHARASHTRA•Maharashtra is experiencing drought this year too. Why does this happen every year? • For this, we need to understand the geographical and climatic situation of Maharashtra. As high as 80% to 84% of the agriculture in Maharashtra is rainfed, which means that it totally depends on rainfall for its crops but there is a huge variability in rainfall in different regions of the state. • One-third of the state falls under the semi-arid climatic zone and has its agriculture dependent on the monsoons. Deficient rainfall is reported once every 5 years and drought conditions occur once every 8-9 years. • Marathwada and Vidarbha have been experiencing severe drought over the last three years due to deficient rainfall and this has further worsened the situation with a drastic drop in groundwater levels, acute water shortages and severe loss of crops during the kharif and rabi seasons. • Despite this happening over and over again, the irrigation in the state is very low at 16% as compared to the national average of 42%. Over-dependence on private sources of groundwater use such as tube wells, bore wells, wells and piped water, limits access of farmers to water resources and has also led to over exploitation and severe drop in groundwater levels in the area. • Thus, the major problem in this area is the lack of assured water supply as no other methods of irrigation are utilised. Rather, irrigation is more developed in western Maharashtra as compared to Vidarbha and Marathwada, which needs it the most. Both regions continue to remain relatively backward in terms of socio-economic indicators as well.
  • 53.
    DROUGHT IN MAHARASHTRA•Is it due to geography, climate change or mismanagement of resources? Geography is a factor that we know about for a long time. Climate change has worsened the situation over the last few years, but what is more worrying is the lack of planning, short sightedness and pure disregard shown for the situation at the policy level. The vulnerable situation of the area is already known, but we still depend on dams for water, which goes to the farmers at a price. • What will the small and marginal farmers do? We still focus on water-intensive crops like sugarcane. for better and assured money. The poor farmer is forced to practice an agricultural model ,based on demand and supply where he is unable to get an output that is at least equal if not more than what he put in. Development of industries and cities have also put an additional load on water resources from dams, which in many cases are diverted to cities. The farmer is thus caught in a web of unending demands and a maze of circumstances from where there is no way out. What is the actual situation of farmers in the area? Who are the ones committing suicide? We have to understand the situation of a farmer in a broader context. Our policies have not looked at the overall development of farming communities. Our farmers in the area are totally dependant on land for their livelihoods. It is only a few farmers that also have other members in the family working in the cities, who can provide additional income to the family in times of crisis. And farming is a resource intensive process. You need money to buy seeds, fertilisers, pesticides, water, manpower, electricity. You put in all the money for resources and then depend on the rain and climate to do their bit. When the vagaries of climate take their toll, the farmer has no way out. He is then caught in the loan web to sow the next crop for the next season. • Take the example of Vidarbha where cotton, tur and soyabeans are the important crops. Low levels of groundwater and irregular supply of electricity makes it very difficult for farmers. There is only 4% irrigation in an area where the capacity for irrigation can be as high as 65%. So the farmers have to invest in tube wells, wells and pipelines in an area which already has dangerously low levels of groundwater. So why then does farming become unremunerative? It is this emphasis on cash crops, overdependence on monsoons, low productivity, poor irrigation facilities and dependence on wells in an area where the water tables have already gone down coupled with poor electrification, which makes it very difficult for the farmer.
  • 54.
    DROUGHT IN MAHARASHTRA•After changes in worldwide policies in 1991, privatisation and free economy have changed banking practises. Banks are not very eager to give loans to farmers. The poor and marginal farmers thus fall into the clutches of moneylenders, who charge higher rates of interest, which the farmers are unable to repay. • With no guarantee of a good crop even during the next season within the limitations they have to face, the farmers continue to borrow from money lenders as they get money on demand. Getting loans from banks and cooperatives often takes long and they have to go through agents at times, who demand commissions. What should be done to deal with this situation? Long term plan- with focus on agri and farmer • For example: • Policies need to be designed to improve the education and quality of life of the farmers and their households along with improvement in infrastructural facilities at the village level. Developing other additional skills or income generating activities among farmers should also be encouraged to make them better equipped to cope with uncertainties arising out of cultivation. • Improvement in bank lending mechanisms that help and respect the farmers and provide support and training should be encouraged, rather than banks functioning as structures that treat the farmer as a poor victim that needs loan waivers. • Non institutional lending mechanisms like moneylenders should be brought under regulation so that they stop charging the farmers high rates of interest that increase the risk of farmers of falling into debt traps. • Efforts need to be made to improve irrigation facilities in rural areas and to stop emphasis on dams. Farmers must be encouraged to harvest and use water in their own areas sustainably and equitably. Local streams, canals in the villages should be identified, deepened and widened to enhance harvesting of water. Rivers should be considered as important units of the village and revived. • Development should be targeted at the village and towards small groups of farmers as units to bring about real change. In our country, farmers suicides have happened due to the failure of the cooperative movement. • For cash crops like sugarcane, grapes and other fruits, cotton, tur and soyabeans, the crop insurance has to be strengthened. Innovative methods for loan settlement should be developed to help farmers to cope in times of financial crisis. • Dependence of farmers on seeds from manufacturers and fertilisers must be stopped by encouraging development of local seed grower families, development of organic local fertilisers and pesticides and further development in products by using Ayurveda rather than using technologies based on western models. • We should encourage research and development that can aid our farmers such as better weather predicting systems, knowledge generation that is based on the day to day needs and queries of farmers. We should encourage better dialogue between agriculturalists and farmers who can work together to find solutions to problems. •
  • 55.
    DROUGHT IN MAHARASHTRA •Jalyukta Shivar Abhiyan- • Drought free Maharashtra by 2019; Long term solution to address both drinking water and irrigation problems. • To make 5000 villages water scarcity free every year. • Involves deepening and widening of strams, construction of cement & earthern stop dams, work on nallahs and digging of farm ponds. • Nodal Offr- DM at Dist level • Criteria for evaluation as accepted during Delivering Change Foundation(DCF) and Pemandu (Performance Management & Delivery Unit of Malaysia). • PMKSY; PMFBY-
  • 56.
    DROUGHT IN MAHARASHTRA •Maharashtra has the maximum number of big dams of any state in India (35 percent of the total), the most expenditure on big dams (40 percent of the total) since Independence with the least amount of cropped area under irrigation (18 percent). But the state has nine effectively "toothless" Acts governing water and irrigation. This lack of water governance may explain the paradox of a state with the largest dam infrastructure facing water scarcity and drought.
  • 57.
  • 60.
    MSME • Small andmedium enterprises are the backbone of industrial development. • It is very important for both developed and developing country .Small and medium enterprises always represented the model of economic development, which emphasized high contribution to domestic production, significant export earnings, low investment requirements, employment generation, effective contribution to foreign exchange earning of the nation with low import-intensive operations. • The development of this sector came about primarily due to the vision of our late Prime Minister Jawaharlal Nehru who sought to develop core industry and have a supporting sector in the form of small scale enterprises.
  • 61.
    Introduction…….. • SMEs sectorhas emerged as a dynamic and vibrant sector of the economy. The Indian economy is expected to grow by over 8 per cent per annum until 2020 and can become the second largest in the world, ahead of the United States, by 2050, and the third largest after China and the United States by 2032. • Hence the need of important contribution from MSME. • Importance of MSME- 8% GDP; 40% of exports; 45% of Industrial output
  • 62.
    Definition of MSME •According to new THE MICRO, SMALL AND MEDIUM ENTERPRISES DEVELOPMENT ACT, 2006 the MSME Definitions are as follows: In the case of the enterprises engaged in the manufacture or production of goods pertaining to any industry specified in the first schedule to the Industries (Development and Regulation) Act, 1951, as
  • 63.
    Definition of MSMEfor Manufacturing sector Manufacturing Sector Enterprises Investment in plant & machinery Micro Enterprises Does not exceed twenty five lakh rupees (< 25 LAC) Small Enterprises More than twenty five lakh rupees but does not exceed five crore rupees (25 LAC TO 5 CR) Medium Enterprises More than five crore rupees but does not exceed ten crore rupees (5 CR- 10 CR)
  • 64.
    Definition of MSMEfor Service sector Service Sector Enterprises Investment in plant & machinery Micro Enterprises Does not exceed ten lakh rupees (<10 LAC) Small Enterprises More than ten lakh rupees but does not exceed two crore rupees (10 LAC to 2 Cr) Medium Enterprises More than two crore rupees but does not exceed five core rupees ( 2Cr to 5Cr)
  • 65.
    Supporting agencies ofSMEs • Some of the important organizations that are associated with SMEs in India are: Small Industries Development Organization (SIDO), National Small Industries Corporation Ltd. (NSIC), Small Industries Development Bank of India (SIDBI), Confederation of Indian Industry (CII), Laghu Udyog Bharti (LUB), Federation of Indian Chamber of Commerce and Industry (FICCI), Associated Chamber of Commerce and Industry of India (ASSOCHAM), National Institute of Small-Industry Extension Training (NISIET), World Association for Small and Medium Enterprises (WASME), Small Scale Industries Board (SSIB), PHD Chamber of Commerce and Industry (PHDCCI), Federation of Indian Exporters Organization (FIEO), Federation of Associations of Small Industries of India (FASII)
  • 66.
    • ROLE OFMSME & ITS SIGNIFICANCE- • Micro, Small and Medium Enterprises (MSME) sector has emerged as a highly vibrant and dynamic sector of the Indian economy over the last five decades. • MSMEs not only play crucial role in providing large employment opportunities at comparatively lower capital cost than large industries but also help in industrialization of rural & backward areas, thereby, reducing regional imbalances, assuring more equitable distribution of national income and wealth. MSMEs are complementary to large industries as ancillary units and this sector contributes enormously to the socio- economic development of the country. • Employment Generation: Small Business sector in India creates largest employment opportunities, next only to Agriculture. It has been estimated that a lakh rupee invested in fixed assets in the sector results in generating employment for four persons. • Production: Small Business sector play a crucial role in the growth of the country by accounting for 45% of the gross manufacturing output. As per estimates, a lakh rupee of investment in fixed assets in the sector produces 4.62 lakh worth of goods or services.
  • 67.
    • The Sectorconsisting of 3.6 cr units, as of today, provides employment to over 8.05 cr persons. The Sector through more than 6,000 products contributes about 8% to GDP besides 45% to the total manufacturing output and 40% to the exports from the country. The MSME sector has the potential to spread industrial growth across the country and can be a major partner in the process of inclusive growth. • MSME- CRUCIAL ROLE- (i)With 3.6 crore units spread across the country, that employ 8.05 crore people, MSME have a contribution of 37.5 per cent to the country’s GDP.(ii) Huge potential for helping address structural problems like unemployment, regional imbalances, unequal distribution of national income and wealth across the country. Due to comparatively low capital costs and their forward-backward linkages with other sectors, MSMEs will play a crucial role in the success of the Make in India initiative. (iii) Number of schemes/programmes like the Prime Minister’s Employment Generation Programme (PMEGP), Credit Guarantee Trust Fund for Micro and Small Enterprises (CGTMSE), Credit Linked Capital Subsidy Scheme (CLCSS) for and promote start-ups for innovation and entrepreneurship in rural and agriculture- based industry.
  • 68.
  • 69.
  • 70.
  • 71.
    • Khadi isthe proud legacy of our national freedom movement and the father of the nation. Khadi and Village Industries (KVI) are two national heritages of India. One of the most significant aspects of KVI in Indian economy is that it creates employment at a very low per capita investment. The KVI Sector not only serves the basic needs of processed goods of the vast rural sector of the country, but also provides sustainable employment to rural artisans. KVI today represent an exquisite, heritage product, which is ‘ethnic’ as well as ‘ethical’. The Sector has a potentially strong clientele among the middle and upper echelons of the society. • Coir Industry is an agro-based traditional industry, which originated in the state of Kerala and proliferated to the other coconut producing states like Tamil Nadu, Karnataka, Andhra Pradesh, Odisha, West Bengal, Maharashtra, Assam, Tripura, etc. It is an export oriented industry and has greater potential to enhance exports by value addition through technological interventions and diversified products like Coir Geotextiles etc. The acceptability of Coir products has increased rapidly due to its ‘environment friendly’ image. • Ministry of Micro, Small & Medium Enterprises (M/o MSME) envisions a vibrant MSME sector by promoting growth and development of the MSME Sector, including Khadi, Village and Coir Industries, in cooperation with concerned Ministries/Departments, State Governments and other Stakeholders, through providing support to existing enterprises and encouraging creation of new enterprises.
  • 72.
    • On 9May 2007, subsequent to an amendment of the Government of India (Allocation of Business) Rules, 1961, erstwhile Ministry of Small Scale Industries and the Ministry of Agro and Rural Industries were merged to form the Ministry of Micro, Small and Medium Enterprises (M/o MSME). This Ministry now designs policies and promotes/ facilitates programs, projects and schemes and monitors their implementation with a view to assisting MSMEs and help them to scale up. • The primary responsibility of promotion and development of MSMEs is of the State Governments. However, the Government of India, supplements the efforts of the State Governments through various initiatives. The role of the M/o MSME and its organisations is to assist the States in their efforts to encourage entrepreneurship, employment and livelihood opportunities and enhance the competitiveness of MSMEs in the changed economic scenario.
  • 73.
    • The schemes/programmesundertaken by the Ministry and its organizations seek to facilitate/provide: • (i) adequate flow of credit from financial institutions/banks; • (ii) support for technology upgradation and modernization; • (iii) integrated infrastructural facilities; • (iv) modern testing facilities and quality certification; • (v) access to modern management practices; • (vi) entrepreneurship development and skill upgradation through appropriate training facilities; • (vii) support for product development, design intervention and packaging; • (viii) welfare of artisans and workers; • (ix) assistance for better access to domestic and export markets; and • (x) cluster-wise measures to promote capacity-building and empowerment of the units and their collectives.
  • 74.
    The opportunities ofgrowth in the SMEs sector • 1. Less Capital Intensive • 2. Extensive Promotion & Support by Government • 3. Reservation for Exclusive Manufacture by small scale sector • 4. Project Profiles • 5. Funding - Finance & Subsidies • 6. Machinery Procurement • 7. Raw Material Procurement • 8. Manpower Training • 9. Technical & Managerial skills • 10. Tooling & Testing support • 11. Reservation for Exclusive Purchase by Government • 12. Export Promotion • 13. Growth in demand in the domestic market size due to overall economic growth • 14. Increasing Export Potential for Indian products
  • 75.
    Factors affecting SMEs •MSMEs in India face several problems such as- 1. lack of availability of adequate and timely credit 2. High cost of credit 3. inadequate infrastructure facilities like power, water and roads, and lack of access to modern technology. 4. limited access to equity capital 5. problems in supply to government departments and agencies 6. procurement of raw materials at a competitive price 7. Issues of storage 8. Designing, packaging and product display
  • 76.
    MSME’s Contribution toExports They may also be in the form of export orders from large units or the production of parts and components has shown excellent growth rates in this decade. The product groups which dominate the exports comprises of sports goods, readymade garments, woollen garments and knitwear, plastic products, processed food and leather products. Further, MSMEs are re-orienting its export strategy towards the new trade regime being ushered in by the WTO.
  • 77.
     NEW INITIATIVES- •Udyog Aadhar Memorandum (UAM): - The UAM scheme, which was notified in September 2015 under section 8 of the MSME Development Act 2006, is a pathbreaking step to promote ease of doing business for MSMEs. - On self-certification basis and no supporting documents - instantly get a unique Udyog Aadhaar Number (UAN) • Employment Exchange for Industries: To facilitate match making between prospective job seekers and employers an employment exchange for industries was launched on June 15, 2015 in line with Digital India. • Framework for Revival and Rehabilitation of MSMEs: Under this framework, which was notified in May 2015, banks have to constitute a Committee for Distressed MSME enterprises at zonal or district level to prepare a Corrective Action Plan (CAP) for these units. • A scheme for Promoting Innovation and Rural Entrepreneurs (ASPIRE): ASPIRE was launched on March 16, 2015 with the objective of setting up a network of technology centres and incubation centres to accelerate entrepreneurship and promote start-ups for innovation and entrepreneurship in rural and agriculture based industry.
  • 78.
    • In orderto protect, support and promote small enterprises as also to help them become self-supporting,a number of protective and promotional measures have been undertaken by the Government. This job is taken up by both centre and state governments. There is separate ministry for MSMEs which helps in following way. • 1. Reservation – Reservation of products for exclusive manufacture in the small scale sector was introduced for the first time in 1967 with the reservation of 47 items. As of July 2010, 20 items are reserved for exclusive manufacture in the small scale sector. • 2. Government has ‘procurement policy’ which prefers SSI – 358 items are also reserved for exclusive purchase from MSE sector. • 3. Interest Subvention schemes are started from time to time. • 4. Technology Upgradation Fund Scheme – under this subsidy is available to small and medium scale industry to adopt new technology. Subsidy is available either on Capital Expenditure, or as interest Subvention. • 5. Export Assistance & Facilities – In certain cases duty free or with concessional rate of Custom Duty, so as to ensure higher production for exports. • There were less restriction for exports by this sector and overall various supporting facilities such as remission of duties paid on input materials were available. • Exporters are recognized as Export House, Trading Houses, Star Trading Houses and Super Star Trading Houses on the basis of certain criteria as laid down in the Export-Import Policy 1997-2002. • Criteria are quantitative targets, such as turnover or FOREX earned. For Small Scale Sector their respective figures are considered 3 times the actual. By this they are granted special import license, which gives them rebate on import duty. • 6. They get government support for participation and exhibition in International Fairs • 7. Technical & Managerial Consultancy Services to the MSME manufacturers/exporters is provided through a network of field offices • 8. The National Small Industries Corporation through its ‘export development program’ is playing a vital role to promote the MSME sector in exporting their products/projects in international, markets by providing following assistance to the small enterprises. • 9. These schemes are Small Scale Industry specific and are available in addition to the general schemes
  • 80.
    - -2016, -2016,-2016, /-2015 . • (, ) . MSME . • , �, , , , , , ,. • Feb, 2006 () , 2015 241 SEZ Proposals 3.59 .
  • 82.
    SEZ • A SpecialEconomic Zone (SEZ) is a territory within a country with special rules for facilitating Foreign Direct Investment for export oriented production, and for purposes of trade and custom duties i.e. ‘DUTY FREE ENCLAVES’. • An SEZ is a geographically demarcated region that has economic laws that are more liberal than the country’s typical economic laws and where all the units therein have specific privileges (World Bank) • EXIM policy defines SEZ as specifically delineated duty-free enclaves and shall be deemed to be foreign territories for the purpose of trade operations and duties and tariffs. • The concept dates back to thirteenth century Spain and in more recent times late 1950’s and early 1960’s to Ireland and Puerto Rico, which established Economic Processing Zones. In the early 1980’s one of the earliest and an exemplary Special Economic Zone ‘Shenzen’ was founded by the government of the Republic of China under Deng Xiaoping. Recently, Puno in Peru has been earmarked to become a “Zona Economica”. In the United States, SEZs are referred to as “Urban Enterprise Zones”.
  • 83.
    Indian Set-Up • Tocomprehend the development of SEZ in India one needs to dwell on the stages of its formation. India adopted a mixed economy after independence. In the year 1950, import substitution was the focus. Foreign trade as a stimulant to economic growth was overlooked and inward looking industrialization was emphasized. The economic policies of 1960’s were geared towards selective import liberalization and export promotion, thus marking the development of Export Processing Zone’s (EPZ’s) in the country. The first EPZ in India which was also the first in Asia was set up at Kandla in 1965. • In India, the Santa Cruz Electronics Export Processing Zone (SEEPZ), was set up at Mumbai in 1974. SEEPZ was initially planned as a single product zone but by 1986 it was made a two product zone providing for gems and jewellery along with processed electronic goods. • Export Oriented Units (EOU) were introduced in the year 1981 which gives customs duty exemption but not tax exemptions.
  • 84.
    • In theyear 1984,emphasis was on growth led export and thus, four more zones were set up in the mid- eighties at NOIDA (NEPZ, Uttar Pradesh), Chennai (MEPZ, Tamil Nadu),Cochin (CEPZ, Kerala), and Falta (FEPZ, West Bengal) and the seventh EPZ in the country was commissioned at Vishakhapatnam (VEPZ, Andhra Pradesh) in 1994. These aimed to provide export facilities with better infrastructure such as telecom, water and power. But the financial incentives were not attractive and bureaucratic red tape hurdles continued. • In the year 1998, the first private SEZ was implemented in Surat. In 2003-04, four new SEZ; Mahindra World City in Jaipur and Chennai, Indore and Manikanchan were created,thereby initiating the development of SEZ in full swing.
  • 85.
    • Salient Featuresof SEZ • As per the SEZ Act, 2005, SEZ in India can be set up by the private sector,state government or joint sector (state sector and private). This offers equal opportunity to both Indian and International private developers. • The country is divided into two territories with Special Economic Zones and Domestic Tariff Area (DTA). The area outside of SEZ is DTA,where laws of the country are applicable. On the other hand, in the SEZ the laws and controls of the country may be applicable only partially as they are lead by special laws. Goods flow from DTA into the SEZ area are treated as exports and goods coming from SEZ area into DTA are treated as imports. • SEZ are of three types:- • a) Multi-product SEZ – occupying minimum of 1000 ha of land, • b) Sector specific SEZ – occupying minimum of 100 ha of land, • c) Gems and Jewellery, IT-ITES – BPO’s and Biotech – SEZ occupying 10 ha of land (may be reduced to 4 ha in special cases). Backward states have the option of relaxation of minimum size of SEZ. • The basic approval of the SEZ lies with the commerce ministry. There is a provision for hundred per cent foreign direct investment (FDI) for all investments in SEZ’s except activities under negative lists. But there is no relaxation for pollution control laws and labour laws. The local regime on these subjects will be enforced. States are required to exempt the electricity duty and sales tax on electricity as well as remove all controls on electricity generation and sale within the SEZ. Private generation, transmission and distribution of power in SEZ are allowed. Developers are even permitted to build roads, airports etc as per their requirement.
  • 86.
    • TYPES OFSEZ • 1. ON THE BASIS OF SECTOR • Sector Specific: Manufacture one or more goods in particular sector. • Render one or more services in particular sector. • Multi-Product SEZ: Manufactures multiple goods in one sector or • multiple sectors.eg Trading and Warehousing. Render two or more services in a sector or multiple sectors. • 2. ON THE BASIS OF AREA • Processing area: Where SEZ units can be located for the manufacture of goods or rendering of services. • Non-processing area: Which is intended to provide support facilities to the SEZs processing area facilility. • 3. ON THE BASIS OF ACTIVITY • Manufacturing SEZ: Apparel, Garments and leather, Automobile and • Auto-component, Engineering-light, heavy and application, • Pharmaceutical, Food processing, Telecom equipment, Computer • Hardware, and Microelectronics, Consumer Electronics and • Appliances, Gems and Jewellery and Diamonds. • Service SEZ: IT enabled Services, Biotechnology, R&D, Health Care, • Financial Services, Knowledge Services, Entertainment, Leisure and • Recreation, Sports and Related Activity, Organised Retail Business • Services Conventional and Exhibitions, Warehousing and Trade • Related Services. • 4. ON BASIS OF APPROVAL STATUS • Formally approved: Given when land is available to set up the SEZ • In principle: Given when the land has not yet been secured but all other • criteria are fulfilled. • Notified: Final stage after which physical development work begins
  • 87.
    • Special EconomicZone is one or more areas of a country where the tariffs and quotas are eliminated and bureaucratic requirements are lowered so that more companies are attracted to the area. The companies establishing in the area also gets extra incentives for doing business. • In India, the policy for setting up SEZ was introduced on April 1, 2000 with a view to provide an internationally competitive and hassle free environment for exports. The policy offered setting up of SEZ in the public, private, joint sector or by State Governments. Prior to Special economic zones, Expert processing Zones (EPZ) were in vogue. With a view to overcome the shortcomings experienced on account of the multiplicity of controls and clearances(SEZ provides ‘single window clearance’), absence of world-class infrastructure, an unstable fiscal regime and with a view to attract larger foreign investments in India, the Special Economic Zones (SEZs) Policy was announced in April 2000. For all specified procedural purposes Special Economic Zones are considered foreign territory within the country. Domestic trade with SEZ is generally eligible for export concessions. • For IT industry there are similar Software Technology Parks . Benefits are available to Export Oriented Units under separate Scheme. • Export Promotion Capital Goods Scheme – Scheme allows import capital goods at zero or concessional custom duty, provided importer exports specified goods of value not less than 6 times duty saved
  • 88.
    • What isan SPV? • . In the USA, the term used is special purpose entity (SPE). The name SPV is given to an entity which is formed for a single, well- defined and narrow purpose. An SPV can be formed for any lawful purpose. No SPV can be formed for an unlawful purpose, or for undertaking activities which are contrary to the provisions of law or public policy. An SPV is, primarily, a business association of persons or entities eligible to participate in the association. According to Joy Jain of PricewaterhouseCoopers, an SPV is mainly formed to raise funds by collateralising future receivables. • Is there a difference between a special purpose vehicle and a company? • SPVs are mostly formed to raise funds from the market. Technically, an SPV is a company. It has to follow the rules of formation of a company laid down in the Companies Act. Like a company, the SPV is an artificial person. It has all the attributes of a legal person. It is independent of members subscribing to the shares of the SPV. The SPV has an existence of its own in the eyes of law. It can sue and be sued in its name. The SPV has to adhere to all the regulations laid down in the Companies Act. Members of an SPV are mostly the companies and individuals sponsoring the entity. e.g. SPV for Turkmenistan-Afghanistan-Pakistan-India (TAPI) pipeline project. Cabinet has also granted permission to GAIL (India) to join the SPV. The Dubai-based SPV, TAPI Ltd., will scout for consortium leader, who will develop and operate the project, arrange finances and be accountable for safe supply of gas through the pipeline. What is an SPV? What is the difference between a company and an SPV? How an SPV is set up? What are the benefits of creating an SPV? What is an SPV? SPV is the acronym for Special Purpose Vehicle which is also called Special Purpose Entity. An SPV is primarily a business association of persons or entities eligible to participate in the association meant for a single, well- defined and narrow lawful purpose. No SPV can be formed for an unlawful purpose, or for undertaking activities which are contrary to the provisions of law or public policy. An SPV is very similar to a company which is mainly formed to raise funds by collateralizing future receivables. What is the difference between a company and an SPV? Although both these entities are established as per Company Act and also follow the all the regulations in the Company Act, the difference lies in the purpose. The company, as distinguished from an SPV, may be called a general purpose vehicle. A company may do several things which are mentioned in the memorandum of association (MoA) or permitted by the Companies Act. An SPV may also do the same, but its scope of operation is limited and focused. The MoA is quite narrow in the case of an SPV. This is primarily to provide comfort to lenders who are concerned about their investment. How an SPV is set up? An SPV is set up with the help of its promoter(s) or sponsor(s). The sponsoring company diverts some of its assets from the rest of the company into an SPV. This isolation of assets creates a distance b/w the SPV and the sponsoring company which is important as it provides comfort to investors by almost insulating the SPV from the ups and downs of the originating entity. What is significant here is the distance b/w the sponsoring company and the SPV. In the absence of adequate distance b/w the sponsor and the new entity, the later will not be an SPV but only a subsidiary company. A good SPV should be able to stand on its feet, independent of the sponsoring company. Unfortunately, this does not happen in practice. What are the benefits of creating an SPV? The key advantage is that it helps in separating the risk and freeing up the capital. As a result, the SPV and the sponsoring company are protected against risks like insolvency, which may arise during the course of operation. The SPV also allows securitization of assets without disturbing the managerial relationship. Under the arrangement, any predictable income stream generated by secure assets can be securitized. •
  • 89.
    • Special InvestmentRegions (SIR) • Special Investment Region (SIR) is a concept similar to Special Economic Zone. However, this is a unique term applied in the territory of one of the states in India called Gujarat. • The Gujarat government has enacted a legal framework for the SIR – The Gujarat Special Investment Region Act – 2009(GSIR -2009) which has come into effect from 6th January, 2009. • SIR refers to an existing or proposed Investment Region with an area of more than 100 sq. Kms or Industrial Area with an area of 50-100 sq. Kms declared so by the Government of Gujarat under Section 3 of the Gujarat Special Investment Region Act – 2009 . • By giving SIR status, Gujarat Government proposes to develop the investment region /industrial area as global hubs of economic activity supported by world class infrastructure, premium civic amenities, centres of excellence and proactive policy framework. • Here "Economic Activity" is defined in the GSIR Act to mean the activities and services including but not limited to industrial, manufacturing, commercial, financial, processing, packaging, logistics, transport, tourism, hospitality, health, housing, entertainment, research and development, education and training, information and communication, management and consultancy, corporate offices and the activities and services connected therewith or incidental thereto and other economic activities as the Apex Authority may specify; • While Special Economic Zones are primarily developed by private parties, the Gujarat Government may set up or designate Government agencies including companies formed under the Companies Act, 1956 as the project development agencies and assign them the powers and functions relating to project Development of a Special Investment Region. • Only Gujarat Government is empowered to establish, develop, operate and regulate the Special Investment Regions (SIR). • An Investment Region or Industrial Area declared as a SIR may be known with the name of its location or its predominant economic activity.
  • 90.
    • 5.0 Strategies: •The State has entered into the phase of second generation economic reforms, with emphasis on structural changes in addition to fiscal incentives for the promotion of industry and balanced regional growth. This has coincided with increasing international competition and rapid technological changes, which pose new challenges for industry. The Industrial Policy 2001 set out below has been formulated in this context, keeping in view the objectives of sustained growth and employment and an expansion in livelihood opportunities. It supplements the provisions of the Information Technology and other sectoral policies announced earlier. The components of the new Package Scheme of Incentives contained in this Policy will be operative from 1st April, 2001 upto 31st March, 2006: • 5.1 Strategies: • New industries establishing in C, D, and D+ areas an No-Industry District(s) will be exempted from payment of Electricity Duty for a period of 15 years. In other parts of the State, 100% Export Oriented Units (EOUs), Information Technology (IT) and Bio-Technology (BT) units, and industries setting up in Special Economic Zones (SEZs), and Electronic Hardware Technology Parks will be exempted from payment of Electricity Duty for a period of 10 years. • 5.2 Waiver of Stamp Duty and Registration Fees: At present, IT units in • Waiver of Stamp Duty and Registration Fees: At present, IT units in public IT Parks are exempted from stamp Duty and Registration fees upto 31st March 2006. Now all new industrial units (including IT and BT units) and expansions, will be exempted from payment of Stamp Duty and Registration fees up to 31st March 2006 in C, D and D+ areas and No-Industry District(s). However, 50% of the Stamp Duty and Registration fees will be waived for IT units set up in other IT Parks in talukas/areas in the State in "A" and "B" categories. • 5.3 Octroi Refund: • The scheme of refund of octroi provided under the Package Scheme of Incentives, 1993 will be included in the new Scheme up to 31-3-2006 on the same pattern. Where account-based cess or other levy is charged instead of or in lieu of octroi, such change will also be eligible for refund as in the case of octroi. • 5.4 Incentives to SSI units: • The subsidy will be disbursed in equal annual instalments over 5 years. Existing SSI and small-scale IT and BT units will be eligible for 75% of the subsidy admissible as above for expansion, diversification or modernization involving additional investment to the extent of 25% or more. • 5.4.2 Interest Subsidy to new textile, hosiery and knitwear SSI units: New textile, hosiery and knitwear small-scale industries setting up indifferent parts of the Start will also be eligible for Interest Subsidy on the interest actually paid to the financial institution/bank on the term loan for creating fixed capital assets, equal to the interest payable at 5% per annum as stated in the table below. The monetary ceiling will be applicable for the complete period of eligibility. 5.5 Development of non-conventional energy:In order to give an impetus to the development of non-conventional energy, such projects will be eligible for benefits under the new Package Scheme of Incentives. • 5.6 Classification of talukas/areas:The present classification of different talukas/areas in the State in A, B, C, D and D+ categories on the basis of their level of development is contained in the Package Scheme of Incentives, 1993, and will continue for the present. The matter of revision of the area classification will be separately considered by a Committee under the Chairmanship of the Minister (Industries). Norms for the mid-term reclassification of talukas depending on changes in their development status will also be considered, and No Industry District(s) will be separately categorized. • 5.7 Financing of capital incentives and refunds under the Package Scheme:A budgetary provision of at least Rs. 200 crores will be made each year from 2001-2002 onwards to meet past commitments and the incentives under the new Scheme. Additional resources will also be raised through bonds linked with Sales Tax repayments under past Schemes. • 5.8 Exemption from Sales Tax for Khadi & Village Industries:24 khadi and village industries are exempt from Sales Tax up to certain limits on annual turnover. Considering the potential of this sector for employment generation and rural industrialization, Sales Tax will also be waived in respect of the 72 remaining industries for their turnover up to Rs. 20 lakhs pr annum. This concession would be available to khadi and village industry units registered with and assisted by the Maharashtra State Khadi and Village Industries Board. • 5.9 Sales Tax on IT products:Up to 31st March, 2006, the Sales Tax rates on IT products would be maintained at the level of the minimum floor rates, wherever applicable. No turn-over tax, additional Sales Tax, surcharge or any other additional levy related to Sales Tax shall be applied to IT products. • 5.10 Sick SSI units:Issues relating to the rehabilitation of sick SSI units are reviewed in the State-Level Inter Institutional Committee and Sub Committee of the Reserve Bank of India, and in the District Level Committee which have been set up as an adjunct of the Zilla Udyog Mitras. Sick SSI units taken up for re-schedulement of arrears of Government and electricity dues, to be repaid in 36 monthly installments at 13% interest. The interest rate on the rescheduled arrears will now be reduced to 10%, in all except 'A' areas of the State. The repayment of such arrears would be allowed in 60 monthly installments. • 5.11 Stamp Duty on Corporate Restructuring:The stamp duty for demerger of companies as defined under section 2(19-AA) of Income Tax Act, 1961 will be made applicable on lines of the stamp duty structure applicable for amalgamation of companies under every order made by the High Court under section 394 of the Companies Act, 1956. • 5.12 Establishment of IT/BT units on textile mill lands in Greater Mumbai:while granting permission for the sale of textile mill lands in Greater Mumbai, the lands becoming available to the Maharashtra Housing and Area Development Authority (MHADA) for residential use would also be permitted to be used for the development of IT and BT industries by MHADA itself, or by MIDC. • 5.13 FSI for IT Units:Twice the admissible Floor Space Index (FSI) is allowed for certain types of IT units setting up in IT Parks promoted by public bodies. Such units are also permitted in No-Development Zones of cities up to FSI of 0.2. Such IT units will now be permitted to establish in No-Development Zones with an enhanced FSI of 1.0. • 5.14 New Industrial Townships:Maharashtra pioneered the establishment or institutions of democratic decentralizations and local self-governance several decades ago. More recently, these concepts were extended through statutory amendments to enable the establishment of independent Industrial Townships. In the first phase, self-governing Industrial Townships with the power to raise resources and determine their application will be established in industrial areas being developed by MIDC at twelve locations across the State, i.e. at Vile-Bhagad (Raigad), Airoli (Thane), Talegaon (Pune), Hinjewadi - Man (Pune), Shendre (Aurangabad), Additional Latur (Latur), Nandgaon Peth (Amravati), Additional Yavatmal (Yavatmal), Tadali (Chandrapur), Butibori (nagpur), Additional Sinnar (Nashik) and Nardhana (Dhule). The industrial townships so set up will pay 25% of their revenue to the concerned Gram Panchayat(s) or local bodies for the initial period of 5 years. • 5.15 Special Economic Zones:The establishment of Special Economic Zones has been allowed under the recent policy of Government of India. India's most successful Export Processing Zone (SEEPZ), which was promoted by the State Government at Mumbai nearly three decades ago, has been converted into one of the country's first Special Economic Zones. Another Special Economic Zone is being developed by the City and Industrial Development Corporation (CIDCO) at Dronagiri, near the Jawaharlal Nehru Port. All the concessions, benefits and facilities extended to such Special Economic Zones promoted by public bodies will also be extended to Special Economic Zones set up by other parties. The establishment of Special Economic Zones at Aurangabad and Nagpur will also be proposed to the Government of India. • 5.16 Specialized Industrial Areas:In the last few years, specialized industrial infrastructure has been developed by State agencies for various sectors, including Information Technology, leather, chemicals, etc. More recently, the establishment of textiles and food processing zones have been taken up. Taking into account the potential and requirements of agro-industry in different parts of the State, MIDC will set up new complexes for this sector, including 'Grape Wine Parks' at Nashik and Sangli, 'Orange City Park' for orange processing, Floriculture Complexes and Biotechnology Parks at suitable locations. • 5.17 Promotion of Education and Research Institutions:Educational and research institutions of international or national standards, including world-class business education institutions, would be provided land in industrial areas/estates at nominal or concessional rates. • 5.18 Captive Power Generation:Captive power generation is permitted for industries throughout the State in respect of IT units, and in the case of co-generation, hydroelectric power and non-conventional energy. Other types of captive power generation are at present permitted in respect of new industries in D+ and tribal areas. New as well as existing industries in D and D+ areas and No Industry District(s) will also be permitted to set up captive power plants. Public bodies or joint ventures promoted by them can establish 'Independent Power Producers' for the dedicated provision of power to IT and BT Park and special Economic Zones promoted by them. • 5.19 Gas Cooperation Agreement:Gas is an important fuel and raw material for industry. As Mumbai High gas supply declines, commercial supply of LNG will become increasingly important for industrial units. To facilitate the planned development of gas supply infrastructure in the State, the Gas Authority of India Limited (GAIL), MIDC and the Maharashtra Petrochemicals Corporation Limited (MPCL) have recently
  • 93.
    • • 1995 . • •. . . , , , , . • • . . . . • • . . • • , . . , . • • , , , . . . • • , , . • • .
  • 94.
    • • . ..   . , . . . . . ( ) ( ) . • : • . . , , , , , , , , , , , , , , . • . . . ( ), .   . , . .
  • 95.
    •         97 19 (1) ( ) . 43 ( ) , . •   1960 14.2.2013 . 13.8.2013 1960 . • . • 2-, . • 24-  , . • 27- . • 73CA- 146 147 /. • 73CB- . • 75- . • 79- . • 83-   6 ( 3 ) . • 88-   ( 6 ) .
  • 96.
    • 97th amendmentaimed at autonomy & transparency in cooperative sector. • Managing committee for 5 yrs instead of 3 yrs • Max cap on strength of a committee members is 21. • Compulsory 2 women & 2 expert coopted members. • Recovery officer from Office of Registrar, Cooperative societies for defaulters action.
  • 97.
    ECO SURVEY DATA •As on 31st March, 2015 there were about 2.26 lakh co-operative societies in the State, with about 539.30 lakh members. • Primary Agricultural Credit Societies (PACS) provide short-term agricultural credits mainly for seasonal agricultural operations. PACS also include Farmers Service Societies and Adivasi Co-operative Societies. As on 31st March, 2015, about 55.2 per cent PACS were in loss. • Dr. Punjabrao Deshmukh Interest Rebate Scheme • Interest subsidy is given to motivate farmers for timely repayment of the short term crop loan. Under this scheme, three per cent interest subsidy is given for the loan up to ` one lakh and one per cent interest subsidy is given for loan amount exceeding ` one lakh but less than ` three lakh. The farmer has to repay the loan by 30th June of each year . • The State provides financial assistance to societies for setting up agro- processing units. Co-operative sugar factories, cotton ginning & pressing, spinning mills, handloom & powerloom, dairy societies & dairy unions and fisheries societies are the major constituents of agro-processing co- operatives. • Members in agro-processing cooperatives-Sugar factories (53%), Dairy (22%),Spinning mills (11%), Fisheries(7%)....
  • 98.
    ECO SURVEY DATA •Sugar Factories- Of the total sugar factories in the country, 33 per cent are located in the State followed by 22 per cent in Uttar Pradesh. As on 31st March, 2015, out of the total sugar production in the country, the share of State was 37 per cent followed by 25 per cent of Uttar Pradesh. • Dairy sector- At the end of March, 2015, there were 24,762 co-operative dairy societies and 88 co-operative dairy unions in the State. About 43 per cent co- operative dairy societies and about 51 per cent dairy unions were in loss. • Co-operative marketing societies have a three-tier organisational structure. The Maharashtra State Co-operative Marketing Federation Ltd. is the apex body. The District Co-operative Marketing Societies and the Primary Co-operative Marketing Societies are functioning at district and village level respectively. About 36 per cent co-operative marketing societies were in loss at the end of March, 2015 as compared to 39 per cent at the end of March, 2014 . • Non-agri credit societies- As on 31st March, 2015, there were 517 urban co- operative banks, 14,577 urban co-operative credit societies and 7,232 salary earners’ co-operative credit societies in the State. About 22 per cent of the total non-agricultural credit societies were in loss. • Out of the 1,583 total urban co-operative banks in the country, 32 per cent are located in the State. As on 31st March, 2015, in all 109 banks in the State are under liquidation. The Deposit Insurance Credit Guarantee Corporation has approved reimbursement of deposits up to one lakh (in insured banks) and the disbursement for 102 banks is in process, one bank has made appeal to GoI and the process for submitting claims of remaining banks is in progress.
  • 99.
    • ,: ,. , , , , , . . , MNC , ,, . . , , , . .
  • 100.
    Timeline • During theBritish rule , Nicholson a British Officer in India suggested to introduce Raiffersen model of German agricultural credit Cooperatives in India. As a follow-up of that recommendation, the first Cooperative Society Act of 1904 was enacted to enable formation of "agricultural credit cooperatives" in villages in India under Government sponsorship. With the enactment of 1904 Act, Cooperatives were to get a direct legal identity as every agricultural Cooperative was to be registered under that Act only. The 1904 Cooperative Societies Act, was repealed by 1912 Cooperative Societies Act which provided formation of Cooperative societies other than credit. Under 1919 Administrative Reforms act , Cooperatives was made a provincial subject making each province responsible for Cooperative development. In 1942, the British Government enacted the Multi-Unit Cooperative Societies Act, 1942 with an object to cover societies whose operations are extended to more than one state. The impulses of the Indian freedom movement gave birth to many initiatives and institutions in the post independence era in India and armed with an experience of 42 years in the working of Multi Unit Cooperative Societies and the Multi-Unit Cooperative Societies Act, 1942, the Central Government enacted a comprehensive Act known as Multi State Cooperative Societies Act,1984,repealing the Act of 1942.
  • 101.
    Timeline • The Co-operativeSocieties Act, which was passed in 1904 envisaged the formation of village credit societies. In 1912, the Act was amended to enable formation of other types of societies for activities relating to sale, purchase, production, housing etc. This Act also provided for the creation of federations of primary societies and for supervision, audit, mutual control and overall development of the co-operative movement. In 1919, the subject of co-operation was transferred to the provinces and most of the provinces enacted their own laws to regulate the working of co- operative societies. To give a stimulus to the co- operative movement, the Government of India set up an Agricultural Credit Department in the Reserve Bank of India with a view to providing financial assistance and credit to the co-operatives.
  • 102.
    Problems of sugarindustries• PROBLEMS OF SUGAR INDUSTRY IN MAHARASHTRA • In India sugar industry is a second largest agro-based industry with over 600 operating sugar mills across India, about 50 million sugarcane farmers and a large number of agricultural labourers are involved in sugarcane cultivation and ancillary activities. Maharashtra state is the one of the biggest sugarcane production state in India. Sugar industry play the main role to development in Maharashtra. The sugar industry in Maharashtra is most popular in co-operative sector. The Maharashtra sugar industry has been contributing 37% of India's total sugar production. And sugar industry plays an important role in the national as well as state economy • The Sugar industry in Maharashtra is the perfect example of a sweet dream turned sour. It have been the backbone of Maharashtra agriculture sector. Of the total sugar factories in the country, 33 per cent are located in the State followed by 22 per cent in Uttar Pradesh. As on 31st March, 2015, out of the total sugar production in the country, the share of State was 37 per cent followed by 25 per cent of Uttar Pradesh . • Investment- 10% shares of cooperative society members; 25% GoM; 65% Financial support from financial agencies/market. • Multitudinal effects of sector and imp personalities related to it- Vikhe Patil, Vasantrao Patil, YB Chavan, Sharad Pawar,etc • Sugar factories have become livelihood of 2.5 crore population in the state. This cooperative sugar industry provides employment to 1.65 lakh people directly. Almost 8 lakh people are engaged in the harvesting and transportation of sugarcane to factories from the fields. The sugar industry provide annual revenue of over 2200 crores the government Due to the cooperative sugar industry allied business like milk cooperatives, fertilizer supply, irrigation systems have flourished. All this together have led to development of rural places form where the sugarcane is drawn to factories in form of improved road network, transportation facilities, medical facilities, Education facilities, Banking etc.
  • 103.
    Problems of sugarindustries• Problems: Sick Sugar industries- Shivajirao Patil Committee to review; 27 Sick Sugar Cooperative industries •  Cropping pattern management and cane cultivation •  Increasing cost of Sugar production •  Low recovery rate •  Price determination of cane •  Fall in the price of sugar •  Lack of Technical efficiency •  Mismanagement •  Government policies •  Challenges of private industry •  Lack of By-products •  Sugar Cane Cutter Migrants • SUGGESTIONS •  Support price of sugarcane should be fixed so as to stabilize sugarcane production. •  Another area of consideration is greater corporatisation of the industry. •  To compensate for the losses incurred by growers the sugar factories. •  Lack of optimum utilization of by-products needs attention because it would not only help in reduction of cost of production but also improve the economic status of the sugarcane growers. •  The co-operative sugar factories should give more attention on the professional management, new techniques in administration, to produce the by-products, cogeneration projects, increase efficiency of workers, control on corruption, increase market competitiveness, away from politics, instant decision making etc.
  • 104.
  • 106.
    ECONOMIC REFORMS • Meaning-Minimizing role of State & increasing role of pvt sec • Background- Scepticism amongst Developing countries against foreign investments as they feared their dominance & rule of colonisers • Components: 1. Macroeconomic stabilization measures(Boost aggregate demand of economy either domestic or external, domestic by incresing purchasing power of masses by gainful &quality empl opportunities) 2.Structural Reform measures (Boost aggregate supply of goods & services , mostly by capitalists) • LPG : Liberalization shows Direction of Reforms; Privatization shows path of Reforms & Globalization shows the Ultimate goal of Reforms.
  • 107.
    ECONOMIC REFORMS • Liberalization-Pro-capitalistic or Pro- market inclination of an economy; decreasing traits of a state economy; liberalising from shackles of restrictions/regulations of a state economy(Tax reforms,Fiscal reforms,Expenditure reforms,Banking reforms) • Privatization- - Denatiolization- Tfr of State ownership of assets to pvt sector to the tune of 100% -Disinvestment- Denatiolization of state owned enterprises of less than 100% ownership to pvt sector - All the economic policies of State which directly or indirectly promote expansion of role of pvt sector or mkt(deregulation, reducing subsidies,permission to FDI) • Globalization- Increase in economic integration among nations -Unrestricted cross border movement of goods,services, capital or labour force is Globalization(WTO)
  • 108.
    ECONOMIC REFORMS • FIRSTGENERATION REFORMS(1991-2000)- Promotion to pvt sector; Ext sector Reforms like FDI,abolishing QR on imports; Public Sector Reforms to make PSU efficient,profitable,disinvestment; Financial Secor Reforms like Insurance, Banking; Tax Reforms to avoid tax evasion,simplify, broadbase tax. • SECOND GENERATION REFORMS(2001 Onwards)- Factor Mkt Reforms where dismantling Administered Price MechanismPromotion (Remaining Urea, K oil, LPG), Public Sector Reforms for greater autonomy to PSU,disinvestment; Adm Reforms where State from Controller to Facillitator; Legal Sector Reforms like Labour laws, Company laws; Critical Areas Reforms in Health care,education, agri like R & D in agri,corporate farming.
  • 109.
    ECONOMIC REFORMS • THIRDGENERATION REFORMS- PRI so that development reaches grass root level; Factor of Inclusiveness • FOURTH GENERATION REFORMS- IT- enabled reforms - Reforms is a simultaneous and continuos process and is a mean to an end.
  • 110.
    IMPACT OF LIBERALIZATION •Sectoral composition change • GDP Growth Rate • Agri sector • Industrial sector & SSIs • Services sector • Telecom sector • Economic inequality • Unemployment
  • 111.
    • IMPACT OFLIBERALIZATION- • Composition – Services – Steady significant Increase (w as more marked after reforms), Industry Less marked increase (stagnated after reforms) , Agriculture Significant Decline
  • 112.
    IMPACT OF LIBERALIZATION•GDP growth rate –  India’s annual average growth rate from 1990 to2010 has been 6.6 % which is almost double than pre reforms . GDP growth rate surpassed 5% mark in early 1980’s. This made impact of 1990’s reforms on growth uncle ar.      Some,believe that 1980’s reforms were precursor to LPG reforms. Other things apart, it is clear that 1980 ref orms led to crash of economy in 1991, which was,remedied by LPG reforms which were quite more compreh ensive. It was IMF loan which gave government to adjust its economy. It was largest ever loangiven by IMF . Initially there were global doubts on India’s credibility for loan, but India has been so far a disciplined borrow er.  • Industrial Growth Rate ..Barring few years industrial growth rate has been not much impressive. Share of    Industry still remains stagnantly low at 25%.Worst is that India has transitioned to be a service led econo my, directly from an agrarian one. One explanation of this is end of policy of imports substitution  which derived industrial growth upto 1990. Foreign companies got free access to Indian markets and ma de domestic products uncompetitive. They,obviously had better access to tech & larger economies of scal e.India position also lagged on account of Research and innovation. Import substitution required certain degr ee of investment and efforts in domestic,production. It was carried out even when imports were cheaper. This  resulted in  good and better capacity building upto that time. This was coupled with  constant technology denial by west, which further pushed government to spend on R&D. Technology Denial         ended with liberalization and globalization. Till,that time Indian Industry was better and modern than that of         China. But in two decades China has surpassed India by huge margin in case of both  Industry and innovation
  • 113.
    Impact on Small Scale in India - • This impact shall be studied right from the beginning of colonization in 18th   century. Colonization can be considered as 1st   wave of globalization. In precolonization era, India’s textiles and handicraft was renowned worldwide and wa s backbone of Indian economy. With coming of industrial revolution with foreign rule in India, Indian economy  suffered a major setback and much of its indigenous small scale cottage Industry was destroyed.   After independence, government attempted to revive small scale sector by reserving items exclusively for it t o manufacture. With      LPG,reserved items was substantially curtailed and many new sectors were thrown open to big playe r •Small scale industry however exists and still remains backbone of Indian Economy. It contributes to major po rtion of exports and private    sector,employment. Results are mixed, many erstwhile Small scale industries got bigger and better. But over all value addition, product i  Innovation and tech,adoption remains dismal and they exist only on back of government support. Their produ cts are contested by cheaper        imports from China.  • Impact on Agriculture- • Share of agriculture in domestic economy has declined to about 17%. However, people dependent upon  agriculture are still around 48%.Cropping patterns has undergone a huge change, but impact of liberalizati on can’t be properly assessed. There are still all pervasive government controls and interventions starting fro m production to distribution.  • Global agricultural economy is highly distorted. This is mainly because imbalance in economic and p olitical power in hands of farmers of developed and,developing countries. In developed countries, co mmercial and capitalistic agriculture is in place which is owned by influential Agri corporations. They         influence policies of WTO and extract a better deal  at cost of farmers of developing,world.  • Farming in developing world is subsistence and supports large number of poor people. With globalizat ion there has been high fluctuation in commodity,prices which put them in massive risk. This is particularly tru e for cash crops like Cotton and Sugarcane. Recent crises in both crops indicate towards this conclusively.  • GM crops • On the positive note, India’s largely self­ sufficient and high value distinguished products like Basmati Rice are in high demand all over. Generally spe aking,India is better placed to take up challenge of globalization in this case. If done in sustainable and inclus ive manner, it will have a huge multiplier impact on,whole economy. Worldwide implicit compulsion to develop  Food processing Industry is another landmark effect of  LPG .
  • 114.
    • Impact onServices Sector • In this case globalization has been boon for developing countries and bane for developed ones. Due to historic econo mic disparity between two groups, human resources have been much cheaper in developing economies. This was further facilitated by IT revolution an d this all culminated in exodus of numerous jobs from developed countries to developing countries. Here US have to jealously guard its jobs as we guard our agriculture. • IT industry • Software, BPO, KPO, LPO industry boom in India has helped India to absorb a big chunk of demographic dividend, whic h otherwise could have wasted.Best part is that export of services result in export of high value. There is almost no mat erial exported which consume some natural resource. Only thing,exported is labor of Professionals, which doesn’t depl ete, instead grows with time. Now India is better placed to become a truly Knowledge Economy. • Exports of these services constitute big part of India’s foreign Exchange earnings. In fact, the only three years India ha d Current Account surplus, I.e. 2000-2002, was on back of this export only. • Banking • Further, in banking too India has been a gainer. Since reforms, there have been three rounds of License Grants for priv ate banks. Private Banks such as,ICICI, HDFC, Yes Bank and also foreign banks, raised standards of Indian Banking Industry. Now there is cut through competition in the banking industry,and public sector banks are more responsive to customers. • Education and Health Sector • It should be noted that food (Agriculture), Health and education are among basic necessities, which every human being deserves and can’t do without. Unfortunately, in developing countries there is market failure in all these sectors and m ajority of people can’t afford beyond,a certain limit (or can’t afford at all). Concept of free markets, globalization, liber alization etc. fails here miserably. Free markets provide goods &services to people who can afford paying for them, not to those who deserve and need these. • Now if we consider these sectors from angle of our inclination towards free markets, certainly there has been lot of pr ogress. There has been world class,education available in India and Deregulation has resulted in Mushrooming of pri vate engineering and Medical Colleges. But in reality, this had far,reaching devastating effect on society. These new colleges accommodate only a miniscule proportion of aspirants at very high costs. • Economic inequalities • Deindustrialisation & unemployment
  • 115.
      DISINVESTMENT  Concept of Maharatnas (5) , Navratnas (15), Miniratnas (61)  Disinvestment Timeline in India Disinvestment: When Government sells its shares of a PSU, to private sector company / individual. Privatization: when Government sells so many shares, that it no longer remains the majority shareholder of the given  PSU. 1991­Interim budget, Government announced 20% disinvestment in selected PSUs. Their shares were sold to Mutual funds and financial institutions (UTI, EPFO, LIC etc.)­1992 1993-Rangarajan Committee suggests:­49% disinvestment in PSUs reserved for public sector;74% disinvestment in all  other PSUs Government did not implement. 1996-Disinvestment commission under GV Ramakrishna. It was a non­statutory, advisory body. 1998­2000­­Vajpayee Government classifies PSUs into two parts Strategic: arms­ammunition, railway, nuke energy – NO disinvestment Non-strategic: Disinvestment in a phased manner. Hindustan Zinc, BALCO, Maruti To implement above policy, Department of disinvestment set up under Finance ministry.  2004­UPA comes into power, Common Minimum program (CMP) updates disinvestment policy Sick PSUs will be revived;No disinvestment in profit making PSUs;PSUs will get commercial autonomy 2005­Whatever Money Government earns from selling its PSU shares­ it’ll go to National investment fund (NIF).  2005­09­Disinvestment remains stagnant because Left allies of the UPA Government stonewall everything. 2009 onwards­UPA­2 without left parties. Government resumes disinvestment process. All PSUs can be disinvested, but upper limit: 49% 2013­14­­Plan for 40,000 crores via disinvestment of Indian Oil, BHEL, NHPC, Neyveli lignite etc. but hardly managed to  get ~16,000 because­­Oil ministry, mining ministry, trade unions opposed the move, files were delayed; Lukewarm  response from investors because sharemarket was down due to internal & external factors. 2014­Modi cabinet approves disinvestment in NHPC, Coal India, ONGC.
  • 116.
         Modi PSU-reform1: Disinvesting NHPC, Coal India, ONGC Issues- NHPC­Has 20 hydroelectric power stations.;Unable to recover dues from electricity utility  companies= company making huge losses. Hence it share price won’t fetch truckload of cash to Government. Coal India Ltd­Labour union strike may bring down share price.  ONGC­Maharatna PSU­If Government clears the gas price policy, ONGC’s share prices will go up  (And after that Government should sell it­ Modi PSU-reform2: Revive 5 and shut down 6 Hindustan Photo Films HMT Bearings HMT Watches HMT Chinar Watches Hindustan Cables. Tungabhadra Steel Products Ltd HMT Machine Tools Heavy Engineering Corporation NEPA Nagaland Paper & Pulp Co Triveni Structurals
  • 117.
        Disinvestment: arguments in favour and against 1.Socialist / leftist ideology­ Limitation of pvt sector in fulfilling social commitments Private enterprises only focus on profit maximization. They won’t cater  for poor people. Therefore Government needs to control all or some industrial sectors.             vs Such Govt controlled units can’t compete in free market economy due to political interference and price control mechanisms.Ultimately more public money is wasted in running these loss making entities. 2. Dividend Income­Government’s dividend income will decline. (Because they’ll have less shares). Consequently, Fiscal deficit will increase.     Vs “dividend” Government earned so far vis a vis Government has spent more for their revival. 3. Financial Inclusion-  It’ll not help in “financial inclusion”  as  only 0.5% retail participation in equity  market i.e. only Large corporates and financial institutions benefit from this drive    vs Absurd logic, that just because corporates will benefit, we shouldn’t begin disinvestment. Government already taken plenty of initiatives on financial inclusion front. 4. Jobs loss- After disinvestment employees of PSUs will loss their jobs.    vs private sector experts in Board of Directors, plans to reduce staff strength, to increase profitability. Overstaffing = One of the main reasons why PSUs don’t make optimum profit. Firm action needed. Besides, such employees are given attractive VRS offers. 5. Monopoly of pvt- Disinvestment would lead to private monopolies     vs Unlikely to happen in today’s world. CCI is always watching and punishing the firms that try to create  monopoly or oligopoly.
  • 118.
        6. Less valuation- Allegations  that PSEs are sold cheap to preferred parties e.g.  BALCO         vs  Used to happen in 90s, when Govt sold shares to specific pvt companies at an arbitrary  price. But, Unlikely to happen if shares directly sold via stock exchange. + CAG, Media very  active now 7. Changing ownership amongst Govt org-To complete the disinvestment targets,  Government asks one PSU to buy shares of another PSU. e.g. ordering LIC to buy ONGC’s shares……. In such cases, disinvestment doesn’t  decrease Govt control over those companies. Need for a clear policy on disinvestment to stop this practice. Speed of Disinvestment- International experiences- Rapid speed 1993: Czech Republic disinvested ~1000 state owned enterprises.;  Russia did same. Results were disappointing in both the cases. Hence rapid approach=  not recommended for India Slow speed China­ after more “Open Door Policy” in 1978. But speed too slow­ thousands of enterprises still under Government ownership. Middle speed-  Most suitable for India  
  • 119.
    CURRENT AFFAIRSDIPAM-DEPARTMENT OFINVESTMENT AND PUBLIC ASSET MANAGEMENT  In order to revive strategic stake sale of PSUs, the Department of Disinvestment, has been renamed as the Department of Investment and Public Asset Management (DIPAM).  Department of Disinvestment was carved out of the Finance Ministry in 1999. New Responsibilities  The government has also redefined the responsibilities to include efficient management of the government investment in CPSEs through capital restructuring, dividend, bonus shares and monetization of idle assets.  Public asset management would also include buyback of shares. Objectives of disinvestment  To reduce the financial burden on the Government.  To improve public finances.  To introduce, competition and market discipline.  To fund growth.  To encourage wider share of ownership.  To depoliticize non-essential services. Targets  The government aims to collect Rs 56,500 crore through disinvestment in PSUs in the next fiscal, 2016-17.  Of the total budgeted proceeds, Rs 36,000 crore is estimated to come from minority stake sale in PSUs.  The remaining Rs 20,500 crore is projected to come from strategic sale in both profit and loss-making companies. What is Strategic Sale? According to Department of Disinvestment, In the strategic sale of a company, the transaction has two elements:  Transfer of a block of shares to a Strategic Partner and  Transfer of management control to the Strategic Partner CPSE-   ONGC Ltd, Coal India Ltd, NTPC Ltd, the National Mineral Development Corporation (NMDC) Ltd and Power  Finance Corporation Ltd were top 5 profIt-making CPSEs  during 2014­15, whereas Bharat Sanchar Nigam Ltd,  Air India Ltd, Mahanagar Telephone Nigam Ltd, Hindustan Photo Films Manufacturing Company Ltd &Mangalore  Refinery and Petrochemicals Ltd were  top 5 loss-making CPSEs.  CPSEs contribute  to the central exchequer  by way of dividend  payment, interest on government loans and  payment of taxes and duties. Their contribution to the central exchequer decreased.
  • 120.
    INDIA- INTERNATIONAL TRADE India’s share in International trade: 1950 (1.78%)– 1955 (0.6%)-- 2005 (1%) – 2008 (1.64%)---2020 (3.28%)  Based on composition of international trade, country’s economic status as developed or developing .  Composition: Import- 1. Food group- 1960 (2.1%) to 2010 (2.9%, out of which 1.8% is of edible oil) 2. POL – 1960 (6.1%) to 1980 (41.9%) to 2010 (28.6%). 3. Steel – 1960 (11%) to 2010 (2.9%) 4. Metalloids like Gold,Silver,etc- Through Govt agency, 2001 (9.3%) to 2010 (11.5%) 5. Capital goods- 1960 (31.7%) to 2010 (13.1%, max of n.c.e. 6.4%) 6. Gems & Jewelleries- 1960 (0.1%) to 2010 (9.4%) Export- 1. Agri & allied prod- 1960 (44.2%, initially jute max 21%) to 2010 (9.9%) 2. Engg goods – 1960 (3.4%) to 2010 (23.8%). 3. POL – 1960 (1.1%) to 2010 (16.8%); Reasons- price & refining capability 4. Chemicals- 1960 (1.1%) to 2010 (11.4%) 5. Gems & Jewelleries- 1960 (0.1%) to 2000 (16.6%) to 2010 (14.7%) India’s exports shifted from traditional goods like tea, rice, spices, tobacco, jute to chemicals, Engg goods,gems, jewelleries,etc (non traditional/manufactured goods).
  • 121.
    INDIA- INTERNATIONAL TRADE Indiais becoming increasingly integrated with the global economy. India’s total merchandise trade as a percentage of GDP increased from 29.5 per cent in 2004-05 to 40.2 per cent in 2014-15 and merchandise exports increased from 12.6 per cent in 2004-05 to 16.4 per cent in 2014-15. Here although growth is driven by domestic demand, contribution of exports to economic growth is important as exports of goods and services account for about one fourth of the GDP. Increase in exports along with focus on manufacturing and industrial development, results in a multiplier effect bringing about increase in income, as well as, employment generation.- As per the disaggregated data on exports of principal commodities during 2014-15, the top five commodities of export include petroleum (crude and products), gems and jewellery, textiles and allied products, chemicals and related products and agri and allied products. On the other hand, top five import items constitute petroleum (crude and products), gems and jewellery, chemicals and related products, electronic items and machinery.-Several factors contributed to the sluggishness of trade and output in 2014 and at the start of 2015, including slowing GDP growth in emerging economies, an uneven recovery in developed countries, and rising geopolitical tensions, among others. As per the current rankings for 2014, India was the 19th largest exporter (with a share of 1.7 percent) and 12th largest importer (with a share of 2.4 per cent) of merchandise trade in the world.China is the top ranked exporter and United States of America (USA) is the top importer of merchandise trade in the world. In Commercial Services Exports, India is 8th largest exporter in 2014 (with a share of 3.20 per cent). In imports of commercial services India ranks 10th (with a share of 2.6 per cent). USA is the top exporter as well as the top importer of commercial services trade in the world.
  • 124.
    The sixth TradePolicy Review (TPR) of India by the WTO was held in Geneva on 2 and 4 June 2015, as a part of the WTO’s Trade Policy Review Mechanism that aims at achieving greater transparency in and understanding of the trade policies and practices of WTO members. India’s trade policy review takes place once every 4 years, as determined in terms of its share in world trade. The last TPR of India was held in September 2011.
  • 125.
    Key Findings (2003-2013)- Exports - India’s exports recorded growth of 21.3% (CAGR) during the period FY03-FY13, and stood at USD 300.2 billion in FY13. o Manufactured goods account for major share of exports (61.2% as of FY13), followed by petroleum and crude products (20.1% in FY13) and agri-products (13.5% in FY13). o Contribution of petroleum and crude products in India’s export basket has risen over the years, while that of manufactured goods has declined. Other commodity groups have registered range-bound changes in share. o Asia has always dominated as India’s exports-partner over the years; followed by Europe, America and Africa. However, exports to America and Africa have declined from FY03 to FY13 and increased with Asia instead.  Imports - The country’s imports, on the other hand, grew by 26.0% (CAGR) during the same period, FY03-FY13. Value of imports in FY13 stood at USD 490.3 billion. o Imports may be classified as POL items (petroleum, oil and lubricants) and non-POL items. As of FY13, POL items accounted for 34.5% of imports of the country and non-POL items accounted for the rest of 65.5%. o Within non-POL items, capital products and chemicals (and chemical related) products have been important. o Import sourcing appears to follow the same country composition as exports. India imports the most from Asia, followed by Europe and America. Imports from both Asia and America to India have increased, however from Europe has declined in FY13 (when compared with FY03).
  • 126.
    Direction of Exports India’slargest export partner has been Asia. Exports to Asia have grown by more than 23.0% (CAGR), from USD 22.2 billion in FY03 to USD 150.4 billion in FY13. The next largest export destination is Europe (USD 58.8 billion in FY13), followed by America (USD 53.4 billion);
  • 127.
  • 132.
    Conclusions Trade flows forIndia have grown at a robust pace during the past decade (FY03 to FY13). In general, India has expanded its commodity basket of trade from primary agri-products to manufactured goods and petro-related products; with Asia emerging as the largest trade partner in recent years.  Exports have registered shift in commodity compositions, with share of manufacturing goods coming down to give way to export of petroleum and crude products. In a way this does reflect India’s strength in refining capability. In terms of export-destination, Asia has been and continues to be a major partner through the years. This has helped to diversify our exports basket and buffered to an extent the impact of any slowdown in the western world.  Imports on the other hand, have registered shifts in country-sources as well as commodity basket. While POL share has increased, within non-POL category, there has been an increase in import of gold, coal and ores in recent times. From a geographically-dispersed country-source profile, imports sources are now concentrated in the Asia region itself. Partly, this is due to the higher import of POL products and also the emergence of China as a major trading partner. These shifts in India’s trade profile may be attributed to intrinsic and extraneous factors, namely  Trade Policy – as a conscious change in trade policy, India has moved to effective trade through reduction in transportation costs, diversifying commodity basket and boosting regional trade, by the EXIM policies over the years to facilitate the growth of exports. It has ensured some ring fencing against external vulnerabilities & shocks from advanced economies.  Global dynamics – advanced economies have in the last few years registered slowdown in economic activity. This has caused production activity in advanced economies to moderate (which impacts exports to India i.e. India’s imports) coupled with a contraction in demand for imported goods from advanced countries (i.e. India’s exports). Trade flows to these regions have hence, been affected, giving way to increased inter-regional trade. Trade with Europe however, appears to be impacted more adversely when compared with India’s trade with America.
  • 133.
  • 134.
  • 135.
  • 136.
  • 137.
  • 138.
  • 142.
    International Financing institutes(IMF,WB,ADB,UNCTAD) IMF•Background- 1930s Depression • Bretton Woods Twins-The representatives of the USA, the UK and 42 other (total 44 countries) nations met at Bretton Woods, New Hampshire, USA in July 1944 to decide a new international monetary system (IMS). The International Monetary Fund (IMF) and the World Bank (with its first group-institution IBRD) were set up together—popularly called as the Bretton Woods’ twins—both having their headquarters in Washington, DC, USA. • The International Monetary Fund (IMF) came up in 1944 whose Articles of Agreement were signed by 29 countries on the December 27, 1945 with the main functions as exchange rate regulation, purchasing short-term foreign currency liabilities of the member nations from around the world, allotting special drawing rights (SDRs) to the member nations and the most important one as the bailor to the member economies in situation of any BoP crisis ( by giving short term loans) • France is First country to get loans from IMF. • Presently, total no of members in IMF- 188. • The Board of Governors of the IMF consists of one Governor and one Alternate Governor from each member country. For India, Finance Minister is the Ex-officio Governor while the RBI Governor is the Alternate Governor on the Board. The day- to-day management of the IMF is carried out by the Managing Director who is Chairman(currently, Ms Christine Lagarde) of the Board of Executive Directors. • Quota- Quota means member country’s share of capital investment in IMF, based on which voting rights are decided. • Concept of Reserve Tranche & EFF
  • 143.
    WB • The WorldBank (WB) Group today consists of five closely associated institutions propitiating in the role of development in the member nations in different areas. • 1. IBRD(1945) International Bank for Reconstruction and Development is the oldest of the World Bank institutions which started functioning (1945) in the area of reconstruction of the war-ravaged regions (WW II) and later for the development of the middle-income and creditworthy poorer economies of the world. • 2. IDA(1960) • The International Development Agency (IDA) which is also known as the soft window of the WB was set up in 1960 with the basic aim of developing infrastructural support among the member nations, long- term lending for the development of economic services especially in poor countries. • 3. IFC(1956) • The International Finance Corporation (IFC) was set up in 1956 which is also known as the private arm of the WB. It lends money to the private sector companies of its member nations. • 4. MIGA(1988) Multilateral Investment Guarantee Agency (MIGA), encourages foreign investment in developing economies by offering insurance (guarantees) to foreign private investors against loss caused by non- commercial (i.e. political) risks, like currency transfer, expropriation, war &civil disturbance. • 5. ICSID(1966) • The International Centre for Settlement of Investment Disputes (ICSID), set up in 1966 is an investment dispute settlement body whose decisions are binding on the parties. • India is not its member (that is why the Enron issue was out of its preview). • India is largest loanee from IDA & IBRD for devlt & infra devlt.
  • 144.
    IMF Vs WorldBank Difference in functions Function of IMF and World Bank in the context of the world economy. International monetary Fund IMF gives short-term loans to its members, and helps in recovering from BoP crisis (balance of payment crisis).In simplest terms, BoP crisis means you don’t have enough money/ foreign currency to pay for your imports. So in that case you run to IMF. →Then IMF gives loans, they’ll ask you to change your policies accordingly. eg. they’ll ask you to 1. let the MNCs enter your market, 2. reduce the jobs or shutting down the loss making Public sector units etc. 3. stop giving subsidies to particular section (petrol/fertilizer etc.) and so on… IMF gives loans, it expects you to pay full amount back + interest rate. In IMF there is a thing called Quota i.e. Every member has to give some money to IMF, (IMF will give it to loan as other members). The rich nations with bigger Quota has more voting rights (USA).So rich nations can effectively decide how IMF should function. World Bank In short, They give soft loans to poor nations for Development purpose and various health education,poverty removal programs. Soft loan= minimal interest rates, the EMIs have longer time brackets in between, and they don’t expect your to pay back the principle. They facilitate private players to setup business in poor nations. (via insurance and loans)
  • 149.
    WTO & AGRICULTURE It required member countries to report their total AMS for the period between 1986 and 1988, bind it, and reduce it according to an agreed upon schedule. Developed countries agreed to reduce these figures by 20% over six years starting in 1995. Developing countries agreed to make 13% cuts over 10 years. Least – developed countries do not need to make any cuts.  As we can note that Subsidies were bind to levels of 1986- 1988, there was inequality at very beginning of the agreement. At that time subsidies which latter came under ‘Amber Box’ were historically high in western countries. In developing countries, including India these subsidies were very limited. It is only now under pressure of Inflation in prices of agricultural Inputs, and wide differences between market prices and Minimum support Price, subsidies have grown to this level. In effect developed countries are allowed to maintain substantially higher amount of trade distorting subsidies.
  • 150.
    Blue Box- Thisis the amber box with conditions.The conditions are designed to reduce distortion subsidy that would normally be in the amber box & is placed in the blue box if it requires farmer or ascertain production level.These subsidies are nothing but certain direct payments Made to farmers by the government in the form of assistance program to encourage agriculture, rural development,etc.At present there are no limits on spending on the blue box subsidies.In the current negotiation, countries want to keep blue box as it is because they see it as a crucial means of moving away distorting the amber box subsidies without causing too much hardship.
  • 151.
    WTO & AGRICULTURE •De-Minimis provision  Developed countries are allowed to maintain trade distorting subsidies or ‘Amber box’ subsidies to level of 5% of total value of agricultural output & for developing countries upto 10%.  So far India’s subsidies are below this limit, but it is growing consistently. This is because MSP are always revised upward whereas Market Prices have fluctuating trends.  Market Access: The market access requires that tariffs fixed (like custom duties) by individual countries be cut progressively to allow free trade. It also required countries to remove non-tariff barriers and convert them to Tariff duties. • India has agreed to this agreement and substantially reduced tariffs. Only goods which are exempted by the agreement are kept under control.
  • 152.
    WTO & AGRICULTURE Export Subsidy: These can be in form of subsidy on inputs of agriculture, making export cheaper or can be other incentives for exports such as import duty remission etc. These can result in dumping of highly subsidized (and cheap) products in other country. This can damage domestic agriculture sector of other country.  These subsidies are also aligned to 1986-1990 levels.But USA is dodging this provision by its Export credit guarantee program. In this, USA Govt gives subsidized credit to purchaser of US agricultural products, which are to be paid back in long periods. e.g. Food Aid programs, such as (Public Law-480) under which food aid is send massively to under developed countries.It results in perpetual dependence on foreign grain in recipient countries and destroys their domestic agriculture. So this is equally trade distorting subsidy, which is not currently under ambit of WTO’s AOA.
  • 153.
    WTO & AGRICULTURE Special Safeguard Mechanism  A Special Safeguard Mechanism (SSM) would allow developing countries to impose additional (temporary) safeguard duties in the event of an abnormal surge in imports or the entry of unusually cheap imports.  Debates have arisen around this question, some negotiating parties claiming that SSM could be repeatedly and excessively invoked, distorting trade. In turn, the G33 bloc of developing countries, a major SSM proponent, has argued that breaches of bound tariffs should not be ruled out if the SSM is to be an effective. remedy. SSM is quite important in a scenario in which West has significant powers to subsidize their production and in turn, exports.
  • 154.
    WTO & AGRICULTURE •Bali Summit 2013-  LDC- DFQF mkt access  Peace clause (upto 2017, later on permanent without time limit)  Trade facilitation • The Bali Package(2013) had 10 agreements, which can be clubbed under three heads : TFA, Agriculture (Food Security) and Least Developed Nations (LDC). While developed nations’ primary attention was on TFA, India’s concern was regarding moving ahead without finding a permanent solution to the food security issue. India has been insisting that it would not agree to the TFA unless the entire Bali package, which includes allowing developing countries to buy food from farmers for food security needs, is simultaneously firmed up. No Permanent solution to the issue of public stockpiling for food security; but only a peace clause under Bali agreement New Delhi has been seeking a permanent solution to the issue of public stockpiling for food security because under the current rules, subsidies are capped at 10% of value of total production based on 1986-88 prices. India is close to breaching this on account of high inflation over the past few years. India wants inflation to be taken into account when calculating subsidy limits. The country buys rice and wheat from farmers at minimum support prices (MSP) to provide a reasonable income to producers. The stockpile is used to provide heavily subsidised food to the poor. • Peace Clause under Bali agreement- Peace clause’ available to India under the Bali agreement that says no member can take action against another on the food subsidy issue till a final agreement is reached on the issue, the deadline for which is the 11th ministerial in 2017.
  • 155.
    WTO & AGRICULTURE •Nairobi Summit 2015-  Abolish export subsidies  Public stock holding for food security (on hold)  Spl Safeguard mech (SSM) for developing countries (on hold)  DDA- (no firm commitment) Bargaining tool by India- Trade facilitation.
  • 156.
    • What didIndia Gain from WTO? • 1. India got boom in exports because WTO gradually lowered Barriers internationally. • 2. Our export was only $33.22 billion in 1998-99, right now India’s exports are worth more than $100 billion • 3. India won multilateral dispute settlement against such powerful economies as USA • 4. Due to TRIPS, India had to adopt international standards in Intellectual property rights. • 5. flow of Foreign investment & technology. (because Foreigners established research labs/ manufacturing units in India & started selling their products here.) • 6. Textiles boom (because MFA = Multilateral Fiber Agreement was scrapped under WTO’s Agreement on Texttile clothings.) otherwise previously UK and other nations had put quantitative limits on Indian Cotton’s Entry in their market. • Criticism of WTO • Mostly comes from environment activities. • 1. WTO promotes industries, MNC (Multi-national corporations) • a. But these MNCs sometimes are involved in bad things. Eg. They pay huge bribes to Burma’s military regime for operating the gas lines, nickel mines etc. And employ forced laborers in it. • 2. The infrastructure boom because of WTO (more foreign companies making factories in India) – leads to habitat / bio-diversity loss & pollution etc. • 3. Its hard to put barriers on imported items, thus the domestic industries face tough competition which sometimes ruins them. (e.g. its not possible for Indian Toy maker to compete with Chinese toys in retail price.) and yet not much the Indian Govt. can do. If they put some ban on it, then China will go to WTO, and WTO will impose heavy fines on India. • 4. 3rd world has to open its market for first world product without much benefit in the reverse process. (=3rd world’s products lag in race in 1st world’s market.) • 5. e.g. as you know in colonial era, when India was under British Rule, if we exported ourIndian Textiles to Britain, they’d put huge import tax on it. Thus our cloths would become very expensive in their market. So Britishers would only buy locally made cloths from Manchester. This sort of ‘protectionism’ in old times (almost upto 1995) = their companies made lot of profit during that era & had lot profit invested in Research and technology, so currently their products will be technically and in quality far superior than ours. So even if there is no barrier today, British people will buy their product and not ours. This argument runs on the same line like of climate change. America allowed its factories to pollute the atmosphere and thus became a developed nation but now, it wants the developing nations to stop polluting the world & cut their emissions.
  • 157.
    CURRENT AFFAIRS Afghanistan’s WTOmembership approved after 11 years of talks - The World Trade Organisation (WTO) has formally approved Afghanistan’s membership at its 10th ministerial conference in the Kenyan capital Nairobi. Afghanistan has become the 164th WTO member and the 36th least developed country (LDC) to join the global trade body after 11 years of negotiations. How a new member is admitted? -accession process: 1. A country wishing to accede to the WTO submits an application to the General Council, and has to describe all aspects of its trade and economic policies that have a bearing on WTO agreements. The application is submitted to the WTO in a memorandum which is examined by a working party open to all interested WTO Members. 2. After all necessary background information has been acquired, the working party focuses on issues of discrepancy between the WTO rules and the applicant’s international and domestic trade policies and laws. The working party determines the terms and conditions of entry into the WTO for the applicant nation, and may consider transitional periods to allow countries some leeway in complying with the WTO rules. 3. The final phase of accession involves bilateral negotiations between the applicant nation and other working party members regarding the concessions and commitments on tariff levels and market access for goods and services. The new member’s commitments are to apply equally to all WTO members under normal non-discrimination rules, even though they are negotiated bilaterally. 4. When the bilateral talks conclude, the working party sends to the general council or ministerial conference an accession package, which includes a summary of all the working party meetings, the Protocol of Accession (a draft membership treaty), and lists of the member-to-be’s commitments. 5. Once the general council or ministerial conference approves of the terms of accession, the applicant’s parliament must ratify the Protocol of Accession before it can become a member. The process of becoming a WTO member is unique to each applicant country, and the terms of accession are dependent upon the country’s stage of economic development and current trade regime. The process takes about five years, on average, but it can last longer if the country is less than fully committed to the process or if political issues interfere.
  • 158.
    •  CPSE-    ONGC Ltd, Coal India Ltd, NTPC Ltd, the National Mineral Development Corporation  (NMDC) Ltd and Power Finance Corporation Ltd were top 5 profIt-making CPSEs   during 2014­15, whereas Bharat Sanchar Nigam Ltd, Air India Ltd, Mahanagar  Telephone Nigam Ltd, Hindustan Photo Films Manufacturing Company Ltd  &Mangalore Refinery and Petrochemicals Ltd were  top 5 loss-making CPSEs.  CPSEs contribute  to the central exchequer  by way of dividend  payment,  interest on government loans and payment of taxes and duties. Their contribution to  the central exchequer decreased. •  FDI-    With a view to liberalizing and simplifying the FDI policy to provide ease of doing  business climate in the country that will also lead to larger FDI inflows, the  government has undertaken various reforms. A number of sectors have been  liberalized, including defence, construction, broadcasting, civil aviation,  plantation, trading, private sector banking, satellite establishment and  operation and credit information companies.    During 2015­16, FDI policy in the pension sector has been revised to permit  foreign investment up to 49 per cent, with 26 percent under automatic route.  Manufacturing of medical devices and white label ATM operations have been  opened up to 100 percent FDI under automatic route. •  The various reforms in the FDI sector have led to a significant increase in FDI  inflows into India, showing a 26 per cent surge in 2015.
  • 159.
     The highgrowth in services FDI inflows is mainly due to higher growth of three major categories, namely computer software and hardware; services sector category which itself consists of a basket of items like financial, banking, insurance, non-financial, outsourcing and R&D; and trading. This was in spite of the high negative growth at - 61.6 per cent in FDI equity inflows in telecommunications. WTO Services Negotiations and Bilateral Negotiations including Services Trade in Nairobi • Service trade- Implementation of preferential treatment in favour of services and service suppliers of LDC and increasing LDC participation in services trade; and moratorium on payment of customs duties on electronic transmissions until 2017. • Preferential treatment for LDCs: So far, 21 members, including India, have notifed preferential treatment to LDCs in services trade. India has offered this in respect of: (i) article XVI of the General Agreement on Trade • in Services (GATS) (Market Access); (ii) technical assistance and capacity building; and (iii) waiver of visa fees for LDC applicants applying for Indian business and employment visas. The fee waiver will be valid until 31 December 2030. India is the only member which has offered waiver of visa fees. This is a unique and almost path-breaking offer by India. So far, visa issues have remained untouched in the WTO/free trade agreements (FTA). India’s offer should give signifIcant advantage to service suppliers from LDCs vis-à-vis service suppliers from any other country. • E-commerce: The WTO Members agreed to maintain the current practice of not imposing customs duties on electronic transmissions until the next Ministerial Conference which will be held in 2017. • Bilateral agreements: • India has signed comprehensive bilateral trade agreements, including trade in services, with the governments of Singapore, South Korea, Japan and Malaysia. And also FTA with ASEAN. • India has joined the Regional Comprehensive Economic Partnership (RCEP) plurilateral negotiations. The RCEP is a proposed FTA which includes the 10 ASEAN countries and its six FTA partners, viz. Australia, China, India, Japan, South Korea and New Zealand. The RCEP is the only mega-regional FTA of which India is a part. • India is also engaged in bilateral FTA negotiations including trade in services with Canada, Israel, Thailand, the EU, the European Free Trade Association (EFTA), Australia and New Zealand. Dialogue is under way with the US under the India-US Trade Policy Forum (TPF), with Australia under the India-Australia Joint Ministerial Commission (JMC), with China under the India-China Working-Group on Services, and with Brazil under the India-Brazil Trade Monitoring Mechanism (TMM).
  • 160.
    • FDI • Foreign investment- FDI & FPI • Concept of P-notes •  FDI ROUTES- Automatic & Govt/ FIPB ROUTE • Govt/ FIPB route sectors •  FDI prohibited sectors •  Country wise FDI inflows  2015-16 •  FDI -Pros & Cons
  • 161.
    •  FDI • AUTOMATIC ROUTE : •Under this route no Central Government permission is required. • GOVERNMENT ROUTE :Under this route applications are considered by the Foreign  Investment Promotion Board (FIPB). Approval from Cabinet Committee on Security is required  for more than 49% FDI in defence. The proposals involving investments of more than INR 30  billion are considered by Cabinet committee on economic affairs. • The Indian company receiving FDI either under the automatic route or the government route is  required to comply with provisions of the FDI policy including reporting the FDI and issue of  shares to the Reserve Bank of India.  • SECTORS REQUIRING CENTRAL GOVERNMENT APPROVAL i.e. FIPB Route • Mining and mineral separation of titanium­bearing minerals and ores, its value addition and  integrated activities ­100%. • FDI in enterprise manufacturing items reserved for small scale sector – 100%. • Defence – up to 49% under FIPB/CCEA approval, beyond – 49% under CCS approval (on a  case­to­case basis, wherever it is likely to result in access to modern and state­of­the­art  technology in the country). • Teleports (setting up of up­linking HUBs/Teleports), Direct to Home (DTH), Cable Networks  (Multi­system operators operating at National or State or District level and undertaking  upgradation of networks towards digitalisation and addressability), Mobile TV and Headend­in­ the Sky Broadcasting Service(HITS) – beyond 49% and up to 74%. • Broadcasting Content Services: uplinking of news and current affairs channels – 26%, uplinking  of non­news and current affairs TV channels – 100%.
  • 162.
    •  Publishing/printing of scientific and technical magazines/specialty journals/periodicals – 100%. • Print media: publishing of newspaper and periodicals dealing with news and current affairs­  26%, Publication of Indian editions of foreign magazines dealing with news and current affairs­  26%. •Terrestrial Broadcasting FM (FM Radio) – 26%. • Publication of  of foreign newspaper – 100%. • Airports – brownfield – beyond 74%. • Non­scheduled air transport service – beyond 49% and up to 74%. • Ground­handling services – beyond 49% and up to 74%. • Satellites – establishment and operation ­ 74%. • Private securities agencies – 49%. • Telecom­beyond 49%. • Single brand retail – beyond 49%. • Asset reconstruction company – beyond 49% and up to 100%. • Banking private sector – beyond 49% and up to 74%, public sector – 20%. • Insurance ­ beyond 26% and up to 49%. • Pension Sector ­ beyond 26% and up to 49%. • Pharmaceuticals – brownfield – 100%. • SECTORS UNDER AUTOMATIC ROUTE • All the items other than above are under the automatic route.
  • 163.
    • SECTORS WHERE FOREIGN DIRECT INVESTMENT IS PROHIBITED : • Lottery Business including Government /private lottery, online lotteries, etc. •Gambling and Betting including casinos etc. • Chit funds • Nidhi company­(borrowing from members and lending to members only). • Trading in Transferable Development Rights (TDRs) • Real Estate Business (other than construction development) or Construction of Farm Houses • Manufacturing of Cigars, cheroots, cigarillos and cigarettes, of tobacco or of tobacco substitutes • Activities / sectors not open to private sector investment e.g. Atomic Energy and Railway  Transport (other than construction, operation and maintenance of (i) Suburban corridor projects through PPP, (ii) High speed train projects, (iii) Dedicated freight lines, (iv) Rolling stock including train sets, and locomotives/coaches manufacturing and maintenance  facilities, (v) Railway Electrification, (vi) Signaling systems, (vii) Freight terminals, (viii) Passenger terminals, (ix) Infrastructure in industrial park pertaining to railway line/sidings including electrified railway  lines and connectivities to main railway line and (x) Mass Rapid Transport Systems.) • Services like legal, book keeping, accounting & auditing.
  • 164.
                                                                  FDI-MAKE IN INDIA • India has already marked its presence as one of the fastest growing economies of the world. It  has been ranked among the top 3 attractive destinations for inbound investments. Since 1991,  the regulatory environment in terms of foreign investment has been consistently eased to make  it investor­friendly. • RECENT POLICY MEASURES •Government eases FDI norms in 15 major sectors. • Townships, shopping complexes & business centres –  up to 100% FDI under the auto  route. Conditions on minimum capitalisation & floor area restrictions have now been removed  for the construction development sector. • India's defence sector now allows consolidated FDI up to 49% under the automatic route. FDI  beyond 49% will now be considered by the Foreign Investment Promotion Board. Govt approval  route will be required only when FDI results in a change of ownership pattern. • Private sector banks now allow consolidated FDI up to 74%. • Up to 100% FDI is now allowed in coffee/rubber/cardamom/palm oil & olive oil plantations  via the automatic route. • 100% FDI is now allowed via the auto route in duty free shops located and operated in the  customs bonded areas. • Manufacturers can now sell their products through wholesale and/or retail, including through e- commerce without Government Approval. • Foreign Equity caps have now been increased for establishment & operation of satellites,  credit information companies, non-scheduled air transport & ground handling services  from 74% to 100%. • 100% FDI allowed in medical devices
  • 165.
    • FDI capincreased in insurance & sub-activities from 26% to 49% • FDI up to 49% has been permitted in the Pension Sector. • Construction, operation and maintenance of specified activities of Railway sector opened to 100% foreign direct investment under automatic route. • FDI policy on Construction Development sector has been liberalised by relaxing the norms pertaining to minimum area, minimum capitalisation and repatriation of funds or exit from the project. To encourage investment in affordable housing, projects committing 30 percent of the total project cost for low cost affordable housing have been exempted from minimum area and capitalisation norms. • Investment by NRIs under Schedule 4 of FEMA (Transfer or Issue of Security by Persons Resident Outside India) Regulations will be deemed to be domestic investment at par with the investment made by residents. • 100% FDI allowed in White Label ATM Operations. • Note : Citizen or entity from Bangladesh & Pakistan can invest only under the government route also investor from Pakistan cannot invest in defence, space, atomic energy and sectors prohibited for foreign investment.
  • 166.
    ECONOMIC SURVEY 2016-Industrial, Corporate & infrastructural performance • As per latest data released in January 2016 on revised estimates of national income the growth of Industrial sector broadly comprising mining, manufacturing, electricity and construction is 5.9 per cent during 2014-15, as against a growth of 5.0 per cent during 2013-14. The advance estimates of national income 2015-16 shows that the growth of industrial sector is estimated to be 7.3 per cent with manufacturing sector growing at 9.5 per cent. • Recent Reforms- Reducing the list of industries that can be considered defence industries requiring industrial licence; and amendments in FDI policy which include allowing FDI in defence up to 49 per cent, in railway infrastructure up to 100 per cent and in the insurance and pension sector up to 49 per cent. The investment limit requiring prior permission from the Foreign Investment Promotion Board (FIPB)/Cabinet Committee on Economic Affairs has been increased from R1200 crore to R3000 crore. The definition of investment by Non Resident Indians (NRI), Persons of Indian Origin (PIO) &Overseas Citizens of India (OCI) in FDI policy has been revised. • The government has launched several programmes/initiatives such as ease of doing business, Make in India, Invest India, and e-biz Mission Mode Project under the National e-Governance Plan. Further, the Government of India is also building a pentagon of corridors across the country to boost manufacturing and to project India as a global manufacturing destination. The National Investment and Infrastructure Fund (NIIF) has been approved to extend equity support to infrastructure Non-Bank Financial Companies (NBFC). Issue of tax- free infrastructure bonds has been allowed for rail, roads and irrigation programmes.
  • 167.
     FDI inflowsof last fifteen years –( Pneumonic- SC IT A/atics) Services sector (17.6%) > Construction development (8.8 per cent)> Computer hardware and software (7.2 per cent)> Telecommunications (6.6 percent) > Automobile industry (5.2 percent).  Country-wise FDI Inflow (2015-16): Singapore ,Mauritius, Netherlands and USA account for the major share . During 2015-16 (April- November), more than 60 per cent have come from two geographically small countries named Singapore and Mauritius. (These inflows need perhaps to be examined more closely to determine whether they constitute actual investment or are diversions from other sources to avail of tax benefits under the Double Tax Avoidance Agreement that these countries have with India)  State-wise analysis of FDI inflows in last 15 yrs : Delhi, Haryana, Maharashtra, Karnataka, Tamil Nadu, Gujarat and Andhra Pradesh have together attracted more than 70 per cent of total FDI inflows to India during last 15 years.
  • 168.
    CURRENT AFFAIRS100 PERCENT FDI IN E-COMMERCE E-commerce in India  The e-commerce industry has grown rapidly in India logging a growth rate of over 60 per cent.  Studies have pegged the size of the industry at around USD 38 billion by 2016 and it is expected to touch USD 50 billion mark in 2020.  It is an industry that has the potential to create jobs and spur economic growth.  This sector has attracted the maximum FDI in 2015.  Some of the prominent e-commerce marketplace players in India are Amazon, Flipkart, Snapdeal, ShopClues and Paytm - all funded by foreign investors.  At present, 100 per cent FDI is permitted in B2B transactions under automatic route.  Companies such as Amazon India, Flipkart, Snapdeal and many others hosted thousands of sellers, were described as technology enablers rather than e-retailers. They claimed to have no inventory of their own. That kept them going even with a ban on FDI in e- commerce. New Guidelines  Government permitted 100 per cent FDI in the market place format of e-commerce retailing under the automatic route.  The government extended the definition of marketplace to include support services to sellers with respect to warehousing, logistics, order fulfillment, call Centre, payment collection and other services.  The marketplace model of e-commerce means providing of an IT platform by an e-commerce entity on a digital and electronic network to act as a facilitator between buyer and seller.  Further, the inventory-based model of e-commerce means an e-commerce activity where inventory of goods and services is owned by e-commerce entity and is sold to consumers directly.  FDI has not been permitted in inventory-based model of e-commerce.  The guidelines allowed e-commerce marketplace to provide several support services to sellers, but, it said that such entities will not exercise ownership over the inventory.  The e-commerce entities providing marketplace will not directly or indirectly influence the sale price of goods or services and shall maintain level playing field. 100 percent FDI under automatic route is permitted in marketplace model of e-commerce. • FDI is not permitted in inventory based model of e-commerce. •Marketplace model vs. Inventory model • Marketplace based model of e-commerce means providing of an information technology platform by an e-commerce entity on a digital and electronic network to act a facilitator between buyer and seller. • Inventory based model of e-commerce means e-commerce activity where inventory of goods and services is owned by e-commerce entity and is sold to the consumers directly. • Indian Scenario: In India, 100 percent FDI under automatic route is permitted in marketplace model, while no FDI is permitted in inventory based model of e-commerce. • In marketplace model, any warrantee or guarantee of goods and services sold will be responsible of the seller.
  • 169.
    • E-COMMERCE ININDIA • Why in news? • The report by CII-DELOITTE REPORT calls the e-commerce in India as a game changer for the economy . • Reasons •  By 2020, B2B (Business to Business) model is expected to see a 2 fold increase while B2C(Business to Customer) will see 7 fold increase. •  On a long term it has potential to generate employment, increase export revenues and enhance tax-collections. •  Since B2B model is showing more acceptability, this would see an increase in the number of MSMEs and entrepreneurs from hinterland. • Challenges to e-commerce industries •  Lack of uniform taxation across states leading to difficulty in movement of goods. •  Logistics issues and infrastructure. •  Payments and banking penetration as cash transaction comes with high administration cost. •  Internet penetration. •  Skilled manpower. • Recommendation by the report •  Uniform tax structure in the form of GST to ensure free flow of goods. •  Timely implementation of programmes like Digital India, Skill India, Startup India etc to support e commerce ecosystem and rural penetration. •  Increasing the number of years within which the tax holiday can be availed by startups in the e-commerce industry.
  • 170.
    Boost Export HOW?= Foreign Trade Policy 2015-20
  • 171.
    • TERMS- TRADEAGREEMENTS (RTA) • Free Trade Agreement (FTA): A free trade agreement is a preferential arrangement in which members reduce tariffs on trade among themselves, while maintaining their own tariff rates for trade with nonmembers. • Customs Union (CU): A customs union (CU) is a free-trade agreement in which members apply a common external tariff (CET) schedule to imports from non- members. • Common Market (CM): A common market is a customs union where movement of factors of production is relatively free amongst member countries • Economic Union (EU): An economic union is a common market where member countries coordinate macro-economic and exchange rate policies. • Trade liberalization, give rise not only to beneficial trade creation but also to trade diversion. Trade diversion occurs when tariff preferences offered under an FTA causes a shift of imports from firms in non- FTA member countries to less efficient firms within the trade bloc, which now become competitive due to tariff reliefs.
  • 172.
    5 Stages /evolution
  • 173.
  • 174.
    1. WTO SPS/TBT:EU/US block entry of our goods. (e.g. Mangoes) 2. WTO food subsidies related issues. 3. WTO trade rounds dragged for decades without consensus. 4. Therefore, non-WTO Bilateral, multilateral and regional trade agreements to counter 1+2+3 Trade Agreement : WHY? FTP-2015FTP-2015
  • 175.
    CECA, CEPA, BTIA •Comprehensive Economic Cooperation Agreements (CECAs) • Comprehensive Economic Partnership Agreements (CEPAs) • Broadbased Trade and Investment Agreements (BTIA) • Free trade agreement • FTA What’s the difference?
  • 176.
    CECA, CEPA, BTIA •Goods • Services • Investment • IPR • Movement of people. • = more trade, jobs than FTA • Traditionally concerned with Goods only. • FTA What’s the difference? As per FTP- 2015?
  • 177.
  • 178.
    1+2 = ErodeIndian grip over US-EU markets 50% of world trade captured. 33% of World Trade 50% of population
  • 179.
    Trans-Atlantic Trade and InvestmentPartnership Between US and EU ~0% import duty for their products= India hurt. Stringent quality norms, environment norms = Indian hurt. E.g. pesticide residues in oranges (Nagpur vs Florida); Lead / heavy metals in mfg. goods/toy etc. TATIP AgreementAgreement
  • 180.
    ~0% import dutyfor their products= Tariff barrier for India, China Stringent quality norms, environment norms, faster clearance to US/EU = Non- Tariff barrier for India China. E.g. pesticide residues in oranges (Nagpur vs Florida); Lead / heavy metals in mfg. goods/toy etc. TATIP AgreementAgreement
  • 181.
    TPP: 12 members:USA + Canada + 10 Asia-Pacific
  • 182.
    1. Trans pacificpartnership 2. ▲ Export of “Made in USA” goods and services. 3. Tariff barriers: 0% 4. Non tariff barriers: Minimal. 5. Sync. All partners with American environment, labour, IPR laws Salient Features TPPTPP
  • 183.
    RCEP: China, India,ASEAN, Jap, Korea, Aus., NZ
  • 184.
    1. TPP: timingand terms yet unclear 2. If we want to join, then must reform environment, labour, IPR front in advance, to align with developed nations. 3. India cannot be a part of it bcoz our social-economic development goals. Compliance Cost high Agro, Mfg. & service industries. India should join TPP? RCEP/TPPRCEP/TPP
  • 185.
  • 186.
    1. India: amember. 2. Obligations to reform environment / Labour laws: not much. 3. Generous Exemptions to protect local industry: yes 4. lenient time-tables for implementation: yes 5. Ideal to join such global value added chain. Produce in nearest low cost destination. (CMLV) RCEP Trade grouping Trade grouping
  • 187.
    ~400 trade agreementin action among countries India should Make agreements with countries where 1.India has potential market 2.India can source raw material / components. Way ahead? FTP-2015FTP-2015
  • 188.
    FTP-2015: Region wiseStrategies (8)
  • 189.
  • 190.
    Salient features ofEXIM Policy 2015-2020- • Merchandise Export from India Scheme: The 6 different schemes of the earlier FTP (Focus Product Scheme, Market Linked Focus Product Scheme, Focus Market Scheme, Agriculture Infrastructure Incentive Scrip, Vishesh Krishi and Gram Udyog Yojana and Incremental Export Incentive Scheme) which had varying sector-specific or actual user only conditions attached to their use have been merged into a single scheme, namely the Merchandise Export from India Scheme (MEIS). • Service Export from India Scheme: The Served from India Scheme (SFIS) has been replaced with the Service Export from India Scheme (SEIS). The SEIS applies to 'service providers located in India' instead of 'Indian service providers'. Thus, it provides for incentives to all service providers of notified services who are providing services from India. • Incentives (MEIS & SEIS) to be available for SEZs: EXIM Policy 2015-20 extends the benefits of the MEIS and SEIS to special economic zones (SEZ) as well, which will give a new impetus to the development and growth of SEZs. •Other Measures: (a) Under the Export Promotion Capital Goods (EPCG) scheme, in case capital goods are procured from indigenous manufacturers, specific export obligation has been reduced to 75%. This is designed to help the indigenous capital goods manufacturing industry. (b) Under the MEIS, export items with high domestic content and value addition have generally been provided higher levels of incentives. (c) EASE OF BUSINESS- Hard copies of applications and specified documents which were required to be submitted earlier for incentive schemes and duty exemption schemes have now been dispensed with. - Landing documents of export consignments as proof for notified market can now be digitally uploaded as specified. -There will be no need to submit copies of permanent records/documents repeatedly with each application, once the same are uploaded in the exporter/importer profile. - Dedicated e-mail addresses have been provided for faster and paperless communication with various committees of the Directorate General of Foreign Trade (DGFT), e.g. Norms Committee and Exim Facilitation Committee.
  • 191.
    CURRENT AFFAIRS100 PERCENT FDI IN E-COMMERCE E-commerce in India  The e-commerce industry has grown rapidly in India logging a growth rate of over 60 per cent.  Studies have pegged the size of the industry at around USD 38 billion by 2016 and it is expected to touch USD 50 billion mark in 2020.  It is an industry that has the potential to create jobs and spur economic growth.  This sector has attracted the maximum FDI in 2015.  Some of the prominent e-commerce marketplace players in India are Amazon, Flipkart, Snapdeal, ShopClues and Paytm - all funded by foreign investors.  At present, 100 per cent FDI is permitted in B2B transactions under automatic route.  Companies such as Amazon India, Flipkart, Snapdeal and many others hosted thousands of sellers, were described as technology enablers rather than e-retailers. They claimed to have no inventory of their own. That kept them going even with a ban on FDI in e-commerce. New Guidelines  Government permitted 100 per cent FDI in the market place format of e-commerce retailing under the automatic route.  The government extended the definition of marketplace to include support services to sellers with respect to warehousing, logistics, order fulfillment, call Centre, payment collection and other services.  The marketplace model of e-commerce means providing of an IT platform by an e-commerce entity on a digital and electronic network to act as a facilitator between buyer and seller.  Further, the inventory-based model of e-commerce means an e-commerce activity where inventory of goods and services is owned by e-commerce entity and is sold to consumers directly.  FDI has not been permitted in inventory-based model of e-commerce.  The guidelines allowed e-commerce marketplace to provide several support services to sellers, but, it said that such entities will not exercise ownership over the inventory.  The e-commerce entities providing marketplace will not directly or indirectly influence the sale price of goods or services and shall maintain level playing field.
  • 192.
    CURRENT AFFAIRSAdvantages  Itwill give the much-needed clarity to undertake business with certainty in longer term attracting foreign investment in this sector.  Enabling the marketplace operator to provide value added services. Disadvantages  The new regime will increase bureaucratic discretion and open the door to rent-seeking.  It has further increased complexity of e-retail by drawing an artificial distinction between inventory based model and marketplace based e-commerce.  The cap of 25 per cent on sales by a single vendor in a marketplace may prove to be restrictive, more so if the vendor sells high value items particularly in sale of electronic items, where a vendor may be offering exclusive access to certain items or discounts.  The above limit of 25 percent, without a strong commercial principle, may result in firms creating newer entities to avoid being caught.  The rule that states e-retailers “will not directly or indirectly influence the sale price of goods and services and maintain a level playing field” goes against “pricing freedom” which is central to the functioning of a market and it also faces practical difficulties in enforcing this. Way Forward Government should dissolve the distinction between physical- and e-retail and simplify norms that allow businesses to flourish, creating jobs as well as providing a richer array of goods and services to consumers at the lowest price.
  • 193.
    CURRENT AFFAIRS DIPP notifiedGuidelines for 100% FDI in B2B E-commerce The Department of Industrial Policy and Promotion (DIPP) on 29 March 2016 notified Guidelines for 100 percent Foreign Direct Investment (FDI) in Business to Business (B2B) e-commerce. The guidelines were issued under the Consolidated FDI Policy Circular 2015 that was notified by the DIPP of the Ministry of Commerce and Industry. • E-commerce means buying and selling of goods and services including digital products over digital and electronic network. • 100 percent FDI under automatic route is permitted in marketplace model of e-commerce. • FDI is not permitted in inventory based model of e-commerce. •Marketplace model vs. Inventory model • Marketplace based model of e-commerce means providing of an information technology platform by an e-commerce entity on a digital and electronic network to act a facilitator between buyer and seller. • Inventory based model of e-commerce means e-commerce activity where inventory of goods and services is owned by e-commerce entity and is sold to the consumers directly. • Indian Scenario: In India, 100 percent FDI under automatic route is permitted in marketplace model, while no FDI is permitted in inventory based model of e-commerce. • In marketplace model, any warrantee or guarantee of goods and services sold will be responsible of the seller.
  • 194.
  • 195.
    Salient features ofEXIM Policy 2015-2020- • Merchandise Export from India Scheme: The 6 different schemes of the earlier FTP (Focus Product Scheme, Market Linked Focus Product Scheme, Focus Market Scheme, Agriculture Infrastructure Incentive Scrip, Vishesh Krishi and Gram Udyog Yojana and Incremental Export Incentive Scheme) which had varying sector-specific or actual user only conditions attached to their use have been merged into a single scheme, namely the Merchandise Export from India Scheme (MEIS). • Service Export from India Scheme: The Served from India Scheme (SFIS) has been replaced with the Service Export from India Scheme (SEIS). The SEIS applies to 'service providers located in India' instead of 'Indian service providers'. Thus, it provides for incentives to all service providers of notified services who are providing services from India. • Incentives (MEIS & SEIS) to be available for SEZs: EXIM Policy 2015-20 extends the benefits of the MEIS and SEIS to special economic zones (SEZ) as well, which will give a new impetus to the development and growth of SEZs. •Other Measures: (a) Under the Export Promotion Capital Goods (EPCG) scheme, in case capital goods are procured from indigenous manufacturers, specific export obligation has been reduced to 75%. This is designed to help the indigenous capital goods manufacturing industry. (b) Under the MEIS, export items with high domestic content and value addition have generally been provided higher levels of incentives. (c) EASE OF BUSINESS- Hard copies of applications and specified documents which were required to be submitted earlier for incentive schemes and duty exemption schemes have now been dispensed with. - Landing documents of export consignments as proof for notified market can now be digitally uploaded as specified. -There will be no need to submit copies of permanent records/documents repeatedly with each application, once the same are uploaded in the exporter/importer profile. - Dedicated e-mail addresses have been provided for faster and paperless communication with various committees of the Directorate General of Foreign Trade (DGFT), e.g. Norms Committee and Exim Facilitation Committee.
  • 196.
    FTP-2015: Region wiseStrategies (8)
  • 197.
    1. South AsianAssociation for Regional Cooperation 2. Mere 20 billion$ trade. 3. Largest trading partner: Bangladesh > Sri Lanka > Nepal > Pak. 4. 0% duty market access given to L.D.C – Bhutan, Maldives et al. 5. problem: Pakistan SAARC Present FTP-2015FTP-2015
  • 198.
    International Credit Ratingagencies Countries are issued sovereign credit ratings. This rating analyzes the general creditworthiness of a country or foreign government. Sovereign credit ratings take into account the overall economic conditions of a country including the volume of foreign, public and private investment, capital market transparency and foreign currency reserves. Sovereign ratings also assess political conditions such as overall political stability and the level of economic stability a country will maintain during times of political transition. Institutional investors rely on sovereign ratings to qualify and quantify the general investment atmosphere of a particular country. Fitch Ratings John Knowles Fitch founded the Fitch Publishing Company in 1913. Fitch published financial statistics for use in the investment industry via "The Fitch Stock and Bond Manual" and "The Fitch Bond Book." In 1924, Fitch introduced the AAA through D rating system that has become the basis for ratings throughout the industry. With plans to become a full-service global rating agency, in the late 1990s Fitch merged with IBCA of London, subsidiary of Fimalac, S.A., a French holding company. Fitch also acquired market competitors Thomson BankWatch and Duff & Phelps Credit Ratings Co. Beginning in 2004, Fitch began to develop operating subsidiaries specializing in enterprise risk management, data services and finance industry training with the acquisition of Canadian company, Algorithmics, and the creation of Fitch Solutions and Fitch Training. Moody's Investors Service John Moody and Company first published "Moody's Manual" in 1900. The manual published basic statistics and general information about stocks and bonds of various industries. From 1903 until the stock market crash of 1907, "Moody's Manual" was a national publication. In 1909 Moody began publishing "Moody's Analyses of Railroad Investments", which added analytical information about the value of securities. Expanding this idea led to the 1914 creation of Moody's Investors Service, which, in the following 10 years, would provide ratings for nearly all of the government bond markets at the time. By the 1970s Moody's began rating commercial paper and bank deposits, becoming the full-scale rating agency that it is today. Standard & Poor's (S & P) Henry Varnum Poor first published the "History of Railroads and Canals in the United States" in 1860, the forerunner of securities analysis and reporting to be developed over the next century. Standard Statistics formed in 1906, which published corporate bond, sovereign debt and municipal bond ratings. Standard Statistics merged with Poor's Publishing in 1941 to form Standard and Poor's Corporation, which was acquired by The McGraw-Hill Companies, Inc. in 1966. Standard and Poor's has become best known by indexes such as the S&P 500, a stock market index that is both a tool for investor analysis and decision making, and a U.S. economic indicator.
  • 199.
  • 200.
    POVERTY  Schemes-MNREGA, Urbanand Rural livelihood missions • Scheme#1: MNREGA Act 2005 • under Rural Development ministry • Promises minimum 100 days of unskilled manual work • To each rural household. (not to each person) • In a financial year (1st April to 31st March)
  • 201.
    POVERTYPoverty is thedeprivation of common necessities such as food, clothing, shelter and safe drinking water, all of which determine our quality of life. It may also include the lack of access to opportunities such as education and employment which aid the escape from poverty and/ or allow one to enjoy the respect of fellow citizens. According to World Bank, “Poverty is an income level below some minimum level necessary to meet basic needs. This minimum level is usually called the “poverty line”. Definition agreed by the World Summit on Social Development in Copenhagen in 1995:  Poverty is a condition characterized by severe deprivation of basic human needs, including food, safe drinking water, sanitation facilities, health, shelter, education and information. It depends not only on income but also on access to services.  It includes a lack of income and productive resources to ensure sustainable livelihoods; hunger and malnutrition; ill health; limited or lack of access to education and other basic services; increased morbidity and mortality from illness; homelessness and inadequate housing; unsafe environments and social discrimination and exclusion.  It is also characterized by lack of participation in decision making and in civil, social and cultural life.  It occurs in all countries: as mass poverty in many developing countries, pockets of poverty amid wealth in developed countries, loss of livelihoods as a result of economic recession, sudden poverty as a result of disaster or conflict, the poverty of low-wage workers, and the utter destitution of people who fall outside fam support systems, social institutions, safety nets. Poverty has many dimensions  A material dimension (food, clothing etc.)  A psychological dimension (respect, self-esteem, trust, fear)  A political dimension (power, representation) and  A social dimension (education, health, work). :: The latter 2 dimensions point to the fact that poverty, while often suffered alone and in solitude, requires social cooperation if it is to be eliminated.
  • 202.
    POVERTY - The proportionof the developing world's population living in extreme economic poverty fell from 28% in 1990 to 21% in 2001. Most of this improvement has occurred in East and South Asia. In East Asia the World Bank reported that "The poverty headcount rate at the $2-a-day level is estimated to have fallen to about 27% (in 2007), down from 69% in 1990." In Sub-Saharan Africa extreme poverty went up from 41% in 1981 to 46% in 2001. - Ultra-poverty, a term apparently coined by Michael Lipton, connotes being amongst poorest of the poor in low-income countries. Lipton defined ultra-poverty as receiving less than 80% of minimum caloric intake whilst spending more than 80% of income on food.
  • 203.
    POVERTY Types- Absolute poverty& Relative Poverty -Measures- Gini Coefficient & Lorenz Curve - HPI (Life expectancy, knowlege & std of living) - GHI (by IFPRI- Internat Food Policy Research Inst) - MPI (10 INDICATORS) 1. Lakdawala Committee (1984-89)2400 C (Rural)& 2100C (Urban) 1. Tendulkar Committee (2005-09)-Per Capita Exp per mnth(Only counts Expenditure on food, health, education, clothing); 816(R) & 1000 (U) i.e. 27&33 resp per day- PCE per month; 27 cr poor
  • 205.
    TENDULKAR COMMITTEE REPORT:: There has been a growing concern on the official estimates of poverty. In view of this, Planning Commission set up an expert group under the chairmanship of Suresh Tendulkar to examine the issue and suggest a new poverty line and estimates. Following are the salient features of the proposed poverty lines: 1 The expert group has also taken a conscious decision to move away from anchoring the poverty lines to a calorie intake norm in view of the fact that calorie consumption calculated by converting the consumed quantities in the last 30 days as collected by NSS has not been found to be well correlated with the nutritional outcomes observed from other specialized surveys either over time or across space (i.e. between states or rural and urban areas). 2 NSSO has decided to shift to Mixed Reference Period (MRP) for all its consumption surveys in future, namely, 365-days for low frequency items (clothing, footwear, durables, education and institutional health expenditure) and 30-days for all the remaining items. This change captures the household consumption expenditure of the poor households on low-frequency items of purchase more satisfactorily than the earlier 30-day recall period. The Expert Group decided to adopt the MRP-based estimates of consumption expenditure as the basis for future poverty lines as against previous practice of using Uniform Reference Period estimates of consumption expenditure. 3 The estimated urban share of the poor population (described as headcount ratio or poverty ratio) in 2004-05, namely, 25.7% at the all-India level, is generally accepted as being less controversial than its rural counterpart at 28.3% that has been heavily criticized as being too low. It was decided to recommend MRP-equivalent of urban PLB corresponding to 25.7% urban head count ratio as the new reference PLB to be provided to rural as well as urban population in all the states after adjusting it for within-state urban-relative-to-rural and rural and urban state-relative-to-all-India price differentials. 4 The new poverty lines have been arrived at after assessing the adequacy of private household expenditure on education and health, while the earlier calorie-anchored poverty lines did not explicitly account for these. 5 It may be noted that although those near the poverty line in urban areas continue to afford the original calorie norm of 2100 per capita per day, their actual observed calorie intake from 61st Round of NSS of is 1776 calories per capita. This actual intake is very close to the revised calorie intake norm of 1770 per capita per day currently recommended for India by the Food and Agriculture Organization (FAO). Actual observed calorie intake of those near the new poverty line in rural areas (1999 calories per capita) is higher than the FAO norm. 6 Separate allowance for private expenditure on transport and conveyance has been made in the recommended poverty lines. For rent and conveyance, actual expenditure share for these items were used to adjust the poverty line for each state.
  • 206.
    3. Rangarajan Committee(2012-14)-per mth exp for fam of five (food + nonfood items such as education, healthcare, clothing, transport (conveyance), rent. + non-food items that meet nutritional requirements) 4860 (R) & 7035 (U)i.e. 32 & 47 resp per day; 37 cr poor - ICMR recommendation for calories, proteins & fat- 2155 C,48gm & 28gm Rural and 2090C,50 gm & 26 gmUrban+-10% --Controversy 4. Saxena Committee for BPL Census in Rural area(2009)- Automatic exclusion like double the avg agri land of dist,four or three wheelers , mechanised farm eqpt like tractor,thresher,salary 10000, ITR Automatic inclusion like primitive tribal group,mahadalit, family head as minor or destitute or disabled or single woman. 5. Hashim Committee for BPL fam in Urban Areas • Highest rural poverty • Odisha, MP,Bihar,Assam • Lowest poverty • Kerala (7.1%),Himachal (8.1%),Punjab (8.3%) • Engel’s law says: when income rises, % of overall income spent on food item decreases. We can see this happening in urban areas. Urban popln spending ~39% while villagers spending ~49% of their income on food. • Among states: Kerala spends the least money on food.
  • 207.
    • Principles ofAmartya Sen offer useful alternative to understand poverty. Capability approach to understanding poverty goes beyond income and stresses the whole range of means, available to achieve human capabilities such as literacy, longevity and access to income. From this viewpoint, poverty is seen as the failure of some basic capabilities to function- a person lacking the opportunity to achieve some minimally accepted level of these functionings.
  • 208.
  • 209.
    CURRENT AFFAIRS  NitiAayog supports Tendulkar Poverty estimates- The country has witnessed reigning controversies on the subject of determining poverty line over the decades since Independence. Following the criticism of poverty estimates recommended by Tendulkar and Rangarajan Committee, had led the government to appoint a Niti Aayog task force to devise ways of reducing poverty. The Panagriya-headed Niti Aayog task force on Eliminating Poverty has backed the Tendulkar poverty line. This poverty line categorises people earning less that Rs. 33 a day as poor. The Niti Aayog has argued that poverty line is just an indicator and not identification of the poor in the country. The State governments use BPL census viz Socio-Economic Census 2011 to identify the poor in the state. The task force defends a low poverty line arguing that a high poverty line would only track the number of people who have achieved a certain level of comfort and would do precious little in terms of correctly identifying and targeting the actual poor in the country.
  • 210.
    UNEMPLOYMENT • TYPES- 1.INVOLUNTARY (No Demand) 2. STRUCTURAL (Tech Change) 3. CYCLICAL (Unempl during downtrend) 4. FRICTIONAL (Change of job) RURAL UNEMPLOYMENT- 1. SEASONAL 2. DISGUISED 3.UNDEREMPLOYMENT
  • 211.
    • The NationalSample Survey Organization (NSSO),since its inception in 1950, does the measurement of employment / unemployment in India. • The National Sample Survey Organization (NSSO) provides three different estimates of employment and unemployment based on different approaches / reference periods used to classify an individual’s activity status. These are the • Usual status approach with a reference period of 365 days preceding the date of survey • Current weekly status approach with a reference period of seven days preceding the date of survey • Current daily status approach with each day of the seven days preceding date of survey as the reference period. • In order to find out whether an individual is employed or unemployed it needs to be first determined whether h/she belongs to the ‘Labour Force’ or not, which in turn depends on the Activity Status of the individual during the chosen reference period. • Activity Status refers to the activity situation in which the individual is found during the reference period with respect to his participation in economic or non-economic activities. • The NSSO defines following three broad Activity Status i) Working (engaged in an economic activity) i.e. ‘Employed’ ii) Seeking or available for work i.e. ‘Unemployed’ iii) Neither seeking nor available for work. • All those individuals having a broad activity status as i) or ii) above are classified as being in the Labour Force and those having activity status iii) are classified as outside the Labour Force. Thus labour force constitutes of both employed and unemployed. • In other words, Labor force (also called work force) is the total number of people employed or seeking employment in a country or region.One is classified as ‘not in labour force’, if he or she was engaged in relatively longer period in any one of the non- gainful activities • The NSSO collected employment data based on ‘usual status (UPS)’ only upto its eighth round. However from 9th round onwards, it started collecting data based on ‘current weekly status (CWS)’ approach also. Planning Commission set up the Committee of Experts on Employment Estimates (Dantwala Committee) in 1960. The Committee recommended concepts and definitions for conducting such surveys. It recommended collection of data based on CDS in addition to UPS and CWS. Accordingly, beginning with the 27th round (1972-73),quinquennial(5-yearly) surveys were being conducted by NSSO to collect employment-unemployment data based on all the three approaches of UPS,CWS and CDS. • In the annual survey rounds of NSSO, only employment-unemployment data based on ‘usual activity status’ and ‘current weekly status’ were collected up to 59th round. However in 60th round, a separate schedule was canvassed to collect employment and unemployment data on ‘current daily status’ also. In fact, since 60th round, NSSO is collecting data on employment and unemployment on current daily status also in its annual rounds. • NSSO surveys are conducted on quinquennial basis. In order to measure employment-unemployment on an annual basis, Employment-Unemployment Survey is being conducted by Labour Bureau since 2009. This survey also captures the labour estimates in terms of usual principal status, usual principal and subsidiary status, current weekly status and current daily status
  • 212.
    • NSSO definedwork or gainful activity as the activity pursued for pay, profit or family gain i.e. Activity which adds value to national product.

Editor's Notes

  • #198 Lead in paint Server security