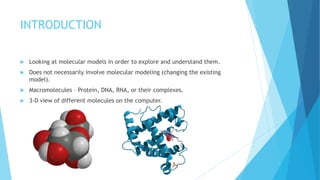
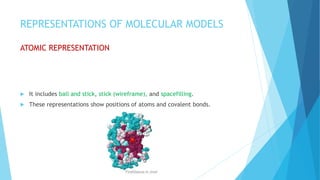
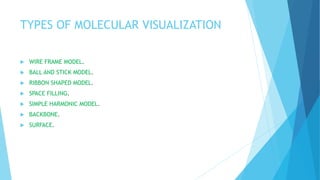
MOLECULAR
VISUALIZATION
ALEN SHAJI
P1914015
INTRODUCTION
 Looking at molecular models in order to explore and understand them.
 Does not necessarily involve molecular modeling (changing the existing
model).
 Macromolecules – Protein, DNA, RNA, or their complexes.
 3-D view of different molecules on the computer.
REPRESENTATIONS OF MOLECULAR MODELS
ATOMIC REPRESENTATION
 It includes ball and stick, stick (wireframe), and spacefilling.
 These representations show positions of atoms and covalent bonds.
SLABBING
 A usefull way to see atomic details of a small part of a large macromolecular
model is to centre the moiety of interest, and then cut away front and back
portions of the molecules.
 It is usefull to see buried structures and their environments, such as the
hydrophobic core of a protein domain.
 It can be done using FirstGlance in Jmol.
SIMPLIFIED SCHEMATIC REPRESENTATIONS
BACKBONES
 Simplified representations of the polypeptide backbone or main chain, are
very helpful in understanding structure when it comes to large molecules such
as Proteins, DNA, RNA, and their complexes.
 Using FirstGlance in Jmol.
DISULFIDE BONDS
 FirstGlance in Jmol highlights disulfide bonds in one click, and has several
options for rendinering and coloring them.
COLOUR SCHEMES FOR MACROMOLECULES
 A set of standard color schemes for macromolecules, called DRuMS, was
released in 2000.
 Colors for chemical elements.
STRUCTURAL ANALYSIS
 Molecular function.
 Prediction of function.
 Experimental design to test predictions.
TYPES OF MOLECULAR VISUALIZATION
 WIRE FRAME MODEL.
 BALL AND STICK MODEL.
 RIBBON SHAPED MODEL.
 SPACE FILLING.
 SIMPLE HARMONIC MODEL.
 BACKBONE.
 SURFACE.
WIRE FRAME MODEL
 Skeletal form of molecules – represent as wires.
 Network of wire.
 Line represents the bonds.
 Shows individual bonds and corresponding angles.
RIBBON SHAPED MODEL
 Spherical or cylindrical ribbons.
 Display the folding and structure of proteins.
BALL AND STICK MODEL
 Ball represents the atoms.
 Stick represents the bonds.
 Shows atomic positions and bonds and volume.
SIMPLE HARMONIC MODEL
 Only represents grooves and projections in the molecules.
SPACE FILLING
 Spheres represents the electro cloud around nuclei of atoms.
 Relative size of atoms and groups show up clearly.
 Merged spheres represents the sharing of electrons.
RasMol
 Most frequently available tool.
 Derived from Raster and molecules.
 Molecular graphics programe.
 For visualizing proteins, nucleic acid and small molecules for which 3-D
structures is available.
 In order to display molecules, RasMol requires atomic coordinate file that
specifies the position of every atom in the molecule through its 3-D Cartesian
coordinates.
 RasMol accept this coordinate file variety of formats including Protein Data
Bank format.
 It provides user a choice of colour schemes and molecular representation.
 Additional features including test labelling for slected atoms, different colour
schemes of different parts of the molecule, zoom, rotation etc.
REFERENCE
 Jin Xiong (2007) Essential Bioinformatics, Cambridge University, PressIndia,
Pvt LTD.
 Wikipedia - Molecular Visualization, Bioinformatics.
THANK YOU

Molecular visualization

  • 1.
  • 2.
    INTRODUCTION  Looking atmolecular models in order to explore and understand them.  Does not necessarily involve molecular modeling (changing the existing model).  Macromolecules – Protein, DNA, RNA, or their complexes.  3-D view of different molecules on the computer.
  • 3.
    REPRESENTATIONS OF MOLECULARMODELS ATOMIC REPRESENTATION  It includes ball and stick, stick (wireframe), and spacefilling.  These representations show positions of atoms and covalent bonds.
  • 4.
    SLABBING  A usefullway to see atomic details of a small part of a large macromolecular model is to centre the moiety of interest, and then cut away front and back portions of the molecules.  It is usefull to see buried structures and their environments, such as the hydrophobic core of a protein domain.  It can be done using FirstGlance in Jmol.
  • 5.
    SIMPLIFIED SCHEMATIC REPRESENTATIONS BACKBONES Simplified representations of the polypeptide backbone or main chain, are very helpful in understanding structure when it comes to large molecules such as Proteins, DNA, RNA, and their complexes.  Using FirstGlance in Jmol.
  • 6.
    DISULFIDE BONDS  FirstGlancein Jmol highlights disulfide bonds in one click, and has several options for rendinering and coloring them.
  • 7.
    COLOUR SCHEMES FORMACROMOLECULES  A set of standard color schemes for macromolecules, called DRuMS, was released in 2000.  Colors for chemical elements.
  • 8.
    STRUCTURAL ANALYSIS  Molecularfunction.  Prediction of function.  Experimental design to test predictions.
  • 9.
    TYPES OF MOLECULARVISUALIZATION  WIRE FRAME MODEL.  BALL AND STICK MODEL.  RIBBON SHAPED MODEL.  SPACE FILLING.  SIMPLE HARMONIC MODEL.  BACKBONE.  SURFACE.
  • 10.
    WIRE FRAME MODEL Skeletal form of molecules – represent as wires.  Network of wire.  Line represents the bonds.  Shows individual bonds and corresponding angles.
  • 11.
    RIBBON SHAPED MODEL Spherical or cylindrical ribbons.  Display the folding and structure of proteins.
  • 12.
    BALL AND STICKMODEL  Ball represents the atoms.  Stick represents the bonds.  Shows atomic positions and bonds and volume.
  • 13.
    SIMPLE HARMONIC MODEL Only represents grooves and projections in the molecules.
  • 14.
    SPACE FILLING  Spheresrepresents the electro cloud around nuclei of atoms.  Relative size of atoms and groups show up clearly.  Merged spheres represents the sharing of electrons.
  • 15.
    RasMol  Most frequentlyavailable tool.  Derived from Raster and molecules.  Molecular graphics programe.  For visualizing proteins, nucleic acid and small molecules for which 3-D structures is available.  In order to display molecules, RasMol requires atomic coordinate file that specifies the position of every atom in the molecule through its 3-D Cartesian coordinates.  RasMol accept this coordinate file variety of formats including Protein Data Bank format.
  • 16.
     It providesuser a choice of colour schemes and molecular representation.  Additional features including test labelling for slected atoms, different colour schemes of different parts of the molecule, zoom, rotation etc.
  • 17.
    REFERENCE  Jin Xiong(2007) Essential Bioinformatics, Cambridge University, PressIndia, Pvt LTD.  Wikipedia - Molecular Visualization, Bioinformatics.
  • 18.