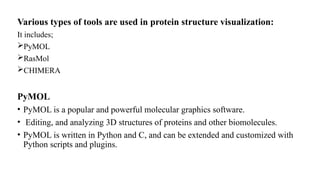
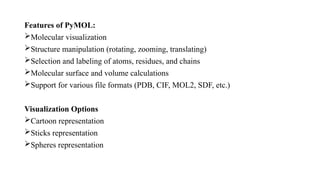
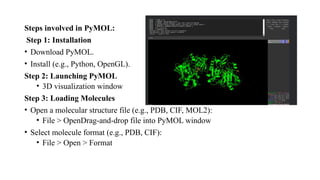
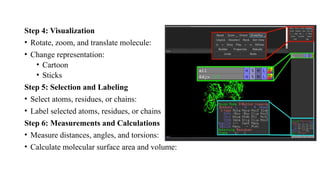
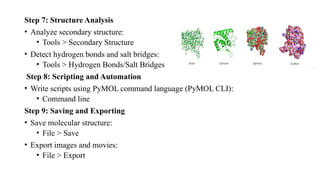
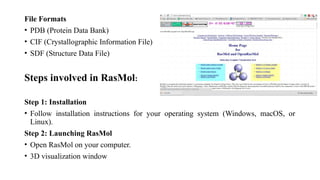
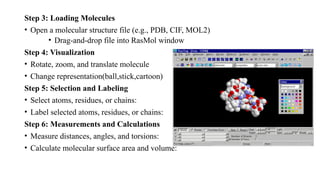
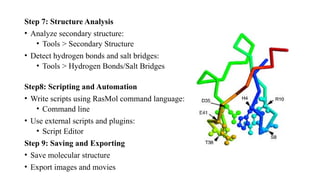
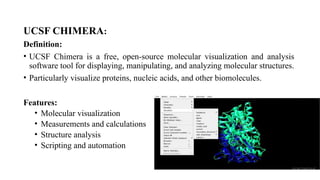
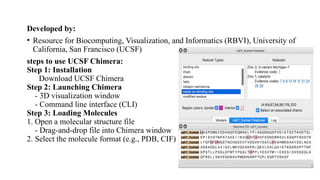
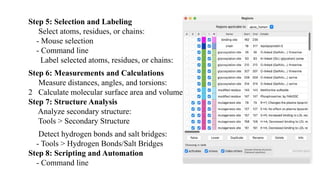
PROTEIN STRUCTURE
VISUALIZATION AND COMPARISION
SUBMITTED TO:
Ms.P.MALA
Assistant professor
Department of biotechnology
PMIST
SUBMITTED BY;
MADHUMITHA .S
ll-M.Sc Biotechnology
Computational biology
Protein structure visualization
Protein structure visualization tools are software applications that allow users to
view, manipulate, and analyze the three-dimensional (3D) structures of proteins
and other biomolecules.
These tools are essential for understanding the;
• molecular architecture,
• function, and interactions of proteins,
• designing new drugs and vaccines.
There are many protein structure visualization tools available, each with different
features, capabilities, and limitation.
Various types of tools are used in protein structure visualization:
It includes;
PyMOL
RasMol
CHIMERA
PyMOL
• PyMOL is a popular and powerful molecular graphics software.
• Editing, and analyzing 3D structures of proteins and other biomolecules.
• PyMOL is written in Python and C, and can be extended and customized with
Python scripts and plugins.
Features of PyMOL:
Molecular visualization
Structure manipulation (rotating, zooming, translating)
Selection and labeling of atoms, residues, and chains
Molecular surface and volume calculations
Support for various file formats (PDB, CIF, MOL2, SDF, etc.)
Visualization Options
Cartoon representation
Sticks representation
Spheres representation
Steps involved in PyMOL:
Step 1: Installation
• Download PyMOL.
• Install (e.g., Python, OpenGL).
Step 2: Launching PyMOL
• 3D visualization window
Step 3: Loading Molecules
• Open a molecular structure file (e.g., PDB, CIF, MOL2):
• File > OpenDrag-and-drop file into PyMOL window
• Select molecule format (e.g., PDB, CIF):
• File > Open > Format
Step 4: Visualization
• Rotate, zoom, and translate molecule:
• Change representation:
• Cartoon
• Sticks
Step 5: Selection and Labeling
• Select atoms, residues, or chains:
• Label selected atoms, residues, or chains
Step 6: Measurements and Calculations
• Measure distances, angles, and torsions:
• Calculate molecular surface area and volume:
Step 7: Structure Analysis
• Analyze secondary structure:
• Tools > Secondary Structure
• Detect hydrogen bonds and salt bridges:
• Tools > Hydrogen Bonds/Salt Bridges
Step 8: Scripting and Automation
• Write scripts using PyMOL command language (PyMOL CLI):
• Command line
Step 9: Saving and Exporting
• Save molecular structure:
• File > Save
• Export images and movies:
• File > Export
RasMol
• RasMol is a molecular graphics program intended for the visualisation of proteins,
nucleic acids and small molecules.
• The program has been developed at the University of Edinburgh's Biocomputing
Research Unit and the Biomolecular Structure Department at Glaxo Research and
Development, Greenford, UK.
Features of RasMOL
• Molecular visualization
• Structure manipulation (rotating, zooming, translating)
• Selection and labeling of atoms, residues, and chains
• Support for various file formats (PDB, CIF, MOL2, SDF, etc.)
File Formats
• PDB (Protein Data Bank)
• CIF (Crystallographic Information File)
• SDF (Structure Data File)
Steps involved in RasMol:
Step 1: Installation
• Follow installation instructions for your operating system (Windows, macOS, or
Linux).
Step 2: Launching RasMol
• Open RasMol on your computer.
• 3D visualization window
Step 3: Loading Molecules
• Open a molecular structure file (e.g., PDB, CIF, MOL2)
• Drag-and-drop file into RasMol window
Step 4: Visualization
• Rotate, zoom, and translate molecule
• Change representation(ball,stick,cartoon)
Step 5: Selection and Labeling
• Select atoms, residues, or chains:
• Label selected atoms, residues, or chains:
Step 6: Measurements and Calculations
• Measure distances, angles, and torsions:
• Calculate molecular surface area and volume:
Step 7: Structure Analysis
• Analyze secondary structure:
• Tools > Secondary Structure
• Detect hydrogen bonds and salt bridges:
• Tools > Hydrogen Bonds/Salt Bridges
Step8: Scripting and Automation
• Write scripts using RasMol command language:
• Command line
• Use external scripts and plugins:
• Script Editor
Step 9: Saving and Exporting
• Save molecular structure
• Export images and movies
UCSF CHIMERA:
Definition:
• UCSF Chimera is a free, open-source molecular visualization and analysis
software tool for displaying, manipulating, and analyzing molecular structures.
• Particularly visualize proteins, nucleic acids, and other biomolecules.
Features:
• Molecular visualization
• Measurements and calculations
• Structure analysis
• Scripting and automation
Developed by:
• Resource for Biocomputing, Visualization, and Informatics (RBVI), University of
California, San Francisco (UCSF)
steps to use UCSF Chimera:
Step 1: Installation
Download UCSF Chimera
Step 2: Launching Chimera
- 3D visualization window
- Command line interface (CLI)
Step 3: Loading Molecules
1. Open a molecular structure file
- Drag-and-drop file into Chimera window
2. Select the molecule format (e.g., PDB, CIF)
Step 5: Selection and Labeling
Select atoms, residues, or chains:
- Mouse selection
- Command line
Label selected atoms, residues, or chains:
Step 6: Measurements and Calculations
Measure distances, angles, and torsions:
2 Calculate molecular surface area and volume:
Step 7: Structure Analysis
Analyze secondary structure:
Tools > Secondary Structure
Detect hydrogen bonds and salt bridges:
- Tools > Hydrogen Bonds/Salt Bridges
Step 8: Scripting and Automation
- Command line
THANK YOU

PROTEIN STRUCTURE VISUALIZATION AND COMPARISION S. Madhumitha 123011356021

  • 1.
    PROTEIN STRUCTURE VISUALIZATION ANDCOMPARISION SUBMITTED TO: Ms.P.MALA Assistant professor Department of biotechnology PMIST SUBMITTED BY; MADHUMITHA .S ll-M.Sc Biotechnology Computational biology
  • 2.
    Protein structure visualization Proteinstructure visualization tools are software applications that allow users to view, manipulate, and analyze the three-dimensional (3D) structures of proteins and other biomolecules. These tools are essential for understanding the; • molecular architecture, • function, and interactions of proteins, • designing new drugs and vaccines. There are many protein structure visualization tools available, each with different features, capabilities, and limitation.
  • 3.
    Various types oftools are used in protein structure visualization: It includes; PyMOL RasMol CHIMERA PyMOL • PyMOL is a popular and powerful molecular graphics software. • Editing, and analyzing 3D structures of proteins and other biomolecules. • PyMOL is written in Python and C, and can be extended and customized with Python scripts and plugins.
  • 4.
    Features of PyMOL: Molecularvisualization Structure manipulation (rotating, zooming, translating) Selection and labeling of atoms, residues, and chains Molecular surface and volume calculations Support for various file formats (PDB, CIF, MOL2, SDF, etc.) Visualization Options Cartoon representation Sticks representation Spheres representation
  • 5.
    Steps involved inPyMOL: Step 1: Installation • Download PyMOL. • Install (e.g., Python, OpenGL). Step 2: Launching PyMOL • 3D visualization window Step 3: Loading Molecules • Open a molecular structure file (e.g., PDB, CIF, MOL2): • File > OpenDrag-and-drop file into PyMOL window • Select molecule format (e.g., PDB, CIF): • File > Open > Format
  • 6.
    Step 4: Visualization •Rotate, zoom, and translate molecule: • Change representation: • Cartoon • Sticks Step 5: Selection and Labeling • Select atoms, residues, or chains: • Label selected atoms, residues, or chains Step 6: Measurements and Calculations • Measure distances, angles, and torsions: • Calculate molecular surface area and volume:
  • 7.
    Step 7: StructureAnalysis • Analyze secondary structure: • Tools > Secondary Structure • Detect hydrogen bonds and salt bridges: • Tools > Hydrogen Bonds/Salt Bridges Step 8: Scripting and Automation • Write scripts using PyMOL command language (PyMOL CLI): • Command line Step 9: Saving and Exporting • Save molecular structure: • File > Save • Export images and movies: • File > Export
  • 8.
    RasMol • RasMol isa molecular graphics program intended for the visualisation of proteins, nucleic acids and small molecules. • The program has been developed at the University of Edinburgh's Biocomputing Research Unit and the Biomolecular Structure Department at Glaxo Research and Development, Greenford, UK. Features of RasMOL • Molecular visualization • Structure manipulation (rotating, zooming, translating) • Selection and labeling of atoms, residues, and chains • Support for various file formats (PDB, CIF, MOL2, SDF, etc.)
  • 9.
    File Formats • PDB(Protein Data Bank) • CIF (Crystallographic Information File) • SDF (Structure Data File) Steps involved in RasMol: Step 1: Installation • Follow installation instructions for your operating system (Windows, macOS, or Linux). Step 2: Launching RasMol • Open RasMol on your computer. • 3D visualization window
  • 10.
    Step 3: LoadingMolecules • Open a molecular structure file (e.g., PDB, CIF, MOL2) • Drag-and-drop file into RasMol window Step 4: Visualization • Rotate, zoom, and translate molecule • Change representation(ball,stick,cartoon) Step 5: Selection and Labeling • Select atoms, residues, or chains: • Label selected atoms, residues, or chains: Step 6: Measurements and Calculations • Measure distances, angles, and torsions: • Calculate molecular surface area and volume:
  • 11.
    Step 7: StructureAnalysis • Analyze secondary structure: • Tools > Secondary Structure • Detect hydrogen bonds and salt bridges: • Tools > Hydrogen Bonds/Salt Bridges Step8: Scripting and Automation • Write scripts using RasMol command language: • Command line • Use external scripts and plugins: • Script Editor Step 9: Saving and Exporting • Save molecular structure • Export images and movies
  • 12.
    UCSF CHIMERA: Definition: • UCSFChimera is a free, open-source molecular visualization and analysis software tool for displaying, manipulating, and analyzing molecular structures. • Particularly visualize proteins, nucleic acids, and other biomolecules. Features: • Molecular visualization • Measurements and calculations • Structure analysis • Scripting and automation
  • 13.
    Developed by: • Resourcefor Biocomputing, Visualization, and Informatics (RBVI), University of California, San Francisco (UCSF) steps to use UCSF Chimera: Step 1: Installation Download UCSF Chimera Step 2: Launching Chimera - 3D visualization window - Command line interface (CLI) Step 3: Loading Molecules 1. Open a molecular structure file - Drag-and-drop file into Chimera window 2. Select the molecule format (e.g., PDB, CIF)
  • 14.
    Step 5: Selectionand Labeling Select atoms, residues, or chains: - Mouse selection - Command line Label selected atoms, residues, or chains: Step 6: Measurements and Calculations Measure distances, angles, and torsions: 2 Calculate molecular surface area and volume: Step 7: Structure Analysis Analyze secondary structure: Tools > Secondary Structure Detect hydrogen bonds and salt bridges: - Tools > Hydrogen Bonds/Salt Bridges Step 8: Scripting and Automation - Command line
  • 15.