Downloaded 158 times
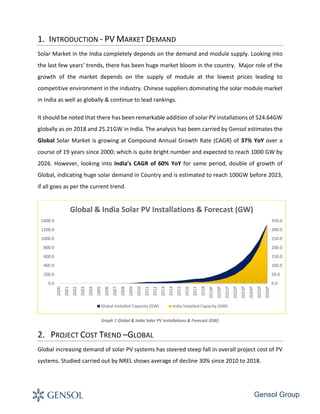
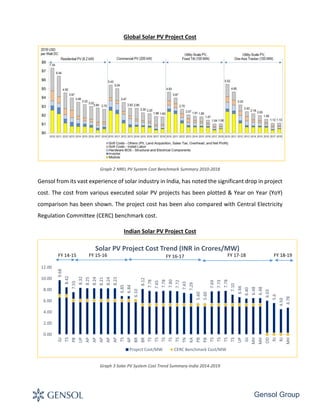

The Gensol Group white paper discusses the significant growth of the solar PV market in India, highlighting a compound annual growth rate (CAGR) of 60% for the country compared to 37% globally, with expectations to reach 100 GW capacity by 2023. It emphasizes a sharp decline in project costs and solar module prices, dropping by over 71% from September 2013 to January 2019, driven by increased demand and competitive pricing. The report also notes key challenges such as policy implications, currency fluctuations, and the impact of safeguard duties on imported modules affecting the market dynamics.


