Download to read offline


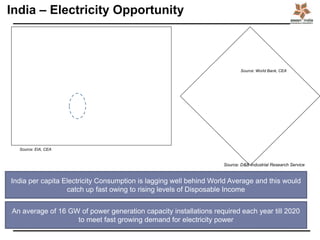
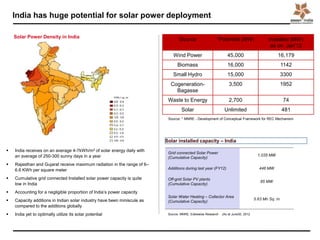
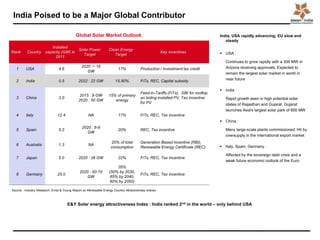
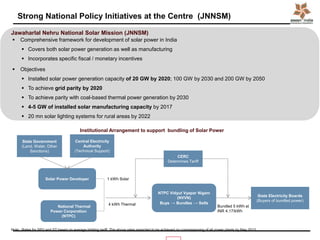
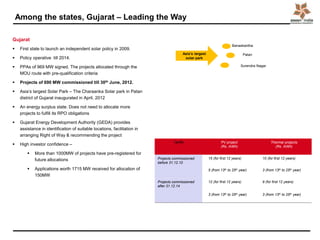
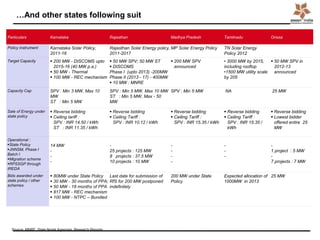
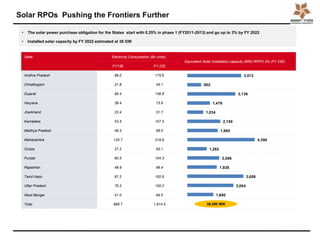
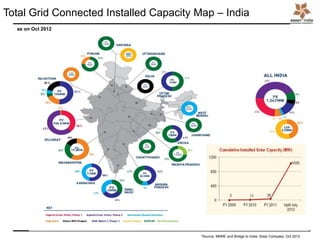
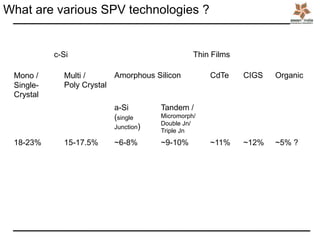
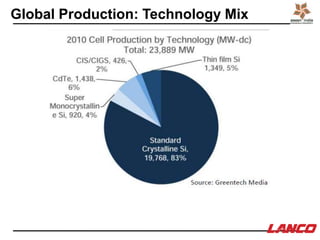
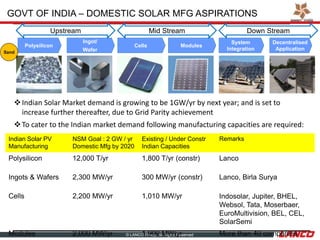
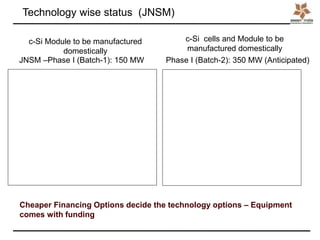
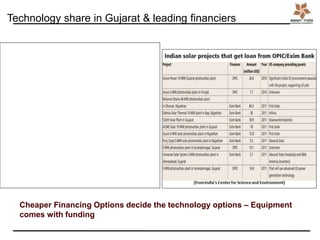


This document summarizes solar power technology and development in India. It discusses India's growing electricity demand and potential for solar power given its solar resources. India's cumulative solar installations have reached over 1 GW but account for a negligible proportion of capacity. Several states like Gujarat and Rajasthan are leading in solar development. The Jawaharlal Nehru National Solar Mission aims to achieve 20 GW of solar capacity by 2022 to meet India's renewable energy targets and achieve grid parity. The document outlines India's domestic solar manufacturing goals and existing production capacities. It also provides an overview of different solar PV technologies and their efficiencies.


