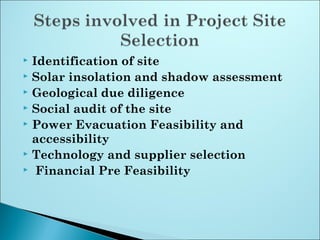
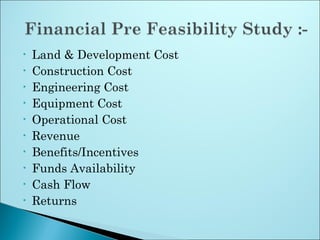
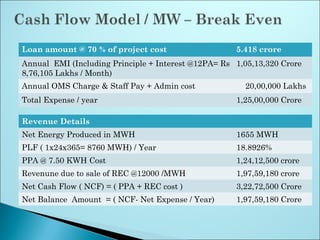
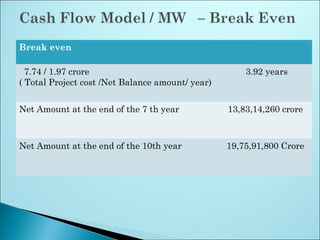
Steps of Site Identification
&
Project Pre-Feasibility
 Identification of site
 Solar insolation and shadow assessment
 Geological due diligence
 Social audit of the site
 Power Evacuation Feasibility and
accessibility
 Technology and supplier selection
 Financial Pre Feasibility
 Land shall be plain and Red soil with
proper rain water drainage provision .
 Near to 33KV SS
 Motor able road
 Following land is not suitable :
 Black Cotton Soil
 Site located near mountain ,Larger Water
Bodies & Shadow over land .
• No of sunny days / sunny hours
• No of Cloudy days & Rainy days
• Relative Humidity & Temperature @ Site
• Direction of Sun Rays falling on the Panel
• Following land is not suitable :
• More dusty Area
• Site located near mountain ,Larger Water
Bodies & Shadow over land .
• As land orientation should preferably be flat,
considerations while identifying site must
include;
• Degree of levelization,
• A drainage system,
• Dust percentage in air
• Land/soil capacity to hold structures.
• Soil Testing Experts/ Geotechnical Engineers
having understanding of soil and land
mechanics.
Review issues related to:-
 Security of the project and the systems,
 Possible threats in terms of security of
employees,
 Availability of labor & local support for the
project.
Review issues related to:-
• Availability of substation for power evacuation
(Nearest- 11/33 KV )
• Availability / provision for Additional Bay @ SS
• Evacuation capacity of the sub-station- to be
checked with distribution  utility.
• Feasibility study of Power Evacuation line of 33
KV from site to SS ( Pole compensation cost)
• Grid to be constructed as per IEGC .
Selection of Solar PV Technology based on -
• Past performance record, Available global
radiation(GHI), Climatic conditions- Specially
temperature and Wind velocity, Cost of technology
(capital and O&M), Projected conversion
efficiency/’s and Consequent projected CUF’s, Risks
associated with the technologies
• Solar Panels – Type
• Mono crystalline , Poly crystalline or Thin film
technology .
• Battery Banks , inverters , PV – DC Cable
connectors , etc .
• Use of specific PV DC cables
• Land & Development Cost
• Construction Cost
• Engineering Cost
• Equipment Cost
• Operational Cost
• Revenue
• Benefits/Incentives
• Funds Availability
• Cash Flow
• Returns
 Radiation at Site
 Losses in PV System
(Invertors ,Cabling, Soiling (Dust), Module
Mismatch , MPPT losses & Transformer)
 Temperature and Climatic condition
 Design Parameters of the Solar Plant
 Inverter efficiency
 Module degradation due to ageing .
 Grid Availability
 Direct Method –
Pyrheliometer & Pyronometer instruments used
@ site to estimate the Solar Radiation
 InDirect method –
Satelite data , NASA ,
Indian Metrological Department ,
 World Radition Data Centre ( WRDC) &
 RET Screen Canadian software - Free of
cost
 Reflection losses due to Sun Path, - Solar rays should
fall perpendicular to panel for higher efficiency – But
actually it may have wider incidence angle due to sun
path – 1 % loss expected .
 Soiling losses due to dust , SNOW etc – 1 % loss
 Mis Match effect losses- due to interconnection of Solar
Panels in series & parallel – Good quality panel to be
procured .
 MPPT ( Max Power Point Tracking) Losses - due to
Changes in direction of sun , changes in solar
insolations level with varying Temp
 Inverter Efficiency depends upon Conversion of DC to
AC – 96 to 98.5% .
 Cabling losses due to improper joints etc .
 Transformer losses.
 Proper selection of Modules
 Optimum angle of tilt
 Minimisation of Ohmic losess with proper
selection of conductors .
 Selection of Efficient Transformers & Inverters
Energy output depends upon
- Temperature of the module decrease the output
- Intensity of lights
- Sun lights reflection on the surface but not on
the modules
- Defuse light - Changes in Sun spectrum in the
day/ year , due to clouds, smoky, fogs etc
- Materials used in Modules – Amorphous Silicon
performance changes with aging
 Mounting position of modules & Air circluation
 Inclination Angle - Tilting position of modules –
Fixed type- Non Tracking system
 Performance changes with aging .
 Temp Co Efficient –Changes in power out put
with Different Temp
 Typical value of Temp co efficient
Y( P mpp) Crystaline Modules -0.4 to 0.45 % K
Y( P mpp) Amorphous Modules -0.2 to 0.23 % K
Y( P mpp) CdTe Modules -0.24 to 0.25 % K
Thin film modules can give higher performance
@ Elevated Temp compare to Crystaline silicon.
 Module degradation occurs to Sun light
 - Slow Breakdown of Module encapsulant
( Ethelene Vinyl Acetate EVA & Back sheet
Polyvinyl Flouride Films )
 Moisture ingress leads to corrosion formation on
Cable connectors and decreased voltage outputs
 UV rays breaks down the EVA layer between
Module Front Glass and silicon cells – Silicon cells
outputs gets affected .
 Discoloration of Panels .
 Degradation of silicon cells – Metastable Dangling
bonds – 15 to 20 % reduction in efficiency .
Sl No Description Life in
Years
Remarks
1 Module 30
2 Inverter 15 Small plant
30 10% Parts replacement 2 Every 10
years
3 Structure 30 Roof Top
30 to 60 Ground mounted fixed in metal
4 Cabling 30
After 10 years – 90 % & After 20 Years -80 % efficiency noticed in modules
First 03 years of Operations No reduction in designed power output and then
Yearly reduction of power output is 0.5 %
 Software available –
RETScreen (Free of cost), PVSyst23, Homer
 Following analysis can be done :-
-Energy Analysis
-Emission Analysis
-Cost Analysis
-Financial Analysis
-Sensitivity / risk Analysis
 Performance of CUF depends upon :-
 Solar Radiation
 Temperature
 Air velocity
 Module type and materials used
 Quality of Module & cable joints etc
 Efficiency of Inverter &Transformer
 Thin Film Modules most suitable higher ambient
temp area . ( CUF around 19 to 20%)
 To compensate degradation loss after 3 years add
5 KW module / MW in every year.
Sl No Description Cost In Crore % of Cost
1 Solar PV Modules 4.51 58.2687339
2 Solar Invertors 1.166 15.0645995
3 Transformers 0.294 3.79844961
4 Protective devices 0.12 1.5503876
5 Wire/cables 0.1 1.29198966
6 SCADA/RMS 0.1 1.29198966
7 Project Execution & Comm 0.2 2.58397933
8 Construction cost 0.4 5.16795866
9
Grid Evacuation
@ 15 L /Km x 5 KM 0.75 9.68992248
10 Other official works 0.1 1.29198966
7.74 100
Loan amount @ 70 % of project cost 5.418 crore
Annual EMI (Including Principle + Interest @12PA= Rs
8,76,105 Lakhs / Month)
1,05,13,320 Crore
Annual OMS Charge & Staff Pay + Admin cost 20,00,000 Lakhs
Total Expense / year 1,25,00,000 Crore
Revenue Details
Net Energy Produced in MWH 1655 MWH
PLF ( 1x24x365= 8760 MWH) / Year 18.8926%
PPA @ 7.50 KWH Cost 1,24,12,500 crore
Revenune due to sale of REC @12000 /MWH 1,97,59,180 crore
Net Cash Flow ( NCF) = ( PPA + REC cost ) 3,22,72,500 Crore
Net Balance Amount = ( NCF- Net Expense / Year) 1,97,59,180 Crore
Break even
7.74 / 1.97 crore
( Total Project cost /Net Balance amount/ year)
3.92 years
Net Amount at the end of the 7 th year 13,83,14,260 crore
Net Amount at the end of the 10th year 19,75,91,800 Crore
Solar Power Plant cash flow model

Solar Power Plant cash flow model

  • 1.
    Steps of SiteIdentification & Project Pre-Feasibility
  • 5.
     Identification ofsite  Solar insolation and shadow assessment  Geological due diligence  Social audit of the site  Power Evacuation Feasibility and accessibility  Technology and supplier selection  Financial Pre Feasibility
  • 6.
     Land shallbe plain and Red soil with proper rain water drainage provision .  Near to 33KV SS  Motor able road  Following land is not suitable :  Black Cotton Soil  Site located near mountain ,Larger Water Bodies & Shadow over land .
  • 7.
    • No ofsunny days / sunny hours • No of Cloudy days & Rainy days • Relative Humidity & Temperature @ Site • Direction of Sun Rays falling on the Panel • Following land is not suitable : • More dusty Area • Site located near mountain ,Larger Water Bodies & Shadow over land .
  • 8.
    • As landorientation should preferably be flat, considerations while identifying site must include; • Degree of levelization, • A drainage system, • Dust percentage in air • Land/soil capacity to hold structures. • Soil Testing Experts/ Geotechnical Engineers having understanding of soil and land mechanics.
  • 9.
    Review issues relatedto:-  Security of the project and the systems,  Possible threats in terms of security of employees,  Availability of labor & local support for the project.
  • 10.
    Review issues relatedto:- • Availability of substation for power evacuation (Nearest- 11/33 KV ) • Availability / provision for Additional Bay @ SS • Evacuation capacity of the sub-station- to be checked with distribution  utility. • Feasibility study of Power Evacuation line of 33 KV from site to SS ( Pole compensation cost) • Grid to be constructed as per IEGC .
  • 11.
    Selection of SolarPV Technology based on - • Past performance record, Available global radiation(GHI), Climatic conditions- Specially temperature and Wind velocity, Cost of technology (capital and O&M), Projected conversion efficiency/’s and Consequent projected CUF’s, Risks associated with the technologies • Solar Panels – Type • Mono crystalline , Poly crystalline or Thin film technology . • Battery Banks , inverters , PV – DC Cable connectors , etc . • Use of specific PV DC cables
  • 12.
    • Land &Development Cost • Construction Cost • Engineering Cost • Equipment Cost • Operational Cost • Revenue • Benefits/Incentives • Funds Availability • Cash Flow • Returns
  • 13.
     Radiation atSite  Losses in PV System (Invertors ,Cabling, Soiling (Dust), Module Mismatch , MPPT losses & Transformer)  Temperature and Climatic condition  Design Parameters of the Solar Plant  Inverter efficiency  Module degradation due to ageing .  Grid Availability
  • 14.
     Direct Method– Pyrheliometer & Pyronometer instruments used @ site to estimate the Solar Radiation  InDirect method – Satelite data , NASA , Indian Metrological Department ,  World Radition Data Centre ( WRDC) &  RET Screen Canadian software - Free of cost
  • 15.
     Reflection lossesdue to Sun Path, - Solar rays should fall perpendicular to panel for higher efficiency – But actually it may have wider incidence angle due to sun path – 1 % loss expected .  Soiling losses due to dust , SNOW etc – 1 % loss  Mis Match effect losses- due to interconnection of Solar Panels in series & parallel – Good quality panel to be procured .  MPPT ( Max Power Point Tracking) Losses - due to Changes in direction of sun , changes in solar insolations level with varying Temp  Inverter Efficiency depends upon Conversion of DC to AC – 96 to 98.5% .  Cabling losses due to improper joints etc .  Transformer losses.
  • 16.
     Proper selectionof Modules  Optimum angle of tilt  Minimisation of Ohmic losess with proper selection of conductors .  Selection of Efficient Transformers & Inverters Energy output depends upon - Temperature of the module decrease the output - Intensity of lights - Sun lights reflection on the surface but not on the modules - Defuse light - Changes in Sun spectrum in the day/ year , due to clouds, smoky, fogs etc - Materials used in Modules – Amorphous Silicon performance changes with aging
  • 17.
     Mounting positionof modules & Air circluation  Inclination Angle - Tilting position of modules – Fixed type- Non Tracking system  Performance changes with aging .  Temp Co Efficient –Changes in power out put with Different Temp  Typical value of Temp co efficient Y( P mpp) Crystaline Modules -0.4 to 0.45 % K Y( P mpp) Amorphous Modules -0.2 to 0.23 % K Y( P mpp) CdTe Modules -0.24 to 0.25 % K Thin film modules can give higher performance @ Elevated Temp compare to Crystaline silicon.
  • 18.
     Module degradationoccurs to Sun light  - Slow Breakdown of Module encapsulant ( Ethelene Vinyl Acetate EVA & Back sheet Polyvinyl Flouride Films )  Moisture ingress leads to corrosion formation on Cable connectors and decreased voltage outputs  UV rays breaks down the EVA layer between Module Front Glass and silicon cells – Silicon cells outputs gets affected .  Discoloration of Panels .  Degradation of silicon cells – Metastable Dangling bonds – 15 to 20 % reduction in efficiency .
  • 19.
    Sl No DescriptionLife in Years Remarks 1 Module 30 2 Inverter 15 Small plant 30 10% Parts replacement 2 Every 10 years 3 Structure 30 Roof Top 30 to 60 Ground mounted fixed in metal 4 Cabling 30 After 10 years – 90 % & After 20 Years -80 % efficiency noticed in modules First 03 years of Operations No reduction in designed power output and then Yearly reduction of power output is 0.5 %
  • 20.
     Software available– RETScreen (Free of cost), PVSyst23, Homer  Following analysis can be done :- -Energy Analysis -Emission Analysis -Cost Analysis -Financial Analysis -Sensitivity / risk Analysis
  • 21.
     Performance ofCUF depends upon :-  Solar Radiation  Temperature  Air velocity  Module type and materials used  Quality of Module & cable joints etc  Efficiency of Inverter &Transformer  Thin Film Modules most suitable higher ambient temp area . ( CUF around 19 to 20%)  To compensate degradation loss after 3 years add 5 KW module / MW in every year.
  • 22.
    Sl No DescriptionCost In Crore % of Cost 1 Solar PV Modules 4.51 58.2687339 2 Solar Invertors 1.166 15.0645995 3 Transformers 0.294 3.79844961 4 Protective devices 0.12 1.5503876 5 Wire/cables 0.1 1.29198966 6 SCADA/RMS 0.1 1.29198966 7 Project Execution & Comm 0.2 2.58397933 8 Construction cost 0.4 5.16795866 9 Grid Evacuation @ 15 L /Km x 5 KM 0.75 9.68992248 10 Other official works 0.1 1.29198966 7.74 100
  • 23.
    Loan amount @70 % of project cost 5.418 crore Annual EMI (Including Principle + Interest @12PA= Rs 8,76,105 Lakhs / Month) 1,05,13,320 Crore Annual OMS Charge & Staff Pay + Admin cost 20,00,000 Lakhs Total Expense / year 1,25,00,000 Crore Revenue Details Net Energy Produced in MWH 1655 MWH PLF ( 1x24x365= 8760 MWH) / Year 18.8926% PPA @ 7.50 KWH Cost 1,24,12,500 crore Revenune due to sale of REC @12000 /MWH 1,97,59,180 crore Net Cash Flow ( NCF) = ( PPA + REC cost ) 3,22,72,500 Crore Net Balance Amount = ( NCF- Net Expense / Year) 1,97,59,180 Crore
  • 24.
    Break even 7.74 /1.97 crore ( Total Project cost /Net Balance amount/ year) 3.92 years Net Amount at the end of the 7 th year 13,83,14,260 crore Net Amount at the end of the 10th year 19,75,91,800 Crore