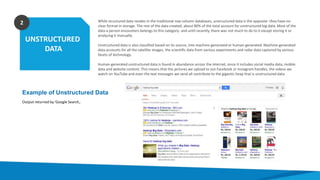
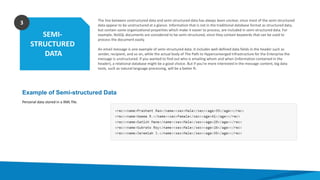
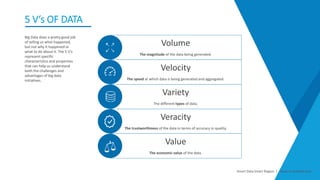
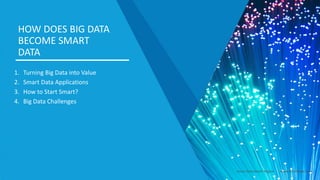
This document provides an overview of big and smart data. It begins with a brief history of data, from tally sticks used by early humans to track supplies to modern digital storage. It then defines the key terms "big data" and "smart data," and explains how big data can be transformed into smart data through analysis. The document aims to help readers understand the emerging role of data, classify different types of data, and know how to start using data intelligently.
Many believe Big Data is a brand new phenomenon. It isn't, it is part of an evolution that reaches far back history. Here are some of the key milestones in this development.
Big Data - Yesterday, Today and Tomorrow by John Mashey, TechviserAngela Hey
A history of Big Data by Dr John Mashey. It discusses 1890 census data, IBM mainframes, DEC minicomputer clusters, Silicon Graphics (SGI) applications and a history of Open Source computing.
Qu'est ce que le Big Data ? Avec Victoria Galano Data Scientist chez Air FranceJedha Bootcamp
Depuis les 5 dernières années, nous avons créé plus de données que depuis les débuts de l'humanité. Nous produisons aujourd'hui tellement de données qu'il devient difficile de les gérer. C'est ce qu'on appelle le Big Data. Durant ce workshop nous parlerons des enjeux du Big Data et de ses applications concrètes dans notre société.
You're traveling through another dimension, a dimension not only of sight and sound but of data; a journey into a wondrous land whose boundaries are that of the imagination. In this talk we will learn the relationship between Big Data, Artificial Intelligence, and Augmented Reality. We'll discuss the past, present and futures of these technologies to determine if we are heading towards paradise or into the twilight zone.
Big data & Hadoop & How we use it at AlchetronPaul Jr.
The presentation explores how we reached at big data today and technologies like hadoop which are used to manage it The presentation ends with where we use it in our startup Alchetron.com & some more Informative links at the end
Brief History Of Computer. The computer as we know it today had its beginning with a 19th century English mathematics professor name Charles Babbage. He designed the Analytical Engine and it was this design that the basic framework of the computers of today are based on. ... It was called the Atanasoff-Berry Computer (ABC) .
The Management Accountant in a Digital World The interface of strategy, tech...Workiva
In an era of digitalization of data processes, the management accounting profession has the potential to count even more. They interpret big data and exercise judgement. This presentation will explore new and emerging information technology trends that can help the management accounting profession take a leadership role within their organization by exploring the interface of strategy, emerging information technologies, and of cost information. We will further explore how the management accountant can apply emerging information technology to maximise the value of information while minimising the costs and risks of holding it.
Science, Technology and Society: The information age. All about the improvements of technology, how technology evolved, how science helped the technology and the society. And also how the life of the society makes easier because of science and technology. Science and Technology’s impact in todays world.
Data: A Timeline - How Data Came To Rule The WorldRibbonfish
Data: A Timeline - How Data Came To Rule The World
At Ribbonfish, we work with data all the time. Organisations use data to understand their customers, test new products, manage processes, and much more. This presentation looks at the timeline of how data came to such importance in this noisy world.
Over 23 million software developers in 2018, this
number is expected to reach 26.4 million by the end of 2019 and
27.7 million by 2023 according to Evans Data Corporation. The
number of programmers continues to grow to this day as
technology is the Forthcoming, especially in the AI field. Where
there are 300,000 “AI researchers and practitioners” in the world,
but the market demand is for millions of roles, so many people
Siding to this field. Nowadays, most people learn the
programming field as inquisitiveness but for their interest,
however, they delve deeper into this field, which enhances their
passion for and leaves their work to practice programming as
occupation due to the availability of jobs and the most request for
it. Over time, new languages have emerged, it has evolved to
meet human needs in the form of programming languages. You
can instruct the computer in the human-readable form where
programming will enable you to learn the significance of clarity
of expression, many determinations can be achieved,
importantly, relationships, semantics, and grammar can be
defined.
The story of how data became big starts many years before the current buzz around big data.The history of Big Data as a term may be brief – but many of the foundations it is built on were laid many years ago. Now, let’s look at a detailed account of the major milestones in the history of sizing data volumes in the evolution of the idea of “big data” and observations pertaining to data or information explosion:
History of Internet
History Of Internet On The World
The Internet : The History Of The Internet
Internet Report
The History Of The Internet
History Of The Internet Essay example
The Discovery Of The Internet
History of Internet Essay examples
History of the Internet Essay examples
The History Of The Internet Essay
The Internet and Technology Essay
The History and Development of the Internet
The Birth Of The Internet
The History Of Social Media
The Birth Of The Internet
History Of The Internet Essay
The Internet : The Origin Of The Internet
Computer Applications and its use in Dentistry.pptxriturandad
Hospital information systems, data analysis in medicine/dentistry, dental imagining laboratory computing, computer aided medical/dental decision making, care of critically sick patients, computer-assisted therapy, and other applications are major uses of computers in dentistry
Operation “Blue Star” is the only event in the history of Independent India where the state went into war with its own people. Even after about 40 years it is not clear if it was culmination of states anger over people of the region, a political game of power or start of dictatorial chapter in the democratic setup.
The people of Punjab felt alienated from main stream due to denial of their just demands during a long democratic struggle since independence. As it happen all over the word, it led to militant struggle with great loss of lives of military, police and civilian personnel. Killing of Indira Gandhi and massacre of innocent Sikhs in Delhi and other India cities was also associated with this movement.
Instructions for Submissions thorugh G- Classroom.pptxJheel Barad
This presentation provides a briefing on how to upload submissions and documents in Google Classroom. It was prepared as part of an orientation for new Sainik School in-service teacher trainees. As a training officer, my goal is to ensure that you are comfortable and proficient with this essential tool for managing assignments and fostering student engagement.
Acetabularia Information For Class 9 .docxvaibhavrinwa19
Acetabularia acetabulum is a single-celled green alga that in its vegetative state is morphologically differentiated into a basal rhizoid and an axially elongated stalk, which bears whorls of branching hairs. The single diploid nucleus resides in the rhizoid.
Synthetic Fiber Construction in lab .pptxPavel ( NSTU)
Synthetic fiber production is a fascinating and complex field that blends chemistry, engineering, and environmental science. By understanding these aspects, students can gain a comprehensive view of synthetic fiber production, its impact on society and the environment, and the potential for future innovations. Synthetic fibers play a crucial role in modern society, impacting various aspects of daily life, industry, and the environment. ynthetic fibers are integral to modern life, offering a range of benefits from cost-effectiveness and versatility to innovative applications and performance characteristics. While they pose environmental challenges, ongoing research and development aim to create more sustainable and eco-friendly alternatives. Understanding the importance of synthetic fibers helps in appreciating their role in the economy, industry, and daily life, while also emphasizing the need for sustainable practices and innovation.
Model Attribute Check Company Auto PropertyCeline George
In Odoo, the multi-company feature allows you to manage multiple companies within a single Odoo database instance. Each company can have its own configurations while still sharing common resources such as products, customers, and suppliers.
A Strategic Approach: GenAI in EducationPeter Windle
Artificial Intelligence (AI) technologies such as Generative AI, Image Generators and Large Language Models have had a dramatic impact on teaching, learning and assessment over the past 18 months. The most immediate threat AI posed was to Academic Integrity with Higher Education Institutes (HEIs) focusing their efforts on combating the use of GenAI in assessment. Guidelines were developed for staff and students, policies put in place too. Innovative educators have forged paths in the use of Generative AI for teaching, learning and assessments leading to pockets of transformation springing up across HEIs, often with little or no top-down guidance, support or direction.
This Gasta posits a strategic approach to integrating AI into HEIs to prepare staff, students and the curriculum for an evolving world and workplace. We will highlight the advantages of working with these technologies beyond the realm of teaching, learning and assessment by considering prompt engineering skills, industry impact, curriculum changes, and the need for staff upskilling. In contrast, not engaging strategically with Generative AI poses risks, including falling behind peers, missed opportunities and failing to ensure our graduates remain employable. The rapid evolution of AI technologies necessitates a proactive and strategic approach if we are to remain relevant.
June 3, 2024 Anti-Semitism Letter Sent to MIT President Kornbluth and MIT Cor...Levi Shapiro
Letter from the Congress of the United States regarding Anti-Semitism sent June 3rd to MIT President Sally Kornbluth, MIT Corp Chair, Mark Gorenberg
Dear Dr. Kornbluth and Mr. Gorenberg,
The US House of Representatives is deeply concerned by ongoing and pervasive acts of antisemitic
harassment and intimidation at the Massachusetts Institute of Technology (MIT). Failing to act decisively to ensure a safe learning environment for all students would be a grave dereliction of your responsibilities as President of MIT and Chair of the MIT Corporation.
This Congress will not stand idly by and allow an environment hostile to Jewish students to persist. The House believes that your institution is in violation of Title VI of the Civil Rights Act, and the inability or
unwillingness to rectify this violation through action requires accountability.
Postsecondary education is a unique opportunity for students to learn and have their ideas and beliefs challenged. However, universities receiving hundreds of millions of federal funds annually have denied
students that opportunity and have been hijacked to become venues for the promotion of terrorism, antisemitic harassment and intimidation, unlawful encampments, and in some cases, assaults and riots.
The House of Representatives will not countenance the use of federal funds to indoctrinate students into hateful, antisemitic, anti-American supporters of terrorism. Investigations into campus antisemitism by the Committee on Education and the Workforce and the Committee on Ways and Means have been expanded into a Congress-wide probe across all relevant jurisdictions to address this national crisis. The undersigned Committees will conduct oversight into the use of federal funds at MIT and its learning environment under authorities granted to each Committee.
• The Committee on Education and the Workforce has been investigating your institution since December 7, 2023. The Committee has broad jurisdiction over postsecondary education, including its compliance with Title VI of the Civil Rights Act, campus safety concerns over disruptions to the learning environment, and the awarding of federal student aid under the Higher Education Act.
• The Committee on Oversight and Accountability is investigating the sources of funding and other support flowing to groups espousing pro-Hamas propaganda and engaged in antisemitic harassment and intimidation of students. The Committee on Oversight and Accountability is the principal oversight committee of the US House of Representatives and has broad authority to investigate “any matter” at “any time” under House Rule X.
• The Committee on Ways and Means has been investigating several universities since November 15, 2023, when the Committee held a hearing entitled From Ivory Towers to Dark Corners: Investigating the Nexus Between Antisemitism, Tax-Exempt Universities, and Terror Financing. The Committee followed the hearing with letters to those institutions on January 10, 202
Palestine last event orientationfvgnh .pptxRaedMohamed3
An EFL lesson about the current events in Palestine. It is intended to be for intermediate students who wish to increase their listening skills through a short lesson in power point.
2024.06.01 Introducing a competency framework for languag learning materials ...Sandy Millin
http://sandymillin.wordpress.com/iateflwebinar2024
Published classroom materials form the basis of syllabuses, drive teacher professional development, and have a potentially huge influence on learners, teachers and education systems. All teachers also create their own materials, whether a few sentences on a blackboard, a highly-structured fully-realised online course, or anything in between. Despite this, the knowledge and skills needed to create effective language learning materials are rarely part of teacher training, and are mostly learnt by trial and error.
Knowledge and skills frameworks, generally called competency frameworks, for ELT teachers, trainers and managers have existed for a few years now. However, until I created one for my MA dissertation, there wasn’t one drawing together what we need to know and do to be able to effectively produce language learning materials.
This webinar will introduce you to my framework, highlighting the key competencies I identified from my research. It will also show how anybody involved in language teaching (any language, not just English!), teacher training, managing schools or developing language learning materials can benefit from using the framework.
Introduction to AI for Nonprofits with Tapp NetworkTechSoup
Dive into the world of AI! Experts Jon Hill and Tareq Monaur will guide you through AI's role in enhancing nonprofit websites and basic marketing strategies, making it easy to understand and apply.
Module 1 Introduction to Big and Smart Data- Online
1. D: DRIVE
How to become Data Driven?
This programme has been funded with
support from the European Commission
Module 1. Introduction to Big and Smart Data
2. Smart Data Smart Region | www.smartdata.how
This programme has been funded with support from the European Commission. The author is
solely responsible for this publication (communication) and the Commission accepts no
responsibility for any use that may be made of the information contained therein.
The objective of this module is to provide an overview of
the basic information on big and smart data.
Upon completion of this module you will:
- Comprehend the emerging role of big data
- Understand the key terms regarding big and smart data
- Know how big data can be turned into smart data
- Be able to apply the key terms regarding big and smart
data
Duration of the module: approximately 1 – 2 hours
Module 1.
Introduction
to Big and Smart
Data
3. The emerging role of data in VET and enterprise1
V‘s of data2
How does big data become smart data?3
Smart Data Smart Region | www.smartdata.how
This programme has been funded with support from the European Commission. The author is
solely responsible for this publication (communication) and the Commission accepts no
responsibility for any use that may be made of the information contained therein.
– A Brief History of Data
– What is Big Data?
– Sources of Data
– The Importance of Big Data
– Turning Big Data into Value
– Smart Data Applications
– How to Start Smart?
– Big Data Challenges
4. 1. A Brief History of Data
2. What is Big Data?
3. Classification of Data
4. Sources of Data
5. The Importance of Big Data
THE EMERGING ROLE
OF DATA IN VET AND
ENTERPRISE
5. Smart Data Smart Region | www.smartdata.how
A BRIEF HISTORY OF DATA
Long before computers (as we know them today) were
commonplace, the idea that we were creating an ever-
expanding body of knowledge ripe for analysis was popular in
academia. Although it might be easy to forget, our increasing
ability to store and analyze information has been a gradual
evolution – although things certainly sped up at the end of the
last century, with the invention of digital storage and the
internet.
Before we dive into the Module 1 it is neccessary to look at
the long history of thought and innovation which have led us
to the dawn of the data age.
6. C 18,000 BCE
The earliest examples we have of
humans storing and analyzing data
are the tally sticks. The Ishango Bone
was discovered in 1960 and is
thought to be one of the earliest
pieces of evidence of prehistoric data
storage. Notches were marked into
sticks or bones, to keep track of
trading activity or supplies. They
would compare sticks and notches to
carry out rudimentary calculations,
enabling them to make predictions
such as how long their food supplies
would last.
C 2400 BCE
The abacus – the first dedicated
device constructed specifically for
performing calculations – comes into
use in Babylon. The first libraries also
appeared around this time,
representing our first attempts at
mass data storage.
300 BC – 48 AD
The Library of Alexandria is perhaps
the largest collection of data in the
ancient world, housing up to half a
million scrolls and covering
everything we had learned so far.
Unfortunately it has been destroyed
by the invading Romans in 48AD .
Contrary to common myth, not
everything was lost – significant parts
of the library’s collections were
moved to other buildings in the city,
or stolen and dispersed throughout
the ancient world.
C 100 – 200 AD
The Antikythera Mechanism, the
earliest discovered mechanical
computer, is produced, presumably
by Greek scientists. It’s “CPU”
consists of 30 interlocking bronze
gears and it is thought to have been
designed for astrological purposes
and tracking the cycle of Olympic
Games. Its design suggests it is
probably an evolution of an earlier
device – but these so far remain
undiscovered.
Ancient History of Data
7. 1663
In London, John Graunt carries out
the first recorded experiment in
statistical data analysis. By recording
information about mortality, he
theorized that he can design an early
warning system for the bubonic
plague ravaging Europe.
1865
The term “business intelligence” is
used by Richard Millar Devens in his
Encyclopedia of Commercial and
Business Anecdotes, describing how
the banker Henry Furnese achieved
an advantage over competitors by
collecting and analyzing information
relevant to his business activities in a
structured manner. This is thought to
be the first study of a business
putting data analysis to use for
commercial purposes.
1880
The US Census Bureau has a problem – it estimates that it will take it 8 years to
crunch all the data collected in the 1880 census, and it is predicted that the
data generated by the 1890 census will take over 10 years, meaning it will not
even be ready to look at until it is outdated by the 1900 census. In 1881 a
young engineer employed by the bureau – Herman Hollerith – produces what
will become known as the Hollerith Tabulating Machine. Using punch cards, he
reduces 10 years’ work to three months and achieves his place in history as the
father of modern automated computation. The company he founds will go on
to become known as IBM.
The Emergence of Statistics
8. 1926
Interviewed by Colliers magazine,
inventor Nikola Tesla states that
when wireless technology is
“perfectly applied the whole Earth
will be converted into a huge brain,
which in fact it is, all things being
particles of a real and rhythmic
whole … and the instruments
through which we shall be able to do
this will be amazingly simple
compared to our present telephone.
A man will be able to carry one in his
vest pocket.”
1928
Fritz Pfleumer, a German-Austrian
engineer, invents a method of storing
information magnetically on tape.
The principles he develops are still in
use today, with the vast majority of
digital data being stored magnetically
on computer hard disks.
1944
Fremont Rider, librarian at Wesleyan University, Connecticut, US, published a
paper titled The Scholar and the Future of the Research Library.
In one of the earliest attempts to quantify the amount of information being
produced, he observes that in order to store all the academic and popular
works of value being produced, American libraries would have to double their
capacity every 16 years. This led him to speculate that the Yale Library, by
2040, will contain 200 million books spread over 6,000 miles of shelves.
The Early Days of Modern Data Storage
9. 1958
IBM researcher Hans
Peter Luhn defines
Business Intelligence
as “the ability to
apprehend the
interrelationships of
presented facts in
such a way as to
guide action towards
a desired goal.”
1962
The first steps are
taken towards speech
recognition, when IBM
engineer William C
Dersch presents the
Shoebox Machine at
the 1962 World Fair. It
can interpret numbers
and sixteen words
spoken in the English
language into digital
information.
1964
An article in the
New Statesman
refers to the
difficulty in
managing the
increasing
amount of
information
becoming
available.
The Beginnings of Business Intelligence The Start of Large Data Centers
1970
IBM mathematician Edgar
F Codd presents his
framework for a
“relational database”. The
model provides the
framework that many
modern data services use
today, to store information
in a hierarchical format,
which can be accessed by
anyone who knows what
they are looking for.
1976
Material
Requirements
Planning (MRP)
systems are
becoming more
commonly used
across the business
world, representing
one of the first
mainstream
commercial uses of
computers to speed
up everyday
processes and make
efficiencies.
1989
Possibly the first use of the
term Big Data in the way it is
used today. International
best-selling author Erik
Larson pens an article for
Harpers Magazine
speculating on the origin of
the junk mail he receives. He
writes: “The keepers of big
data say they are doing it for
the consumer’s benefit. But
data have a way of being
used for purposes other
originally intended.”
10. 1991
Computer scientist Tim
Berners-Lee announced the
birth of what would become
the Internet as we know it
today. In a post in the
Usenet group
alt.hypertext he sets out the
specifications for a
worldwide, interconnected
web of data, accessible to
anyone from anywhere.
1996
According to R J T
Morris and B J
Truskowski in their
2003 book The
Evolution of Storage
Systems, this is the
point where digital
storage became
more cost effective
than paper.
1997
Michael Lesk publishes his paper How Much
Information is there in the World? Theorizing
that the existence of 12,000 petabytes is
“perhaps not an unreasonable guess”. He
also points out that even at this early point in
its development, the web is increasing in size
10-fold each year. Much of this data, he
points out, will never be seen by anyone and
therefore yield no insight.
Google Search also debuts this year – and for
the next 20 years (at least) its name will
become shorthand for searching the internet
for data.
The Emergence of the Internet Early Ideas of Big Data
1999
A couple of years later and the term Big Data
appears in Visually Exploring Gigabyte Datasets in
Real Time, published by the Association for
Computing Machinery. Again the propensity for
storing large amounts of data with no way of
adequately analyzing it is lamented. The paper goes
on to quote computing pioneer Richard W Hamming
as saying: “The purpose of computing is insight, not
numbers.”
Also possibly first use of the term “Internet of
Things”, to describe the growing number of devices
online and the potential for them to communicate
with each other, often without a human “middle
man”.
11. 2000
In How Much Information? Peter
Lyman and Hal Varian (now chief
economist at Google) attempted
to quantify the amount of digital
information in the world, and its
rate of growth, for the first time.
They concluded: “The world’s total
yearly production of print, film,
optical and magnetic content
would require roughly 1.5 billion
gigabytes of storage. This is the
equivalent of 250 megabytes per
person for each man, woman and
child on Earth.”
Early Ideas of Big Data Web 2.0 Increases Data Volumes
2005
Commentators announce that we are witnessing the birth of “Web 2.0” – the
user-generated web where the majority of content will be provided by users
of services, rather than the service providers themselves. This is achieved
through integration of traditional HTML-style web pages with vast back-end
databases built on SQL. 5.5 million people are already using Facebook,
launched a year earlier, to upload and share their own data with friends.
This year also sees the creation of Hadoop – the open source framework
created specifically for storage and analysis of Big Data sets. Its flexibility
makes it particularly useful for managing the unstructured data (voice, video,
raw text etc) which we are increasingly generating and collecting.
2001
In his paper 3D Data Management:
Controlling Data Volume, Velocity and
Variety Doug Laney, analyst at Gartner,
defines three of what will come to be
the commonly-accepted characteristics
of Big Data.
This year also see the first use of the
term “software as a service” – a
concept fundamental to many of the
cloud-based applications which are
industry-standard today – in the article
Strategic Backgrounder: Software as a
Service by the Software and
Information Industry Association.
12. 2008
The world’s servers process
9.57 zettabytes (9.57 trillion
gigabytes) of information –
equivalent to 12 gigabytes of
information per person, per
day), according to the How
Much Information? 2010
report. In International
Production and
Dissemination of
Information, it is estimated
that 14.7 exabyte's of new
information are produced
this year.
Today’s Use of the Term ‘Big Data’ Emerges
2010
Eric Schmidt,
executive chairman
of Google, tells a
conference that as
much data is now
being created
every two days, as
was created from
the beginning of
human civilization
to the year 2003.
2009
The average US company
with over 1,000
employees is storing
more than 200 terabytes
of data according to the
report Big Data: The Next
Frontier for Innovation,
Competition and
Productivity by McKinsey
Global Institute.
2011
The McKinsey report
states that by 2018 the
US will face a shortfall of
between 140,000 and
190,000 professional
data scientists, and
states that issues
including privacy,
security and intellectual
property will have to be
resolved before the full
value of Big Data will be
realized.
2015
Google is the largest big data company in the
world that stores 10 billion gigabytes of data
and processes approximately 3.5 billion
requests every day.
Amazon is the company with the most
number of servers-the 1,000,000,000
gigabytes of big data produced by Amazon
from its 152 million customers is stored on
more than 1,400,000 servers in various data
centres.
13. Big Data is the
foundation of all of the
megatrends that are
happening today, from
social to mobile to the
cloud to gaming.
Chris Lynch
14. There are some things that are so big, that they have
implications for everyone, whether we want it or not. Big
data is one of those things, and it is completely
transforming the way we do business and is impacting
most other parts of our lives.
The basic idea behind the phrase „Big Data“ is that
everything we do is increasingly leaving a digital trace,
which we can use and analyse. Big Data therefore refers to
our ability to make use of the everincreasing volumes of
data.
WHAT IS BIG DATA?
Smart Data Smart Region | www.smartdata.how
„Data of a very large size, typically to
the extent that its manipulation and
management present significant
logistical challenges.“
Oxford English Dictionary, 2013
15. STRUCTURED
DATA
UNSTRUCTURED
DATA
“Data” is defined as ‘the quantities, characters, or symbols on which operations are performed by a computer, which may be stored
and transmitted in the form of electrical signals and recorded on magnetic, optical, or mechanical recording media’, as a quick
google search would show.
The concept of Big Data is nothing complex; as the name suggests, “Big Data” refers to copious amounts of data which are too
large to be processed and analyzed by traditional tools, and the data is not stored or managed efficiently. Since the amount of Big
Data increases exponentially- more than 500 terabytes of data are uploaded to Face book alone, in a single day- it represents a real
problem in terms of analysis.
However, there is also huge potential in the analysis of Big Data. The proper management and study of this data can help
companies make better decisions based on usage statistics and user interests, thereby helping their growth. Some companies have
even come up with new products and services, based on feedback received from Big Data analysis opportunities.
Classification is essential for the study of any subject. So Big Data is widely classified into three main types, which are:
SEMI-
STRUCTURED
DATA
CLASSIFICATION OF DATA
1 2 3
16. STRUCTURED
DATA
1
Structured Data is used to refer to the data which is already stored in databases, in an ordered manner. It accounts for
about 20% of the total existing data, and is used the most in programming and computer-related activities.
There are two sources of structured data- machines and humans. All the data received from sensors, web logs and
financial systems are classified under machine-generated data. These include medical devices, GPS data, data of usage
statistics captured by servers and applications and the huge amount of data that usually move through trading platforms,
to name a few.
Human-generated structured data mainly includes all the data a human input into a computer, such as his name and other
personal details. When a person clicks a link on the internet, or even makes a move in a game, data is created- this can be
used by companies to figure out their customer behavior and make the appropriate decisions and modifications.
Example of Structured Data
An 'Employee' table in a database is an
example of Structured Data.
Employee_ID Employee_Name Gender Department Salary_In_Euros
2365 Rajesh Kulkarni Male Finance 65000
3398 Pratibha Joshi Female Admin 65000
7465 Shushil Roy Male Admin 50000
7500 Shubhojit Das Male Finance 50000
7699 Priya Sane Female Finance 55000
17. UNSTRUCTURED
DATA
2 While structured data resides in the traditional row-column databases, unstructured data is the opposite- they have no
clear format in storage. The rest of the data created, about 80% of the total account for unstructured big data. Most of the
data a person encounters belongs to this category- and until recently, there was not much to do to it except storing it or
analyzing it manually.
Unstructured data is also classified based on its source, into machine-generated or human-generated. Machine-generated
data accounts for all the satellite images, the scientific data from various experiments and radar data captured by various
facets of technology.
Human-generated unstructured data is found in abundance across the internet, since it includes social media data, mobile
data and website content. This means that the pictures we upload to out Facebook or Instagram handles, the videos we
watch on YouTube and even the text messages we send all contribute to the gigantic heap that is unstructured data.
Example of Unstructured Data
Output returned by 'Google Search‚.
18. SEMI-
STRUCTURED
DATA
3 The line between unstructured data and semi-structured data has always been unclear, since most of the semi-structured
data appear to be unstructured at a glance. Information that is not in the traditional database format as structured data,
but contain some organizational properties which make it easier to process, are included in semi-structured data. For
example, NoSQL documents are considered to be semi-structured, since they contain keywords that can be used to
process the document easily.
An email message is one example of semi-structured data. It includes well-defined data fields in the header such as
sender, recipient, and so on, while the actual body of The Path to Hyperconverged Infrastructure for the Enterprise the
message is unstructured. If you wanted to find out who is emailing whom and when (information contained in the
header), a relational database might be a good choice. But if you’re more interested in the message content, big data
tools, such as natural language processing, will be a better ft.
Example of Semi-structured Data
Personal data stored in a XML file.
19. Smart Data Smart Region | www.smartdata.how
SOURCES OF DATA
Big data is often boiled down to a few varieties including social data, machine data, and
transactional data.
Machine data consists of information generated from industrial equipment, real-time
data from sensors that track parts and monitor machinery (often also called the Internet of
Things), and even web logs that track user behavior online. At arcplan client CERN, the largest
particle physics research center in the world, the Large Hadron Collider (LHC) generates 40
terabytes of data every second during experiments.
Regarding transactional data, large retailers and even B2B companies can generate
multitudes of data on a regular basis considering that their transactions consist of one or many
items, product IDs, prices, payment information, manufacturer and distributor data, and much
more.
Social media data is providing remarkable insights to companies on consumer
behavior and sentiment that can be integrated with CRM data for analysis, with 230 million
tweets posted on Twitter per day, 2.7 billion Likes and comments added to Facebook every day,
and 60 hours of video uploaded to YouTube every minute (this is what we mean by velocity of
data).
20. Smart Data Smart Region | www.smartdata.how
Social Media Data
Social Networking and
Media
Big data is all the huge unstructured data generated from social networks from a wide array of sources ranging from Social media
‘Likes’, ‘Tweets, blog posts, comments, videos and forum messages etc. Just to give you some information, Google in any given day
processes about 24 petabytes of data. For your information, most of the data is not arranged in rows and columns. Big data also
takes into account real time information from RFIDs and all kinds of sensors. The social intelligence that can be gleaned from data
of this magnitude is tremendous. Professionals and technologists from organizations in the enterprise and consumer social
networks have begun to realize the potential value of the data that is generated through social conversations. Sometimes Big data is
also often known as ‘bound’ data and ‘Unbound’ data.
Social networks have a geometric growth pattern. Big data technologies and applications should have the ability to scale and
analyze this large unstructured data. It should have the capability to analyze in real time as it happens. Social media conversations
generate lot of context to the information. Such context is an invaluable resource for knowledge and expertise sharing. Context in
conversations is key to a social network’s success. It is not an easy task to analyze millions of conversational messages every
day. This is where traditional analytics can help mainstream Big data analysis and both need to go hand in hand.
21. WhatsApp users
share
347,222
photos.
EVERY
MINUTE OF
EVERY DAY
E-mail users send
204,000,000
messages
YouTube users
upload
4,320
minutes of new
videos.
Google recieves over
4,000,000
search queries.Facebook users
share
2,460,000
pieces of content.
Twitter users tweet
277,000
times.
Amazon makes
83,000$
in online sales.
Instagram users
post
216,000
new photos.
Skype users
connect for
23,300
hours.
SM Examples
22. Machine Data
Social Networking and
Media
Machine data is everywhere. It is created by everything from planes and elevators to traffic lights and fitness-monitoring devices. It
intersects with and improves human lives in countless ways every day. Such data became more prevalent as technologies such
as radio frequency identification (RFID) and telematics advanced. More recently, machine data has gained further attention as use of
the Internet of Things, Hadoop and other big data management technologies has grown.
Application, server and business process logs, call detail records and sensor data are prime examples of machine data. Internet
clickstream data and website activity logs also factor into discussions of machine data.
Combining machine data with other enterprise data types for analysis is expected to provide new views and insight on business
activities and operations. For example, some large industrial manufacturers are analyzing machine data on the performance of field
equipment in near-real-time, together with historical performance data, to better understand service problems and to try to predict
equipment maintenance issues before machines break down.
Machine-generated data is the lifeblood of the Internet of Things (IoT).
Smart Data Smart Region | www.smartdata.how
24. Transactional Data
Transactional data are information directly derived as a result of transactions. Unlike other sorts of data, transactional data contains
a time dimension which means that there is timeliness to it and over time, it becomes less relevant.
Rather than being the object of transactions like the product being purchased or the identity of the customer, it is more of a
reference data describing the time, place, prices, payment methods, discount values, and quantities related to that particular
transaction, usually at the point of sale.
Purchases Returns Invoices Payments Credits
Donations Trades Dividends Contracts Interest
Payroll Lending Reservations Signups Subscriptions
Examples of transactional data
26. Smart Data Smart Region | www.smartdata.how
THE IMPORTANCE OF BIG DATA
The importance of big data does not revolve around how much data a company has but how a company utilizes the
collected data. Every company uses data in its own way; the more efficiently a company uses its data, the more
potential it has to grow. The company can take data from any source and analyze it to find answers which will enable:
Cost Savings
Some tools of Big Data can bring cost advantages to business when large amounts of data
are to be stored and these tools also help in identifying more efficient ways of doing
business.
Time Reductions
The high speed of tools and in-memory analytics can easily identify new sources of data
which helps businesses analyzing data immediately and make quick decisions based on the
learnings.
New Product
Development
By knowing the trends of customer needs and satisfaction through analytics you can create
products according to the wants of customers.
Understanding
the Market
Conditions
By analyzing big data you can get a better understanding of current market conditions. For
example, by analyzing customers’ purchasing behaviors, a company can find out the
products that are sold the most and produce products according to this trend.
Control Online
Reputation
Big data tools can do sentiment analysis. Therefore, you can get feedback about who is
saying what about your company. If you want to monitor and improve the online presence
of your business, then, big data tools can help in all this.
28. Smart Data Smart Region | www.smartdata.how
5 V‘s OF DATA
Volume
Velocity
Variety
Veracity
Value
The magnitude of
the data being
generated.
The speed at which
data is being
generated and
aggregated.
The different types of
data.
The trustworthiness
of the data in terms of
accuracy in quality.
The economic value
of the data.
90% of the data in the world
today has been created in the
last 2 years alone.
Literally the speed of light!
Data doubles every 40 months.
Structured, semi-structured
and unstructured data.
Because of the anonimity of
the Internet or possibly false
identities, the reliability of data
is often in question.
Having access to big data is no
good unless we can turn it into
value.
Big Data does a pretty good job of telling us what happened, but not why it happened or what to do about it. The 5 V‘s represent
specific characteristics and properties that can help us understand both the challenges and advantages of big data initiatives.
29. Smart Data Smart Region | www.smartdata.how
5 V‘s OF DATA
Volume
The magnitude of the data being generated.
Velocity
The speed at which data is being generated and aggregated.
Variety
The different types of data.
Veracity
The trustworthiness of the data in terms of accuracy in quality.
Value
The economic value of the data.
Big Data does a pretty good job
of telling us what happened,
but not why it happened or
what to do about it. The 5 V‘s
represent specific
characteristics and properties
that can help us understand
both the challenges and
advantages of big data
initiatives.
30. VOLUME
Volume refers to the vast amounts of data generated every
second. Just think of all the emails, twitter messages,
photos, video clips, sensor data etc. we produce and share
every second. We are not talking Terabytes but Zettabytes
or Brontobytes. On Facebook alone we send 10 billion
messages per day, click the "like' button 4.5 billion times
and upload 350 million new pictures each and every day. If
we take all the data generated in the world between the
beginning of time and 2008, the same amount of data will
soon be generated every minute! This increasingly makes
data sets too large to store and analyse using traditional
database technology. With big data technology we can
now store and use these data sets with the help of
distributed systems, where parts of the data is stored in
different locations and brought together by software.
31. VELOCITY
Velocity refers to the speed at which new data is
generated and the speed at which data moves around. Just
think of social media messages going viral in seconds, the
speed at which credit card transactions are checked for
fraudulent activities, or the milliseconds it takes trading
systems to analyse social media networks to pick up
signals that trigger decisions to buy or sell shares. Big data
technology allows us now to analyse the data while it is
being generated, without ever putting it into databases.
32. VARIETY
Variety refers to the different types of data we can now
use. In the past we focused on structured data that neatly
fits into tables or relational databases, such as financial
data (e.g. sales by product or region). In fact, 80% of the
world’s data is now unstructured, and therefore can’t
easily be put into tables (think of photos, video sequences
or social media updates). With big data technology we can
now harness differed types of data (structured and
unstructured) including messages, social media
conversations, photos, sensor data, video or voice
recordings and bring them together with more traditional,
structured data.
33. VERACITY
Veracity refers to the messiness or trustworthiness of the
data. With many forms of big data, quality and accuracy
are less controllable (just think of Twitter posts with hash
tags, abbreviations, typos and colloquial speech as well as
the reliability and accuracy of content) but big data and
analytics technology now allows us to work with these
type of data. The volumes often make up for the lack of
quality or accuracy.
34. VALUE
Value: Then there is another V to take into account when
looking at Big Data: Value! It is all well and good having
access to big data but unless we can turn it into value it is
useless. So you can safely argue that 'value' is the most
important V of Big Data. It is important that businesses
make a business case for any attempt to collect and
leverage big data. It is so easy to fall into the buzz trap and
embark on big data initiatives without a clear
understanding of costs and benefits.
Big data can deliver value in almost any area of business or society:
It helps companies to better understand and serve customers: Examples
include the recommendations made by Amazon or Netflix.
It allows companies to optimize their processes: Uber is able to predict
demand, dynamically price journeys and send the closest driver to the
customers.
It improves our health care: Government agencies can now predict flu
outbreaks and track them in real time and pharmaceutical companies are
able to use big data analytics to fast-track drug development.
It helps us to improve security: Government and law enforcement agencies
use big data to foil terrorist attacks and detect cyber crime.
It allows sport stars to boost their performance: Sensors in balls, cameras on
the pitch and GPS trackers on their clothes allow athletes to analyze and
improve upon what they do.
35. 1. Turning Big Data into Value
2. Smart Data Applications
3. How to Start Smart?
4. Big Data Challenges
HOW DOES BIG DATA
BECOME SMART
DATA
Smart Data Smart Region | www.smartdata.how
36. Smart Data Smart Region | www.smartdata.how
TURNING BIG DATA INTO VALUE
Smart data describes data that
has valid, well-defined,
meaningful information that
can expedite information
processing.
The „Datafication“
of our World:
• Activities
• Conversations
• Words
• Voice
• Social Media
• Browser logs
• Photos
• Videos
• Sensors
• Etc.
Analysing Big
Data:
• Text analytics
• Sentitment
analysis
• Face recognition
• Voice analytics
• Etc.
VOLUME
VELOCITY
VARIETY
VERACITY
The „Datafication“ of our world gives us unprecedeted amounts of data in terms of volume, velocity,
variety and veracity. The latest technology such as cloud computing and distributed systems together
with the latest software and analysis approaches allow us to leverage all types of data to gain insights
and add value.
VALUE
SMART
DATA
37. SMART DATA APPLICATIONS
• Fraud
detection/Prevention
• Brand sentiment
analysis
• Real time pricing
• Product placement
• Micro-targeted
advertising
• Monitor patient visits
• Patient care and
safety
• Reduce readmittance
rates
• Smart meter-stream
analysis
• Proactive equipment
repair
• Power and
consuption matching
• Cell tower diagnostics
• Bandwidth allocation
• Proactive
maintenance
• Decreasing time to
market
• Supply planning
• Increasing product
quality
• Network intrusion
detection and
prevention
• Disease outbreak
detection
• Unsafe driving
detection and
monitoring
• Route and time
planning for public
transport
FINANCIAL SERVICES RETAIL TELECOM MANUFACTURING
HEALTHCARE UTILITIES, OIL & GAS PUBLIC SECTOR TRANSPORTATION
Every business in the world needs data to thrive. Data is what tells you who your
customers are and how they operate, and it’s what can guide you to new insights
and new innovations. Any business can benefit from using big data to learn more
about their strategic position and development potential, but in order of not
„drowning“ in big data it is neccessary to find the right area of interest first.
Smart Data Smart Region | www.smartdata.how
38. HOW TO START SMART?
Smart Data Smart Region | www.smartdata.how
Even though data analysis and visualization tools have come a long way in the past decade, big data analysis still relies on human
intervention and coordination to be successful. You need to know how to ask the right questions, how to eliminate your own bias,
and how to form actionable insights rather than basic conclusions.
1. Review your
data.
• What data do you
have?
• How is it used?
• Do you have the
expertise to manage
your data?
2. Ask the right
questions.
• What data do you
have and how is it
used?
• Are you being specific
enough?
3. Draw the
conclusions.
• Could an expert help
to sense-check your
results?
• Can you validate your
hypotheses?
• What further data do
you need?
39. LACK OF TALENT
To successfully implement
a big data project requires
a sophisticated team of
developers, data scientists
and analysts who also have
a sufficient amount of
domain knowledge to
identify valuable insights.
Smart Data Smart Region | www.smartdata.how
BIG DATA CHALLENGES
It‘s easy to get caught up in the hype and opportunity of big data. However, one of the reasons big data is so
underutilized is because big data and big data technologies also present many challenges. One survey found that
55% of big data projects are never completed. So what‘s the problem with big data?
SCALABILITY
Many organizations fail
to take into account
how quickly a big data
project can grow and
evolve. Big data
workloads also tend to
be bursty, making it
difficult to allocate
capacity for resources.
ACTIONABLE
INSIGHTS
A key challenge for
data science teams is
to identify a clear
business objective and
the appropriate data
sources to collect and
analyze to meet that
objective.
DATA
QUALITY
Common causes of
dirty data include:
user imput errors,
duplicate data and
incorrect data
linking.
SECURITY
Specific challenges include:
- User authentication for every
team and team member
accessing the data
- Restricting access based on a
user‘s need
- Recording data access
histories and meeting other
comliance regulations
- proper use of encryprion on
data in-transit and at rest
COST
MANAGEMENT
Businesses pursuing big
data projects must
remember the cost of
training, maintenance
and expansion
40. Smart Data Smart Region | www.smartdata.how
BIG DATA PLATFORMS
There are several things you notice almost immediately when you start dealing with big
data. One thing that is decidedly different is the amount of open source software in wide
use. Many of the tools you hear the most about, such as Hadoop, are open source. Open
source is a good way to foster rapid innovation in a rapidly evolving field. As a corollary to
that you’ll notice that there are a vast number of big data tools from which to choose.
In addition to strictly open source offerings, well-known systems vendors such as IBM, HP,
Oracle, and Dell have products for the big data market. Many of these combine open
source tools and proprietary solutions. Major cloud providers including Amazon and
Google provide big data services in the cloud—often using versions of open source tools.
There are hundreds of big data tools and services, next slide will
show you just a peek into them.
Big data platform generally
consists of big data storage,
servers, database, big data
management, business
intelligence and other big
data management utilities.
It also supports custom
development, querying and
integration with other
systems.