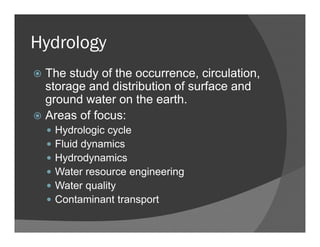
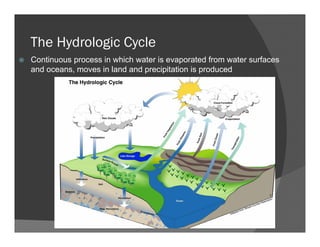
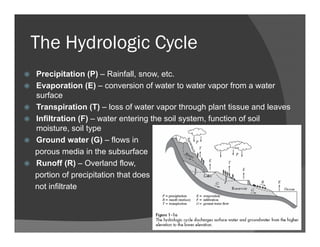
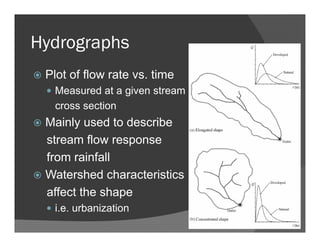
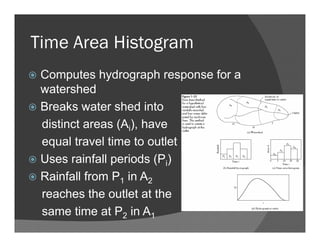
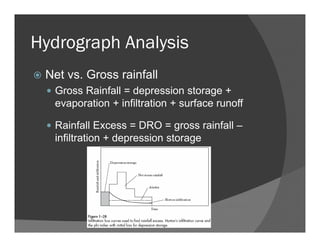
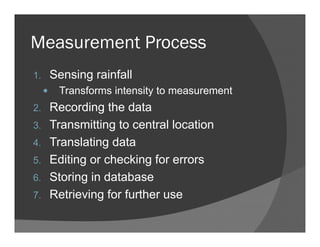
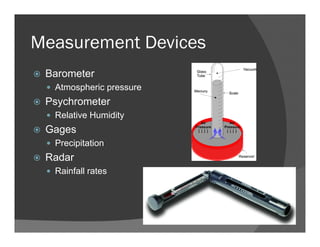
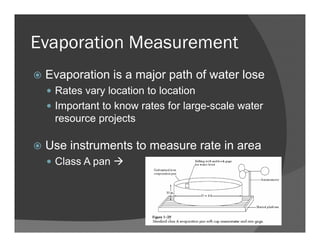
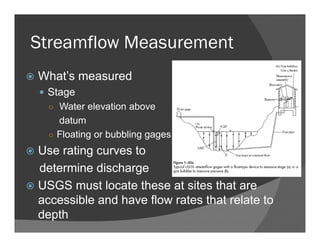
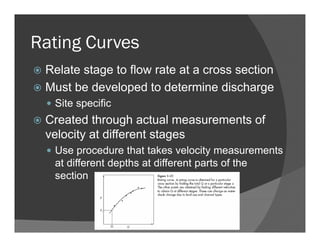
SlideShare a Scribd company logo
CEVE 412
Dr. Phil Bedient
Jan 2012
Hydrology and Floodplain Analysis,
Chapter 1
Hydrology
The study of the occurrence, circulation,
storage and distribution of surface and
ground water on the earth.
Areas of focus:
Hydrologic cycle
Fluid dynamics
Hydrodynamics
Water resource engineering
Water quality
Contaminant transport
The Hydrologic Cycle
Continuous process in which water is evaporated from water surfaces
and oceans, moves in land and precipitation is produced
The Hydrologic Cycle
Precipitation (P) – Rainfall, snow, etc.
Evaporation (E) – conversion of water to water vapor from a water
surface
Transpiration (T) – loss of water vapor through plant tissue and leaves
Infiltration (F) – water entering the soil system, function of soil
moisture, soil type
Ground water (G) – flows in
porous media in the subsurface
Runoff (R) – Overland flow,
portion of precipitation that does
not infiltrate
History
Water resource projects dating as far back as
4000 BC
Dam built across the Nile
First systemic flow measurement in U.S. in 1888
by USGS
1930s-1950s saw a boom in hydrologic knowledge
in US
Post 1950, scientists gained a greater
understanding of the effects of urbanization in
regards to hydrology
Computer advances have allowed for modeling of
complex hydrologic and hydraulic problems
Hydrology and Floodplain Analysis, Chapter 1.2
The Atmosphere
Atmosphere is a major hydrologic link
between oceans and continents and
facilitates the movement of water on the
earth
Major parameters
1. Atmospheric Pressure
2. Humidity
3. Precipitation
Atmospheric Pressure
Pressure = weight of air / unit area
Average Pressure at sea level (units)
1 atmosphere
1013 millibars (mb)
14.7 psi
760 mm-Hg
Ideal Gas Law
Describes behavior of gas under different
conditions
PV = nRT
P = Pressure
V = Volume
n = moles of gas
R = ideal gas constant
T = Temperature (Kelvin)
Gas Law and Atmosphere
Pressure and Temperature are
directly related at constant density
Temperature and Air Density (n/V) are
inversely related
Decrease in temperature increases
density
Affects movement of air masses
High pressure moves toward low pressure
Atmospheric Circulation
Fueled by solar energy
Uneven heating of the Earth
Concentrated at the equator
Warm air (low pressure)
travels upwards from the
equator and then towards the poles
Air shifts direction due to the Coriolis Force
Coriolis Force
Maintains angular
momentum
Mass of air wants to maintain
same speed, so it must
speed up as it leaves
equator, or slow down as it
moves towards equator
○ Point at the equator moves
faster than point near the pole
Causes air masses to “turn right” in northern
hemisphere, “turn left” in southern
Atmospheric Circulation
Coriolis effect creates westerlies, winds that
blow west to east in the northern hemisphere
Drive major weather systems in the U.S.
Air Masses and Fronts
Air Masses - large bodies of air with fairly
consistent temperature and humidity
gradients in horizontal direction
High Pressure System = Cold Weather
Low Pressure System = Warm Weather
Fronts are the boundaries
between two air masses
Humidity
Measure of amount of water vapor in
atmosphere
Specific Humidity - the mass of water vapor in
a unit mass of moist air at a given temperature
Relative Humidity – ratio of (air’s actual water vapor
content) to (amount of water vapor at saturation for
that temperature)
As air is lifted, it cools
Cool air “holds” less water
Eventually cools to the point that relative humidity is
saturated, and water vapor is condensed to liquid
Moisture Relationships
Specific Humidity (q)
q = (0.622*e) / (P - 0.378*e)
Vapor Pressure (e) – partial pressure exerted
by water vapor
e = (ρw*R*T) / (0.622)
○ ρw = vapor density or absolute humidity (g/cm3)
○ R = dry air gas constant
○ T = temperature (Kelvin)
Dew Point Temperature (Td) – temperature
that an air mass with constant pressure and
moisture content becomes saturated
Atmospheric Stability
Adiabatic Lapse Rate (ALR)
Rate of temperature change of air parcel with
change in elevation
Dry ALR = 9.8 oC/km
Rate varies with
moisture conditions
Causes stable or
unstable atmospheric
conditions
Cloud Types
Cirrus – feathery or fibrous clouds
Stratus – layered clouds
Cumulus – towering, puffy clouds
Alto – middle-level clouds
Nimbus – rain clouds
Cumulonimbus – thunderstorm clouds
Clouds
Precipitation
Condensed water vapor that falls to earth
Occurs when air parcel reaches saturation
i.e. the Dew Point Temperature is reached
Heat must be removed from moist air to allow
for condensation
Latent Heat
Major energy source
for storm systems
Precipitation Formation
Requires the following:
1. Moisture source
2. Lifting and resultant cooling
3. Phase change occurs with
condensation onto small
nuclei in the air
○ Range from 0.1 u – 10 u
○ Come from ocean salt, dust, etc
4. Droplets grow large enough to overcome drag
and evaporation
Lifting Mechanisms
Precipitation often classified by vertical lifting
Convective – Intense heating of the ground expansion and
vertical rise of air
Cyclonic – Movement of large air-mass systems (warm/cold fronts)
Orographic – Mechanical lifting of moist air masses over the
windward side of mountain ranges
Thunderstorms
Thunderstorms
Heavy rainfall, thunder, lightning, hail
Result from strong vertical movements or
warm, moist air
Generally occur due to
instability caused by:
○ Low-pressure systems
○ Surface heating
○ Forced ascent over
mountains
Thunderstorm Stages
Cumulus Stage
Moist air rises, cools and condenses into cumulus
clouds and continues to rise and condense
○ Updraft
Mature Stage
Rain begins to fall
Surrounding dry air is drawn into storm,
evaporates some drops and cools the air
○ Denser, cold air descends (downdraft) and creates
cool gusts of wind at ground level
Thunderstorm Stages (cont)
Dissipating Stage
When the updraft is cutoff
Rate of precipitation decreases
Downdrafts die-off
Clouds dissolve
Hurricanes
Intense cyclonic storms
Form over tropical oceans
○ Have localized names
Hurricane (N. Americe)
Cyclone (India)
Typhoon (East Asia)
Baguio (China Sea)
Energy comes from the condensation of very
warm, humid, tropical air
Categorized by the Saffir-Simpson Hurricane
Windscale
Saffir-Simpson Wind Scale
Category Wind Speed
(mph)
Extent of
Damage
Damage Description
Tropical Storm 39 – 73 Minor Some flooding
1 74 – 95 Minimal Limited damage, unanchored
mobile homes, trees
2 96 – 110 Moderate Some roof, door and window
damage
3 111 – 130 Extensive Some structural damage to
residences and utility buildings
4 131 – 155 Extreme Extensive curtainwall failures,
complete roof failures, all
signs blown down
5 156+ Catastrohpic Complete roof failure and
some complete building
failures
Hydrology and Floodplain Analysis, Chapter 1.3
Precipitation Trends
Varies geographically
Greater near coasts
Greater on windward side of mountains
○ Western side in US
Varies from season
to season
Rainfall Measurement
Why measure rainfall?
Water resource planning (annual)
○ California Water Project supplies water to
Southern California from Northern California
Urban drainage (hourly)
○ Reduce localized flooding
○ Need intensity and duration of rainfall
○ Spatial variation inside watershed
Point Measurement
Rainfall gage networks
Maintained by NWS, USGS or
local organizations
Typical gauge design
Methods of representation
Accumulated total rainfall
○ “Cumulative mass curve”
Rainfall Intensity vs. time
○ “Hyetograph”
Areal Precipitation
The average depth of precipitation over a
specific area (watershed)
Use point measurements to determine avg.
Three Methods
Arithmetic Mean
Thiessen Polygon Method
Isohyetal Method
Arithmetic Mean
Takes arithmetic mean of rainfalls from
available gages
Not accurate for large areas with variable
distribution
Only works if gages are uniformly distributed
Thiessen Polygon Method
Areal weighting of rainfall for each gage
Series of polygons created by lines
connecting eat gauge and perpendicular
bisectors
Uses ratio of polygon area to total area of interest
Most widely used method
Isohyetal Method
Draw contours of equal precipitation based
on gauge data
Uses area between each contour
Needs an extensive gauge network
Most accurate method
Next-Generation Radar (NEXRAD)
Allows for measurement of rainfall rates
and cumulative totals
Aided flood prediction
Specs
10-cm wave length
Records
○ Reflectivity
○ Radial Velocity
○ Spectrum width
Hydrology and Floodplain Analysis, Chapter 1.4-1.5
The Watershed
Def: Contiguous area that drains to an
outlet, specifically in regards to
precipitation
Basic hydrologic unit within which all
measurements, calculations and
predictions are made
Water Balance
I – Q = (dS/dt)
I = Inflow (L3/t)
Q = outflow (L3/t)
dS/dt = change in storage (L3/t)
Volume out of watershed =
(flow rate)*(time) OR
(depth)*(watershed area)
Water Balance
P – R – G – E – T = ∆S
P = Precipitation
R = Surface Runoff
G = Groundwater Flow
E = Evaporation
T = Transpiration
∆S = Change in Storage
Water balance for each area is different
Characteristics of the area alter how water
leaves watershed or basin
1. Rainfall intensity and
duration
2. Size, Slope, Shape, Soil,
Storage
3. Channel morphology
4. Location of
Developments
5. Land use and cover
6. Soil type
7. Percent impervious
Divide
Floodplain
Reservoir
Natural
stream
Urban
Concrete
channel
Parameters that Affect Response in a
Watershed
Floodplain
Rainfall Runoff
Want to develop relationship of rainfall
minus losses vs. runoff for flood control
Allows hydrologists to determine flood conditions
based upon rainfall totals
Rainfall Runoff
Rational Method
Simplest rainfall-runoff formulas
QP = CiA
○ QP = peak flow (cfs)
○ C = runoff coefficient, varies with land use
○ i = rainfall intensity (in/hr) for a duration equal to
time of concentration (tc)
○ tc = time for a wave of water to propagate from the
most distant point of a watershed to the outlet
○ A = area of watershed (acres)
Hydrology and Floodplain Analysis, Chapter 1.6-1.7
Hydrographs
Plot of flow rate vs. time
Measured at a given stream
cross section
Mainly used to describe
stream flow response
from rainfall
Watershed characteristics
affect the shape
i.e. urbanization
Time Area Histogram
Computes hydrograph response for a
watershed
Breaks water shed into
distinct areas (Ai), have
equal travel time to outlet
Uses rainfall periods (Pi)
Rainfall from P1 in A2
reaches the outlet at the
same time at P2 in A1
Hydrographs – Broken Down
Typically characterized by:
Base Flow
Rising Limb
○ Increase in flow
Crest Segment
○ Peak flow rate
Recession Curve
○ Decrease in flow
Inflection Point
○ Point where direct runoff ends
Hydrograph Analysis
Total storm hydrograph is made up of Base
Flow and Direct runoff
Base Flow
Comes from ground water in absence of rainfall
Relatively small in urban environments
Direct Runoff (DRO)
Discharge caused by rainfall after infiltration losses
have been subtracted
“Rainfall Excess”
Hydrograph Analysis
How to separate Base Flow from DRO
Recession curves
○ qt = q0e-kt
q0 = specified initial discharge
qt = discharge at a later time, t
k = recession constant
Create these for each area of interest
More of an art than a science
Hydrograph Analysis
Hydrograph peak
Occurs when all areas contribute flow to the outlet
Dependent on watershed geography, storm
intensity/duration
Developed area
○ Higher, quicker peak flow
Natural, wooded area
○ Lower, slower peak
Hydrograph Analysis
Response to rainfall
Duration of rainfall is often shorter than time base
of hydrograph
Peak flow does NOT
correspond to peak
rainfall
Volume of water under hydrograph should
equal volume of precipitation minus base flow
and loses
Hydrograph Analysis
Infiltration and response
Rainfall (i) lose to infiltration (f) depends on
○ Soil Moisture Storage (SD)
○ Field Capacity (F)
Amount of water in a soil after gravity has drained it
If i < f
○ No overland runoff; all rainfall infiltrates
If i > f
○ Overland flow occurs
ϕ Index is simplest infiltration method
○ (gross precipitation) – (observed surface runoff)
Hydrograph Analysis
Infiltration and response
Horton Infiltration Method
○ When rainfall rate > infiltration rate, water infiltrates
at a rate that decreases
ϕ Index is simplest infiltration method
○ (gross precipitation) – (observed surface runoff)
○ Often underestimates losses at beginning
INSERT FIGURE 1-28 HERE
Hydrograph Analysis
Net vs. Gross rainfall
Gross Rainfall = depression storage +
evaporation + infiltration + surface runoff
Rainfall Excess = DRO = gross rainfall –
infiltration + depression storage
Hydrology and Floodplain Analysis, Chapter 1.8
Measurement Process
1. Sensing rainfall
Transforms intensity to measurement
2. Recording the data
3. Transmitting to central location
4. Translating data
5. Editing or checking for errors
6. Storing in database
7. Retrieving for further use
Measurement Devices
Barometer
Atmospheric pressure
Psychrometer
Relative Humidity
Gages
Precipitation
Radar
Rainfall rates
Evaporation Measurement
Evaporation is a major path of water lose
Rates vary location to location
Important to know rates for large-scale water
resource projects
Use instruments to measure rate in area
Class A pan
Infiltration Measurement
Small Scale: Ring Infiltrometer
2 ft. diameter ring driven into soil
Water is dumped into ring
Rate of infiltration is measured as water level drops
Large Scale: actual measurements
(Gross Rainfall) – (Direct Runoff from hydrograph)
Streamflow Measurement
What’s measured
Stage
○ Water elevation above
datum
○ Floating or bubbling gages
Use rating curves to
determine discharge
USGS must locate these at sites that are
accessible and have flow rates that relate to
depth
Rating Curves
Relate stage to flow rate at a cross section
Must be developed to determine discharge
Site specific
Created through actual measurements of
velocity at different stages
Use procedure that takes velocity measurements
at different depths at different parts of the
section

More Related Content

What's hot

WATER RESOURCES ENGINEERING MODULE 1 NOTES
WATER RESOURCES ENGINEERING MODULE 1 NOTESWATER RESOURCES ENGINEERING MODULE 1 NOTES
WATER RESOURCES ENGINEERING MODULE 1 NOTES
ReshmaMRaju
 
Evaporation and transpiration for hydrology subject
Evaporation and transpiration for hydrology subjectEvaporation and transpiration for hydrology subject
Evaporation and transpiration for hydrology subject
Muhammad Sultan
 
Ch2 precipitation
Ch2 precipitationCh2 precipitation
Ch2 precipitation
Deenesh Sharma
 
Lecture4(hydro)
Lecture4(hydro)Lecture4(hydro)
Lecture4(hydro)mltan4
 
15 evaporation transpiration sublimation
15 evaporation transpiration sublimation15 evaporation transpiration sublimation
15 evaporation transpiration sublimation
University of Zambia, School of Pharmacy, Lusaka, Zambia
 
AS Geography - factors affecting temperature and Humidity
AS Geography - factors affecting temperature and HumidityAS Geography - factors affecting temperature and Humidity
AS Geography - factors affecting temperature and Humidity
nazeema khan
 
2019 tg atmosphere3 humidity
2019 tg atmosphere3 humidity2019 tg atmosphere3 humidity
2019 tg atmosphere3 humidity
Juan Antonio García González
 
Atmosphere and weather
Atmosphere and weatherAtmosphere and weather
Atmosphere and weatherMailyn Morales
 
Energy budgets
Energy budgetsEnergy budgets
Energy budgets
Guerillateacher
 
Module 1 introduction
Module 1 introductionModule 1 introduction
Module 1 introduction
Ankit Patel
 
Thermohaline Circulation & Climate Change
Thermohaline Circulation & Climate ChangeThermohaline Circulation & Climate Change
Thermohaline Circulation & Climate Change
Arulalan T
 
Temperature and it’s distribution(ocean)
Temperature and it’s distribution(ocean)Temperature and it’s distribution(ocean)
Temperature and it’s distribution(ocean)
Tanuj Joshi
 
L6 infiltrationr rate calculation
L6 infiltrationr rate calculationL6 infiltrationr rate calculation
L6 infiltrationr rate calculation
MEHEDIMASUM2
 
Hydrology
HydrologyHydrology
Hydrology
Anuragc583
 
15 heat transfer
15 heat transfer15 heat transfer
Hydrology notes
Hydrology notesHydrology notes
Hydrology notes
Mohammad Mohaiminul Islam
 
Hydrology seminar ppt
Hydrology seminar pptHydrology seminar ppt
Hydrology seminar ppt
PrashantHiremath23
 
Hydrology Chapter 1
Hydrology Chapter 1Hydrology Chapter 1
Hydrology Chapter 1
Hannalee Perdez
 
Rainfall presentation in ppt
Rainfall presentation in pptRainfall presentation in ppt
Rainfall presentation in ppt
Paras Raj
 

What's hot (20)

WATER RESOURCES ENGINEERING MODULE 1 NOTES
WATER RESOURCES ENGINEERING MODULE 1 NOTESWATER RESOURCES ENGINEERING MODULE 1 NOTES
WATER RESOURCES ENGINEERING MODULE 1 NOTES
 
Evaporation and transpiration for hydrology subject
Evaporation and transpiration for hydrology subjectEvaporation and transpiration for hydrology subject
Evaporation and transpiration for hydrology subject
 
Ch2 precipitation
Ch2 precipitationCh2 precipitation
Ch2 precipitation
 
Lecture4(hydro)
Lecture4(hydro)Lecture4(hydro)
Lecture4(hydro)
 
15 evaporation transpiration sublimation
15 evaporation transpiration sublimation15 evaporation transpiration sublimation
15 evaporation transpiration sublimation
 
AS Geography - factors affecting temperature and Humidity
AS Geography - factors affecting temperature and HumidityAS Geography - factors affecting temperature and Humidity
AS Geography - factors affecting temperature and Humidity
 
2019 tg atmosphere3 humidity
2019 tg atmosphere3 humidity2019 tg atmosphere3 humidity
2019 tg atmosphere3 humidity
 
Atmosphere and weather
Atmosphere and weatherAtmosphere and weather
Atmosphere and weather
 
Energy budgets
Energy budgetsEnergy budgets
Energy budgets
 
Module 1 introduction
Module 1 introductionModule 1 introduction
Module 1 introduction
 
Thermohaline Circulation & Climate Change
Thermohaline Circulation & Climate ChangeThermohaline Circulation & Climate Change
Thermohaline Circulation & Climate Change
 
Temperature and it’s distribution(ocean)
Temperature and it’s distribution(ocean)Temperature and it’s distribution(ocean)
Temperature and it’s distribution(ocean)
 
L6 infiltrationr rate calculation
L6 infiltrationr rate calculationL6 infiltrationr rate calculation
L6 infiltrationr rate calculation
 
Hydrology
HydrologyHydrology
Hydrology
 
15 heat transfer
15 heat transfer15 heat transfer
15 heat transfer
 
Hydrology notes
Hydrology notesHydrology notes
Hydrology notes
 
Hydrology seminar ppt
Hydrology seminar pptHydrology seminar ppt
Hydrology seminar ppt
 
Evaporation (1)
Evaporation (1)Evaporation (1)
Evaporation (1)
 
Hydrology Chapter 1
Hydrology Chapter 1Hydrology Chapter 1
Hydrology Chapter 1
 
Rainfall presentation in ppt
Rainfall presentation in pptRainfall presentation in ppt
Rainfall presentation in ppt
 

Similar to Chapter 1

diapositivas de introduccion a la hidrología y balance hidrológico
diapositivas de introduccion a la hidrología y balance hidrológicodiapositivas de introduccion a la hidrología y balance hidrológico
diapositivas de introduccion a la hidrología y balance hidrológico
terezamusolini453
 
Meteorology
MeteorologyMeteorology
Weather And Climate
Weather And ClimateWeather And Climate
Weather And ClimateMrs. Henley
 
Weather and Climate
Weather and ClimateWeather and Climate
Weather and Climatetcooper66
 
Weather elements and factors
Weather elements and factorsWeather elements and factors
Weather elements and factorsShabana Yasmin
 
chapt04_lecture Getis 13e(2).ppt
chapt04_lecture Getis 13e(2).pptchapt04_lecture Getis 13e(2).ppt
chapt04_lecture Getis 13e(2).ppt
amitkumar473416
 
Weather.Climate.Notes.ppt
Weather.Climate.Notes.pptWeather.Climate.Notes.ppt
Weather.Climate.Notes.ppt
KrentzNacionales
 
Key terms in weather and climate
Key terms in weather and climateKey terms in weather and climate
Key terms in weather and climateAlisa Jankie
 
Weather cells and weather systems of atmosphere
Weather cells and weather systems of atmosphereWeather cells and weather systems of atmosphere
Weather cells and weather systems of atmosphere
Sunil Kumar
 
Hydrology presentation on rainfall
Hydrology presentation on rainfallHydrology presentation on rainfall
Hydrology presentation on rainfallanimesh91
 
Test review ppt
Test review pptTest review ppt
Test review pptmrmccann
 
Climate : Eliments and Factors
Climate : Eliments and FactorsClimate : Eliments and Factors
Climate : Eliments and Factors
TanvirHridoy1
 
Engineering hydrology
Engineering hydrologyEngineering hydrology
Engineering hydrology
kartikchourasia
 

Similar to Chapter 1 (20)

diapositivas de introduccion a la hidrología y balance hidrológico
diapositivas de introduccion a la hidrología y balance hidrológicodiapositivas de introduccion a la hidrología y balance hidrológico
diapositivas de introduccion a la hidrología y balance hidrológico
 
Meteorology
MeteorologyMeteorology
Meteorology
 
Weather And Climate
Weather And ClimateWeather And Climate
Weather And Climate
 
Weather and Climate
Weather and ClimateWeather and Climate
Weather and Climate
 
Weather elements and factors
Weather elements and factorsWeather elements and factors
Weather elements and factors
 
chapt04_lecture Getis 13e(2).ppt
chapt04_lecture Getis 13e(2).pptchapt04_lecture Getis 13e(2).ppt
chapt04_lecture Getis 13e(2).ppt
 
Weather.Climate.Notes.ppt
Weather.Climate.Notes.pptWeather.Climate.Notes.ppt
Weather.Climate.Notes.ppt
 
Chapter seven
Chapter sevenChapter seven
Chapter seven
 
Key terms in weather and climate
Key terms in weather and climateKey terms in weather and climate
Key terms in weather and climate
 
Weather cells and weather systems of atmosphere
Weather cells and weather systems of atmosphereWeather cells and weather systems of atmosphere
Weather cells and weather systems of atmosphere
 
Hydrology presentation on rainfall
Hydrology presentation on rainfallHydrology presentation on rainfall
Hydrology presentation on rainfall
 
Ch 15 ed
Ch 15 edCh 15 ed
Ch 15 ed
 
Climate
ClimateClimate
Climate
 
Weather Lecture
Weather LectureWeather Lecture
Weather Lecture
 
Test review ppt
Test review pptTest review ppt
Test review ppt
 
Meteorology
MeteorologyMeteorology
Meteorology
 
Climate : Eliments and Factors
Climate : Eliments and FactorsClimate : Eliments and Factors
Climate : Eliments and Factors
 
Engineering hydrology
Engineering hydrologyEngineering hydrology
Engineering hydrology
 
Chapt15 lecture
Chapt15 lectureChapt15 lecture
Chapt15 lecture
 
The water cycle
The water cycleThe water cycle
The water cycle
 

More from Ruly J Quiroz Lopz

Geologia
Geologia   Geologia
Determinacion del suelo
Determinacion del sueloDeterminacion del suelo
Determinacion del suelo
Ruly J Quiroz Lopz
 
Bd laboratorio5
Bd laboratorio5Bd laboratorio5
Bd laboratorio5
Ruly J Quiroz Lopz
 
Precipitacion
PrecipitacionPrecipitacion
Precipitacion
Ruly J Quiroz Lopz
 
Determinacion del suelo
Determinacion del sueloDeterminacion del suelo
Determinacion del suelo
Ruly J Quiroz Lopz
 
Caratula civil
Caratula civilCaratula civil
Caratula civil
Ruly J Quiroz Lopz
 
1 escalas topograficas
1 escalas topograficas1 escalas topograficas
1 escalas topograficas
Ruly J Quiroz Lopz
 
Perfil de inteligencia multiples
Perfil de inteligencia multiplesPerfil de inteligencia multiples
Perfil de inteligencia multiplesRuly J Quiroz Lopz
 
Bioelementos
BioelementosBioelementos
Bioelementos
Ruly J Quiroz Lopz
 
1 medida de distciass
1 medida de distciass1 medida de distciass
1 medida de distciass
Ruly J Quiroz Lopz
 
símbolos topogríficos
símbolos topogríficossímbolos topogríficos
símbolos topogríficos
Ruly J Quiroz Lopz
 

More from Ruly J Quiroz Lopz (11)

Geologia
Geologia   Geologia
Geologia
 
Determinacion del suelo
Determinacion del sueloDeterminacion del suelo
Determinacion del suelo
 
Bd laboratorio5
Bd laboratorio5Bd laboratorio5
Bd laboratorio5
 
Precipitacion
PrecipitacionPrecipitacion
Precipitacion
 
Determinacion del suelo
Determinacion del sueloDeterminacion del suelo
Determinacion del suelo
 
Caratula civil
Caratula civilCaratula civil
Caratula civil
 
1 escalas topograficas
1 escalas topograficas1 escalas topograficas
1 escalas topograficas
 
Perfil de inteligencia multiples
Perfil de inteligencia multiplesPerfil de inteligencia multiples
Perfil de inteligencia multiples
 
Bioelementos
BioelementosBioelementos
Bioelementos
 
1 medida de distciass
1 medida de distciass1 medida de distciass
1 medida de distciass
 
símbolos topogríficos
símbolos topogríficossímbolos topogríficos
símbolos topogríficos
 

Recently uploaded

Mission to Decommission: Importance of Decommissioning Products to Increase E...
Mission to Decommission: Importance of Decommissioning Products to Increase E...Mission to Decommission: Importance of Decommissioning Products to Increase E...
Mission to Decommission: Importance of Decommissioning Products to Increase E...
Product School
 
Search and Society: Reimagining Information Access for Radical Futures
Search and Society: Reimagining Information Access for Radical FuturesSearch and Society: Reimagining Information Access for Radical Futures
Search and Society: Reimagining Information Access for Radical Futures
Bhaskar Mitra
 
GDG Cloud Southlake #33: Boule & Rebala: Effective AppSec in SDLC using Deplo...
GDG Cloud Southlake #33: Boule & Rebala: Effective AppSec in SDLC using Deplo...GDG Cloud Southlake #33: Boule & Rebala: Effective AppSec in SDLC using Deplo...
GDG Cloud Southlake #33: Boule & Rebala: Effective AppSec in SDLC using Deplo...
James Anderson
 
Accelerate your Kubernetes clusters with Varnish Caching
Accelerate your Kubernetes clusters with Varnish CachingAccelerate your Kubernetes clusters with Varnish Caching
Accelerate your Kubernetes clusters with Varnish Caching
Thijs Feryn
 
LF Energy Webinar: Electrical Grid Modelling and Simulation Through PowSyBl -...
LF Energy Webinar: Electrical Grid Modelling and Simulation Through PowSyBl -...LF Energy Webinar: Electrical Grid Modelling and Simulation Through PowSyBl -...
LF Energy Webinar: Electrical Grid Modelling and Simulation Through PowSyBl -...
DanBrown980551
 
Dev Dives: Train smarter, not harder – active learning and UiPath LLMs for do...
Dev Dives: Train smarter, not harder – active learning and UiPath LLMs for do...Dev Dives: Train smarter, not harder – active learning and UiPath LLMs for do...
Dev Dives: Train smarter, not harder – active learning and UiPath LLMs for do...
UiPathCommunity
 
UiPath Test Automation using UiPath Test Suite series, part 4
UiPath Test Automation using UiPath Test Suite series, part 4UiPath Test Automation using UiPath Test Suite series, part 4
UiPath Test Automation using UiPath Test Suite series, part 4
DianaGray10
 
Transcript: Selling digital books in 2024: Insights from industry leaders - T...
Transcript: Selling digital books in 2024: Insights from industry leaders - T...Transcript: Selling digital books in 2024: Insights from industry leaders - T...
Transcript: Selling digital books in 2024: Insights from industry leaders - T...
BookNet Canada
 
PHP Frameworks: I want to break free (IPC Berlin 2024)
PHP Frameworks: I want to break free (IPC Berlin 2024)PHP Frameworks: I want to break free (IPC Berlin 2024)
PHP Frameworks: I want to break free (IPC Berlin 2024)
Ralf Eggert
 
From Daily Decisions to Bottom Line: Connecting Product Work to Revenue by VP...
From Daily Decisions to Bottom Line: Connecting Product Work to Revenue by VP...From Daily Decisions to Bottom Line: Connecting Product Work to Revenue by VP...
From Daily Decisions to Bottom Line: Connecting Product Work to Revenue by VP...
Product School
 
Designing Great Products: The Power of Design and Leadership by Chief Designe...
Designing Great Products: The Power of Design and Leadership by Chief Designe...Designing Great Products: The Power of Design and Leadership by Chief Designe...
Designing Great Products: The Power of Design and Leadership by Chief Designe...
Product School
 
Neuro-symbolic is not enough, we need neuro-*semantic*
Neuro-symbolic is not enough, we need neuro-*semantic*Neuro-symbolic is not enough, we need neuro-*semantic*
Neuro-symbolic is not enough, we need neuro-*semantic*
Frank van Harmelen
 
FIDO Alliance Osaka Seminar: Overview.pdf
FIDO Alliance Osaka Seminar: Overview.pdfFIDO Alliance Osaka Seminar: Overview.pdf
FIDO Alliance Osaka Seminar: Overview.pdf
FIDO Alliance
 
Empowering NextGen Mobility via Large Action Model Infrastructure (LAMI): pav...
Empowering NextGen Mobility via Large Action Model Infrastructure (LAMI): pav...Empowering NextGen Mobility via Large Action Model Infrastructure (LAMI): pav...
Empowering NextGen Mobility via Large Action Model Infrastructure (LAMI): pav...
Thierry Lestable
 
FIDO Alliance Osaka Seminar: FIDO Security Aspects.pdf
FIDO Alliance Osaka Seminar: FIDO Security Aspects.pdfFIDO Alliance Osaka Seminar: FIDO Security Aspects.pdf
FIDO Alliance Osaka Seminar: FIDO Security Aspects.pdf
FIDO Alliance
 
Leading Change strategies and insights for effective change management pdf 1.pdf
Leading Change strategies and insights for effective change management pdf 1.pdfLeading Change strategies and insights for effective change management pdf 1.pdf
Leading Change strategies and insights for effective change management pdf 1.pdf
OnBoard
 
Slack (or Teams) Automation for Bonterra Impact Management (fka Social Soluti...
Slack (or Teams) Automation for Bonterra Impact Management (fka Social Soluti...Slack (or Teams) Automation for Bonterra Impact Management (fka Social Soluti...
Slack (or Teams) Automation for Bonterra Impact Management (fka Social Soluti...
Jeffrey Haguewood
 
"Impact of front-end architecture on development cost", Viktor Turskyi
"Impact of front-end architecture on development cost", Viktor Turskyi"Impact of front-end architecture on development cost", Viktor Turskyi
"Impact of front-end architecture on development cost", Viktor Turskyi
Fwdays
 
Essentials of Automations: Optimizing FME Workflows with Parameters
Essentials of Automations: Optimizing FME Workflows with ParametersEssentials of Automations: Optimizing FME Workflows with Parameters
Essentials of Automations: Optimizing FME Workflows with Parameters
Safe Software
 
How world-class product teams are winning in the AI era by CEO and Founder, P...
How world-class product teams are winning in the AI era by CEO and Founder, P...How world-class product teams are winning in the AI era by CEO and Founder, P...
How world-class product teams are winning in the AI era by CEO and Founder, P...
Product School
 

Recently uploaded (20)

Mission to Decommission: Importance of Decommissioning Products to Increase E...
Mission to Decommission: Importance of Decommissioning Products to Increase E...Mission to Decommission: Importance of Decommissioning Products to Increase E...
Mission to Decommission: Importance of Decommissioning Products to Increase E...
 
Search and Society: Reimagining Information Access for Radical Futures
Search and Society: Reimagining Information Access for Radical FuturesSearch and Society: Reimagining Information Access for Radical Futures
Search and Society: Reimagining Information Access for Radical Futures
 
GDG Cloud Southlake #33: Boule & Rebala: Effective AppSec in SDLC using Deplo...
GDG Cloud Southlake #33: Boule & Rebala: Effective AppSec in SDLC using Deplo...GDG Cloud Southlake #33: Boule & Rebala: Effective AppSec in SDLC using Deplo...
GDG Cloud Southlake #33: Boule & Rebala: Effective AppSec in SDLC using Deplo...
 
Accelerate your Kubernetes clusters with Varnish Caching
Accelerate your Kubernetes clusters with Varnish CachingAccelerate your Kubernetes clusters with Varnish Caching
Accelerate your Kubernetes clusters with Varnish Caching
 
LF Energy Webinar: Electrical Grid Modelling and Simulation Through PowSyBl -...
LF Energy Webinar: Electrical Grid Modelling and Simulation Through PowSyBl -...LF Energy Webinar: Electrical Grid Modelling and Simulation Through PowSyBl -...
LF Energy Webinar: Electrical Grid Modelling and Simulation Through PowSyBl -...
 
Dev Dives: Train smarter, not harder – active learning and UiPath LLMs for do...
Dev Dives: Train smarter, not harder – active learning and UiPath LLMs for do...Dev Dives: Train smarter, not harder – active learning and UiPath LLMs for do...
Dev Dives: Train smarter, not harder – active learning and UiPath LLMs for do...
 
UiPath Test Automation using UiPath Test Suite series, part 4
UiPath Test Automation using UiPath Test Suite series, part 4UiPath Test Automation using UiPath Test Suite series, part 4
UiPath Test Automation using UiPath Test Suite series, part 4
 
Transcript: Selling digital books in 2024: Insights from industry leaders - T...
Transcript: Selling digital books in 2024: Insights from industry leaders - T...Transcript: Selling digital books in 2024: Insights from industry leaders - T...
Transcript: Selling digital books in 2024: Insights from industry leaders - T...
 
PHP Frameworks: I want to break free (IPC Berlin 2024)
PHP Frameworks: I want to break free (IPC Berlin 2024)PHP Frameworks: I want to break free (IPC Berlin 2024)
PHP Frameworks: I want to break free (IPC Berlin 2024)
 
From Daily Decisions to Bottom Line: Connecting Product Work to Revenue by VP...
From Daily Decisions to Bottom Line: Connecting Product Work to Revenue by VP...From Daily Decisions to Bottom Line: Connecting Product Work to Revenue by VP...
From Daily Decisions to Bottom Line: Connecting Product Work to Revenue by VP...
 
Designing Great Products: The Power of Design and Leadership by Chief Designe...
Designing Great Products: The Power of Design and Leadership by Chief Designe...Designing Great Products: The Power of Design and Leadership by Chief Designe...
Designing Great Products: The Power of Design and Leadership by Chief Designe...
 
Neuro-symbolic is not enough, we need neuro-*semantic*
Neuro-symbolic is not enough, we need neuro-*semantic*Neuro-symbolic is not enough, we need neuro-*semantic*
Neuro-symbolic is not enough, we need neuro-*semantic*
 
FIDO Alliance Osaka Seminar: Overview.pdf
FIDO Alliance Osaka Seminar: Overview.pdfFIDO Alliance Osaka Seminar: Overview.pdf
FIDO Alliance Osaka Seminar: Overview.pdf
 
Empowering NextGen Mobility via Large Action Model Infrastructure (LAMI): pav...
Empowering NextGen Mobility via Large Action Model Infrastructure (LAMI): pav...Empowering NextGen Mobility via Large Action Model Infrastructure (LAMI): pav...
Empowering NextGen Mobility via Large Action Model Infrastructure (LAMI): pav...
 
FIDO Alliance Osaka Seminar: FIDO Security Aspects.pdf
FIDO Alliance Osaka Seminar: FIDO Security Aspects.pdfFIDO Alliance Osaka Seminar: FIDO Security Aspects.pdf
FIDO Alliance Osaka Seminar: FIDO Security Aspects.pdf
 
Leading Change strategies and insights for effective change management pdf 1.pdf
Leading Change strategies and insights for effective change management pdf 1.pdfLeading Change strategies and insights for effective change management pdf 1.pdf
Leading Change strategies and insights for effective change management pdf 1.pdf
 
Slack (or Teams) Automation for Bonterra Impact Management (fka Social Soluti...
Slack (or Teams) Automation for Bonterra Impact Management (fka Social Soluti...Slack (or Teams) Automation for Bonterra Impact Management (fka Social Soluti...
Slack (or Teams) Automation for Bonterra Impact Management (fka Social Soluti...
 
"Impact of front-end architecture on development cost", Viktor Turskyi
"Impact of front-end architecture on development cost", Viktor Turskyi"Impact of front-end architecture on development cost", Viktor Turskyi
"Impact of front-end architecture on development cost", Viktor Turskyi
 
Essentials of Automations: Optimizing FME Workflows with Parameters
Essentials of Automations: Optimizing FME Workflows with ParametersEssentials of Automations: Optimizing FME Workflows with Parameters
Essentials of Automations: Optimizing FME Workflows with Parameters
 
How world-class product teams are winning in the AI era by CEO and Founder, P...
How world-class product teams are winning in the AI era by CEO and Founder, P...How world-class product teams are winning in the AI era by CEO and Founder, P...
How world-class product teams are winning in the AI era by CEO and Founder, P...
 

Chapter 1

  • 1. CEVE 412 Dr. Phil Bedient Jan 2012 Hydrology and Floodplain Analysis, Chapter 1
  • 2. Hydrology The study of the occurrence, circulation, storage and distribution of surface and ground water on the earth. Areas of focus: Hydrologic cycle Fluid dynamics Hydrodynamics Water resource engineering Water quality Contaminant transport
  • 3. The Hydrologic Cycle Continuous process in which water is evaporated from water surfaces and oceans, moves in land and precipitation is produced
  • 4. The Hydrologic Cycle Precipitation (P) – Rainfall, snow, etc. Evaporation (E) – conversion of water to water vapor from a water surface Transpiration (T) – loss of water vapor through plant tissue and leaves Infiltration (F) – water entering the soil system, function of soil moisture, soil type Ground water (G) – flows in porous media in the subsurface Runoff (R) – Overland flow, portion of precipitation that does not infiltrate
  • 5. History Water resource projects dating as far back as 4000 BC Dam built across the Nile First systemic flow measurement in U.S. in 1888 by USGS 1930s-1950s saw a boom in hydrologic knowledge in US Post 1950, scientists gained a greater understanding of the effects of urbanization in regards to hydrology Computer advances have allowed for modeling of complex hydrologic and hydraulic problems
  • 6. Hydrology and Floodplain Analysis, Chapter 1.2
  • 7. The Atmosphere Atmosphere is a major hydrologic link between oceans and continents and facilitates the movement of water on the earth Major parameters 1. Atmospheric Pressure 2. Humidity 3. Precipitation
  • 8. Atmospheric Pressure Pressure = weight of air / unit area Average Pressure at sea level (units) 1 atmosphere 1013 millibars (mb) 14.7 psi 760 mm-Hg
  • 9. Ideal Gas Law Describes behavior of gas under different conditions PV = nRT P = Pressure V = Volume n = moles of gas R = ideal gas constant T = Temperature (Kelvin)
  • 10. Gas Law and Atmosphere Pressure and Temperature are directly related at constant density Temperature and Air Density (n/V) are inversely related Decrease in temperature increases density Affects movement of air masses High pressure moves toward low pressure
  • 11. Atmospheric Circulation Fueled by solar energy Uneven heating of the Earth Concentrated at the equator Warm air (low pressure) travels upwards from the equator and then towards the poles Air shifts direction due to the Coriolis Force
  • 12. Coriolis Force Maintains angular momentum Mass of air wants to maintain same speed, so it must speed up as it leaves equator, or slow down as it moves towards equator ○ Point at the equator moves faster than point near the pole Causes air masses to “turn right” in northern hemisphere, “turn left” in southern
  • 13. Atmospheric Circulation Coriolis effect creates westerlies, winds that blow west to east in the northern hemisphere Drive major weather systems in the U.S.
  • 14. Air Masses and Fronts Air Masses - large bodies of air with fairly consistent temperature and humidity gradients in horizontal direction High Pressure System = Cold Weather Low Pressure System = Warm Weather Fronts are the boundaries between two air masses
  • 15. Humidity Measure of amount of water vapor in atmosphere Specific Humidity - the mass of water vapor in a unit mass of moist air at a given temperature Relative Humidity – ratio of (air’s actual water vapor content) to (amount of water vapor at saturation for that temperature) As air is lifted, it cools Cool air “holds” less water Eventually cools to the point that relative humidity is saturated, and water vapor is condensed to liquid
  • 16. Moisture Relationships Specific Humidity (q) q = (0.622*e) / (P - 0.378*e) Vapor Pressure (e) – partial pressure exerted by water vapor e = (ρw*R*T) / (0.622) ○ ρw = vapor density or absolute humidity (g/cm3) ○ R = dry air gas constant ○ T = temperature (Kelvin) Dew Point Temperature (Td) – temperature that an air mass with constant pressure and moisture content becomes saturated
  • 17. Atmospheric Stability Adiabatic Lapse Rate (ALR) Rate of temperature change of air parcel with change in elevation Dry ALR = 9.8 oC/km Rate varies with moisture conditions Causes stable or unstable atmospheric conditions
  • 18. Cloud Types Cirrus – feathery or fibrous clouds Stratus – layered clouds Cumulus – towering, puffy clouds Alto – middle-level clouds Nimbus – rain clouds Cumulonimbus – thunderstorm clouds
  • 20. Precipitation Condensed water vapor that falls to earth Occurs when air parcel reaches saturation i.e. the Dew Point Temperature is reached Heat must be removed from moist air to allow for condensation Latent Heat Major energy source for storm systems
  • 21. Precipitation Formation Requires the following: 1. Moisture source 2. Lifting and resultant cooling 3. Phase change occurs with condensation onto small nuclei in the air ○ Range from 0.1 u – 10 u ○ Come from ocean salt, dust, etc 4. Droplets grow large enough to overcome drag and evaporation
  • 22. Lifting Mechanisms Precipitation often classified by vertical lifting Convective – Intense heating of the ground expansion and vertical rise of air Cyclonic – Movement of large air-mass systems (warm/cold fronts) Orographic – Mechanical lifting of moist air masses over the windward side of mountain ranges
  • 23. Thunderstorms Thunderstorms Heavy rainfall, thunder, lightning, hail Result from strong vertical movements or warm, moist air Generally occur due to instability caused by: ○ Low-pressure systems ○ Surface heating ○ Forced ascent over mountains
  • 24. Thunderstorm Stages Cumulus Stage Moist air rises, cools and condenses into cumulus clouds and continues to rise and condense ○ Updraft Mature Stage Rain begins to fall Surrounding dry air is drawn into storm, evaporates some drops and cools the air ○ Denser, cold air descends (downdraft) and creates cool gusts of wind at ground level
  • 25. Thunderstorm Stages (cont) Dissipating Stage When the updraft is cutoff Rate of precipitation decreases Downdrafts die-off Clouds dissolve
  • 26. Hurricanes Intense cyclonic storms Form over tropical oceans ○ Have localized names Hurricane (N. Americe) Cyclone (India) Typhoon (East Asia) Baguio (China Sea) Energy comes from the condensation of very warm, humid, tropical air Categorized by the Saffir-Simpson Hurricane Windscale
  • 27. Saffir-Simpson Wind Scale Category Wind Speed (mph) Extent of Damage Damage Description Tropical Storm 39 – 73 Minor Some flooding 1 74 – 95 Minimal Limited damage, unanchored mobile homes, trees 2 96 – 110 Moderate Some roof, door and window damage 3 111 – 130 Extensive Some structural damage to residences and utility buildings 4 131 – 155 Extreme Extensive curtainwall failures, complete roof failures, all signs blown down 5 156+ Catastrohpic Complete roof failure and some complete building failures
  • 28. Hydrology and Floodplain Analysis, Chapter 1.3
  • 29. Precipitation Trends Varies geographically Greater near coasts Greater on windward side of mountains ○ Western side in US Varies from season to season
  • 30. Rainfall Measurement Why measure rainfall? Water resource planning (annual) ○ California Water Project supplies water to Southern California from Northern California Urban drainage (hourly) ○ Reduce localized flooding ○ Need intensity and duration of rainfall ○ Spatial variation inside watershed
  • 31. Point Measurement Rainfall gage networks Maintained by NWS, USGS or local organizations Typical gauge design Methods of representation Accumulated total rainfall ○ “Cumulative mass curve” Rainfall Intensity vs. time ○ “Hyetograph”
  • 32. Areal Precipitation The average depth of precipitation over a specific area (watershed) Use point measurements to determine avg. Three Methods Arithmetic Mean Thiessen Polygon Method Isohyetal Method
  • 33. Arithmetic Mean Takes arithmetic mean of rainfalls from available gages Not accurate for large areas with variable distribution Only works if gages are uniformly distributed
  • 34. Thiessen Polygon Method Areal weighting of rainfall for each gage Series of polygons created by lines connecting eat gauge and perpendicular bisectors Uses ratio of polygon area to total area of interest Most widely used method
  • 35. Isohyetal Method Draw contours of equal precipitation based on gauge data Uses area between each contour Needs an extensive gauge network Most accurate method
  • 36. Next-Generation Radar (NEXRAD) Allows for measurement of rainfall rates and cumulative totals Aided flood prediction Specs 10-cm wave length Records ○ Reflectivity ○ Radial Velocity ○ Spectrum width
  • 37. Hydrology and Floodplain Analysis, Chapter 1.4-1.5
  • 38. The Watershed Def: Contiguous area that drains to an outlet, specifically in regards to precipitation Basic hydrologic unit within which all measurements, calculations and predictions are made
  • 39. Water Balance I – Q = (dS/dt) I = Inflow (L3/t) Q = outflow (L3/t) dS/dt = change in storage (L3/t) Volume out of watershed = (flow rate)*(time) OR (depth)*(watershed area)
  • 40. Water Balance P – R – G – E – T = ∆S P = Precipitation R = Surface Runoff G = Groundwater Flow E = Evaporation T = Transpiration ∆S = Change in Storage Water balance for each area is different Characteristics of the area alter how water leaves watershed or basin
  • 41. 1. Rainfall intensity and duration 2. Size, Slope, Shape, Soil, Storage 3. Channel morphology 4. Location of Developments 5. Land use and cover 6. Soil type 7. Percent impervious Divide Floodplain Reservoir Natural stream Urban Concrete channel Parameters that Affect Response in a Watershed Floodplain
  • 42. Rainfall Runoff Want to develop relationship of rainfall minus losses vs. runoff for flood control Allows hydrologists to determine flood conditions based upon rainfall totals
  • 43. Rainfall Runoff Rational Method Simplest rainfall-runoff formulas QP = CiA ○ QP = peak flow (cfs) ○ C = runoff coefficient, varies with land use ○ i = rainfall intensity (in/hr) for a duration equal to time of concentration (tc) ○ tc = time for a wave of water to propagate from the most distant point of a watershed to the outlet ○ A = area of watershed (acres)
  • 44. Hydrology and Floodplain Analysis, Chapter 1.6-1.7
  • 45. Hydrographs Plot of flow rate vs. time Measured at a given stream cross section Mainly used to describe stream flow response from rainfall Watershed characteristics affect the shape i.e. urbanization
  • 46. Time Area Histogram Computes hydrograph response for a watershed Breaks water shed into distinct areas (Ai), have equal travel time to outlet Uses rainfall periods (Pi) Rainfall from P1 in A2 reaches the outlet at the same time at P2 in A1
  • 47. Hydrographs – Broken Down Typically characterized by: Base Flow Rising Limb ○ Increase in flow Crest Segment ○ Peak flow rate Recession Curve ○ Decrease in flow Inflection Point ○ Point where direct runoff ends
  • 48. Hydrograph Analysis Total storm hydrograph is made up of Base Flow and Direct runoff Base Flow Comes from ground water in absence of rainfall Relatively small in urban environments Direct Runoff (DRO) Discharge caused by rainfall after infiltration losses have been subtracted “Rainfall Excess”
  • 49. Hydrograph Analysis How to separate Base Flow from DRO Recession curves ○ qt = q0e-kt q0 = specified initial discharge qt = discharge at a later time, t k = recession constant Create these for each area of interest More of an art than a science
  • 50. Hydrograph Analysis Hydrograph peak Occurs when all areas contribute flow to the outlet Dependent on watershed geography, storm intensity/duration Developed area ○ Higher, quicker peak flow Natural, wooded area ○ Lower, slower peak
  • 51. Hydrograph Analysis Response to rainfall Duration of rainfall is often shorter than time base of hydrograph Peak flow does NOT correspond to peak rainfall Volume of water under hydrograph should equal volume of precipitation minus base flow and loses
  • 52. Hydrograph Analysis Infiltration and response Rainfall (i) lose to infiltration (f) depends on ○ Soil Moisture Storage (SD) ○ Field Capacity (F) Amount of water in a soil after gravity has drained it If i < f ○ No overland runoff; all rainfall infiltrates If i > f ○ Overland flow occurs ϕ Index is simplest infiltration method ○ (gross precipitation) – (observed surface runoff)
  • 53. Hydrograph Analysis Infiltration and response Horton Infiltration Method ○ When rainfall rate > infiltration rate, water infiltrates at a rate that decreases ϕ Index is simplest infiltration method ○ (gross precipitation) – (observed surface runoff) ○ Often underestimates losses at beginning INSERT FIGURE 1-28 HERE
  • 54. Hydrograph Analysis Net vs. Gross rainfall Gross Rainfall = depression storage + evaporation + infiltration + surface runoff Rainfall Excess = DRO = gross rainfall – infiltration + depression storage
  • 55. Hydrology and Floodplain Analysis, Chapter 1.8
  • 56. Measurement Process 1. Sensing rainfall Transforms intensity to measurement 2. Recording the data 3. Transmitting to central location 4. Translating data 5. Editing or checking for errors 6. Storing in database 7. Retrieving for further use
  • 57. Measurement Devices Barometer Atmospheric pressure Psychrometer Relative Humidity Gages Precipitation Radar Rainfall rates
  • 58. Evaporation Measurement Evaporation is a major path of water lose Rates vary location to location Important to know rates for large-scale water resource projects Use instruments to measure rate in area Class A pan
  • 59. Infiltration Measurement Small Scale: Ring Infiltrometer 2 ft. diameter ring driven into soil Water is dumped into ring Rate of infiltration is measured as water level drops Large Scale: actual measurements (Gross Rainfall) – (Direct Runoff from hydrograph)
  • 60. Streamflow Measurement What’s measured Stage ○ Water elevation above datum ○ Floating or bubbling gages Use rating curves to determine discharge USGS must locate these at sites that are accessible and have flow rates that relate to depth
  • 61. Rating Curves Relate stage to flow rate at a cross section Must be developed to determine discharge Site specific Created through actual measurements of velocity at different stages Use procedure that takes velocity measurements at different depths at different parts of the section