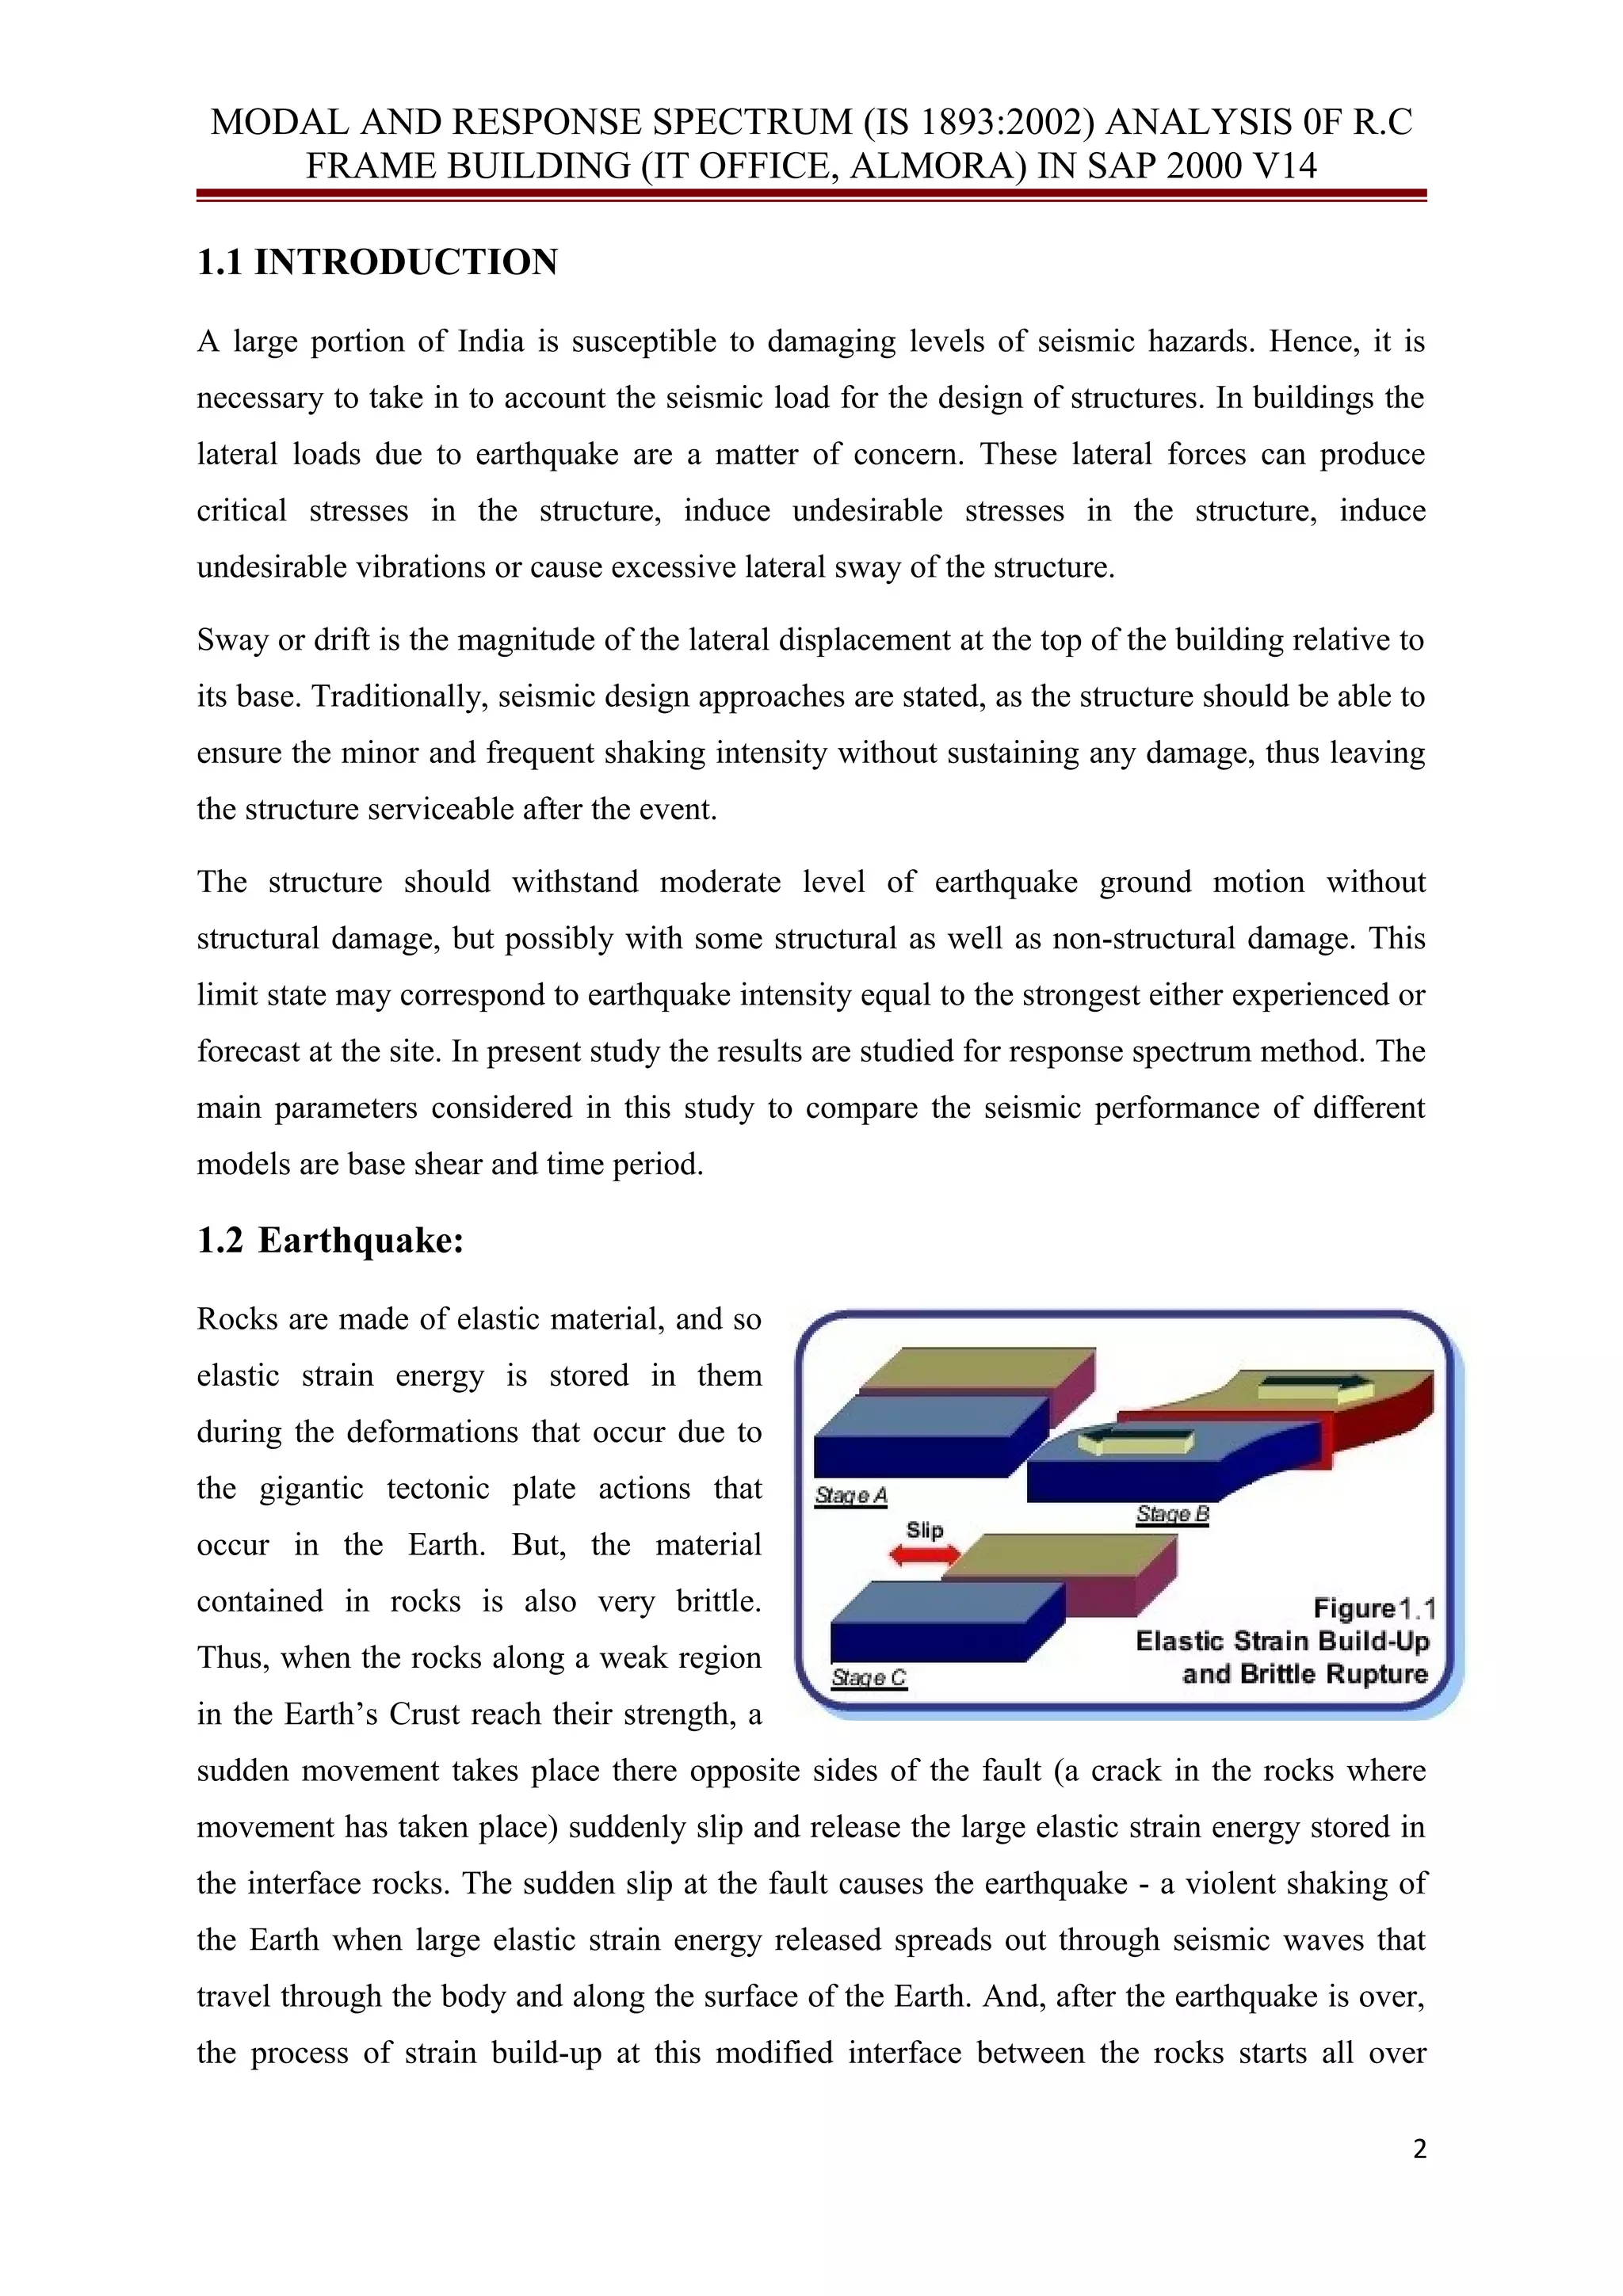
This document discusses modeling a reinforced concrete frame building for seismic analysis. It describes modeling the building using frame elements in SAP 2000. Key elements include:
- Modeling beams and columns as frame elements
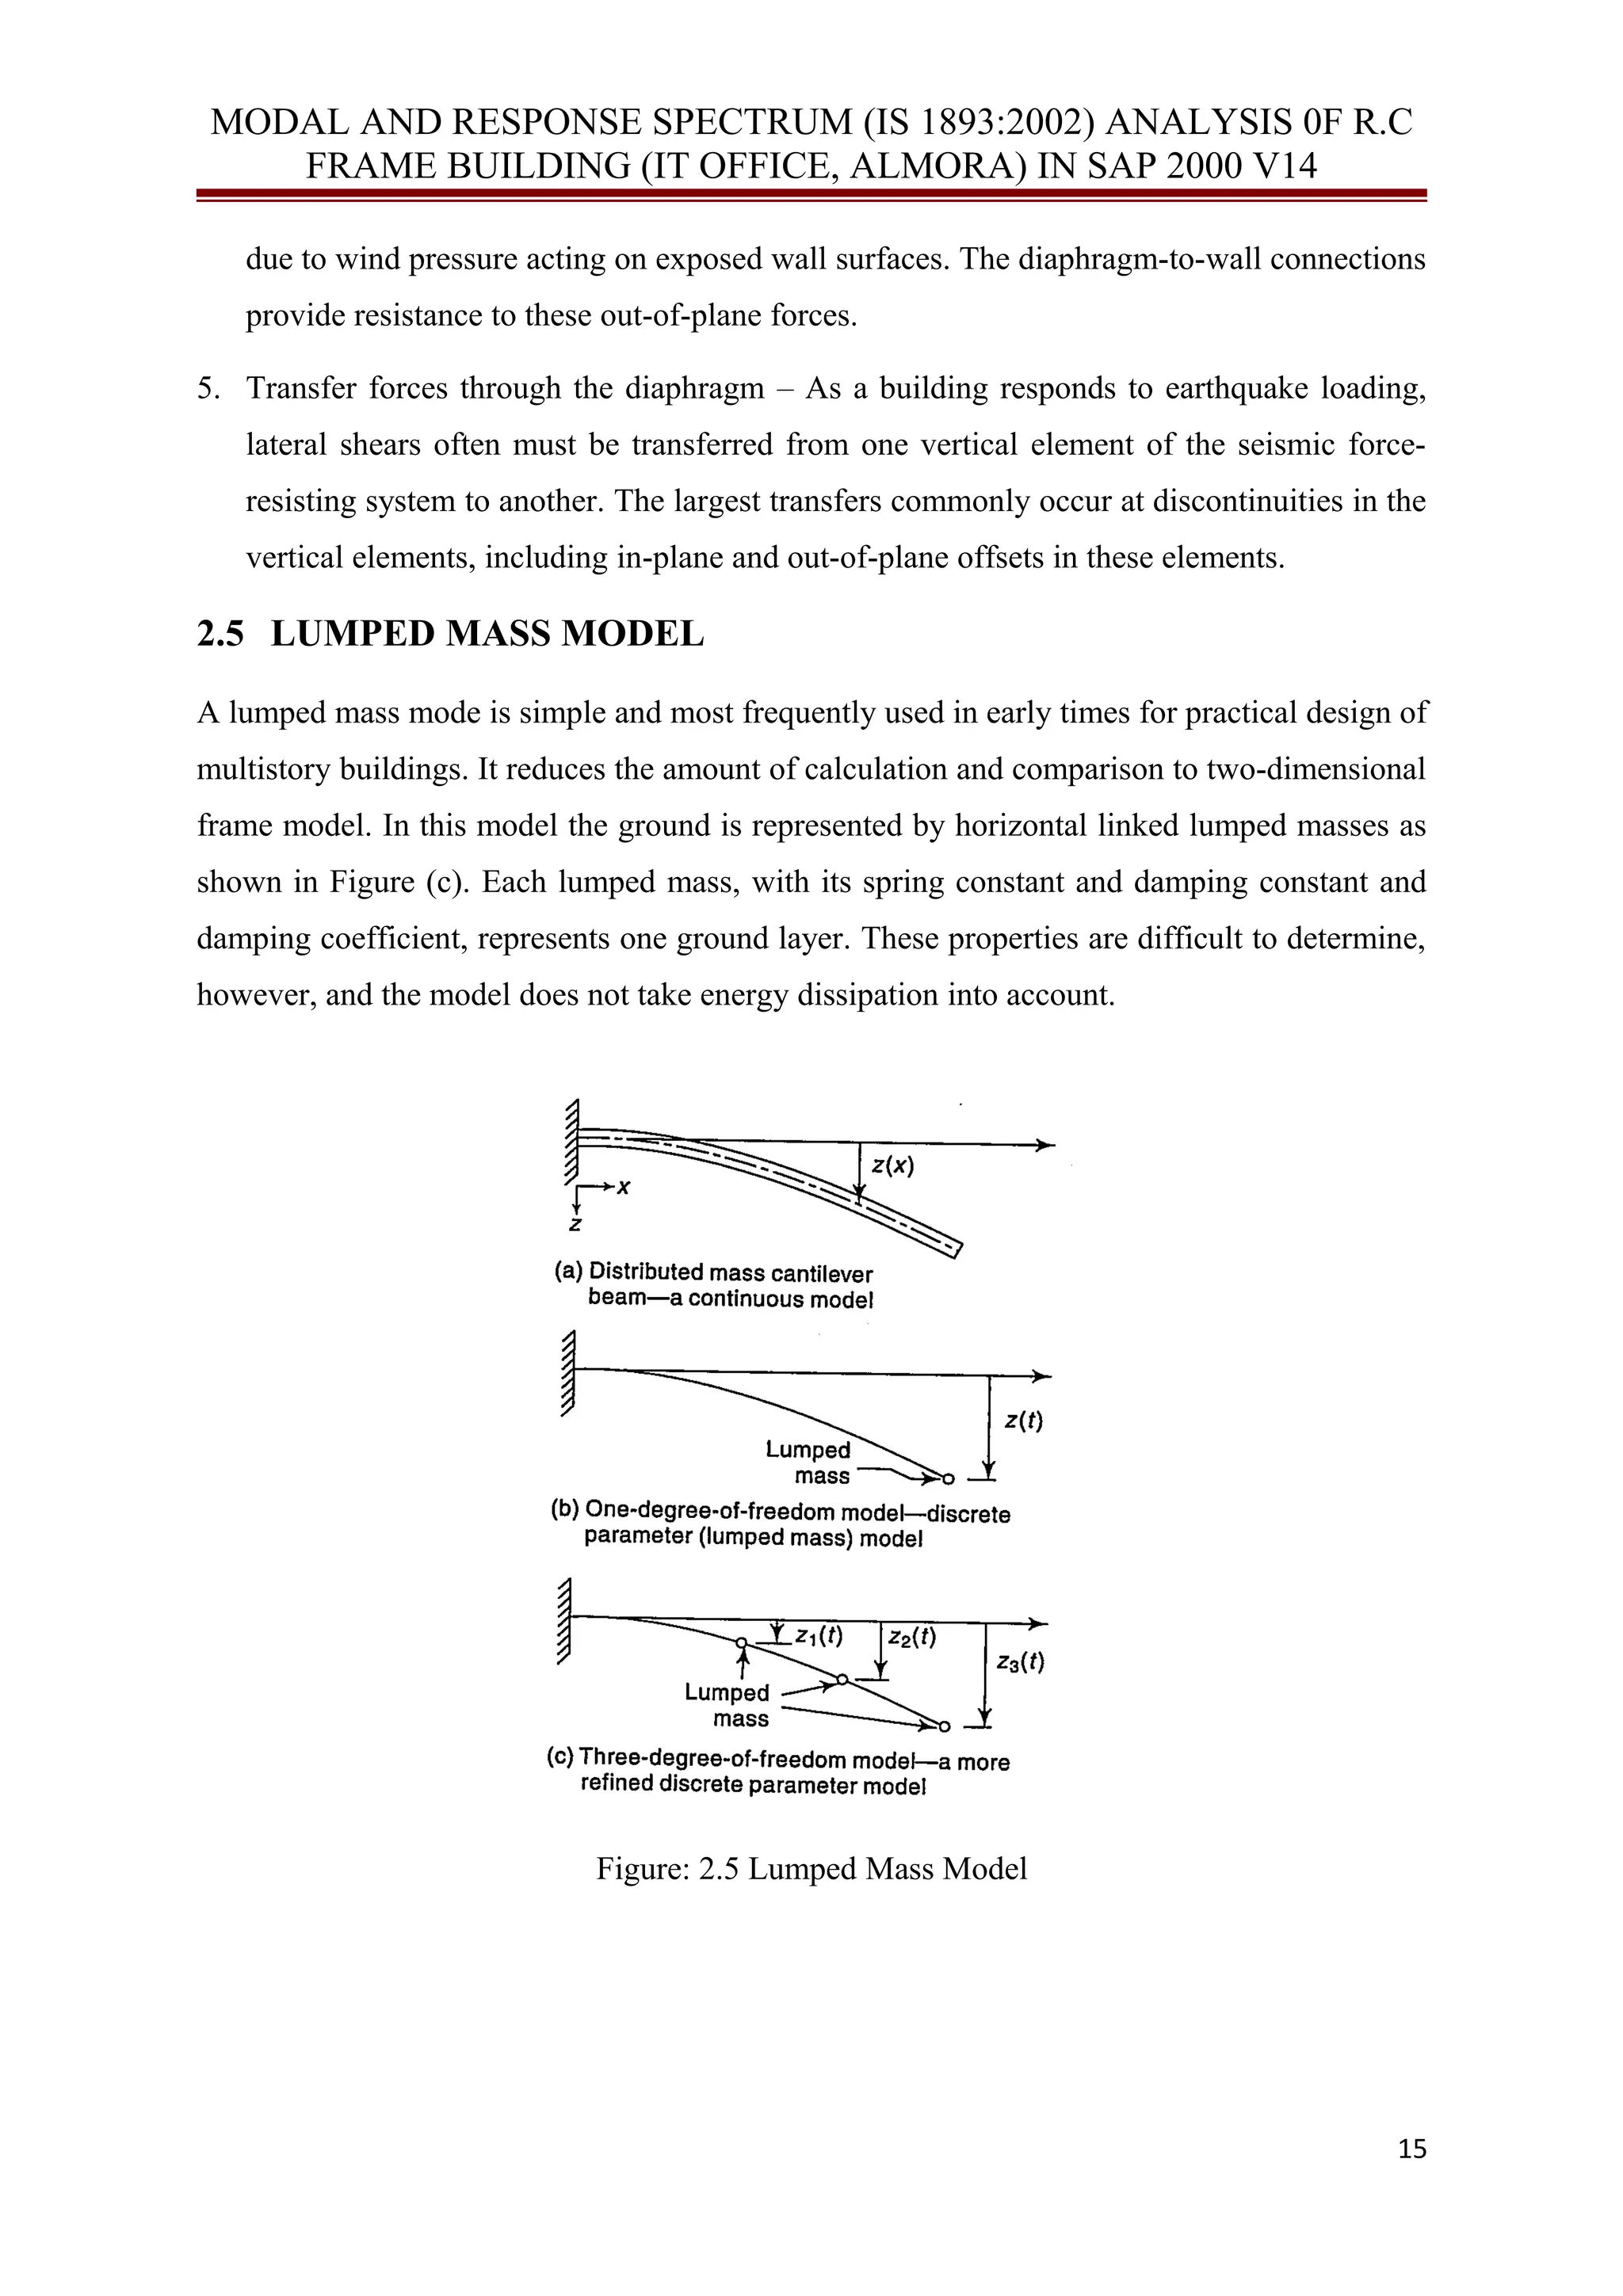
- Considering the building's diaphragm, which can be rigid, semi-rigid, or flexible
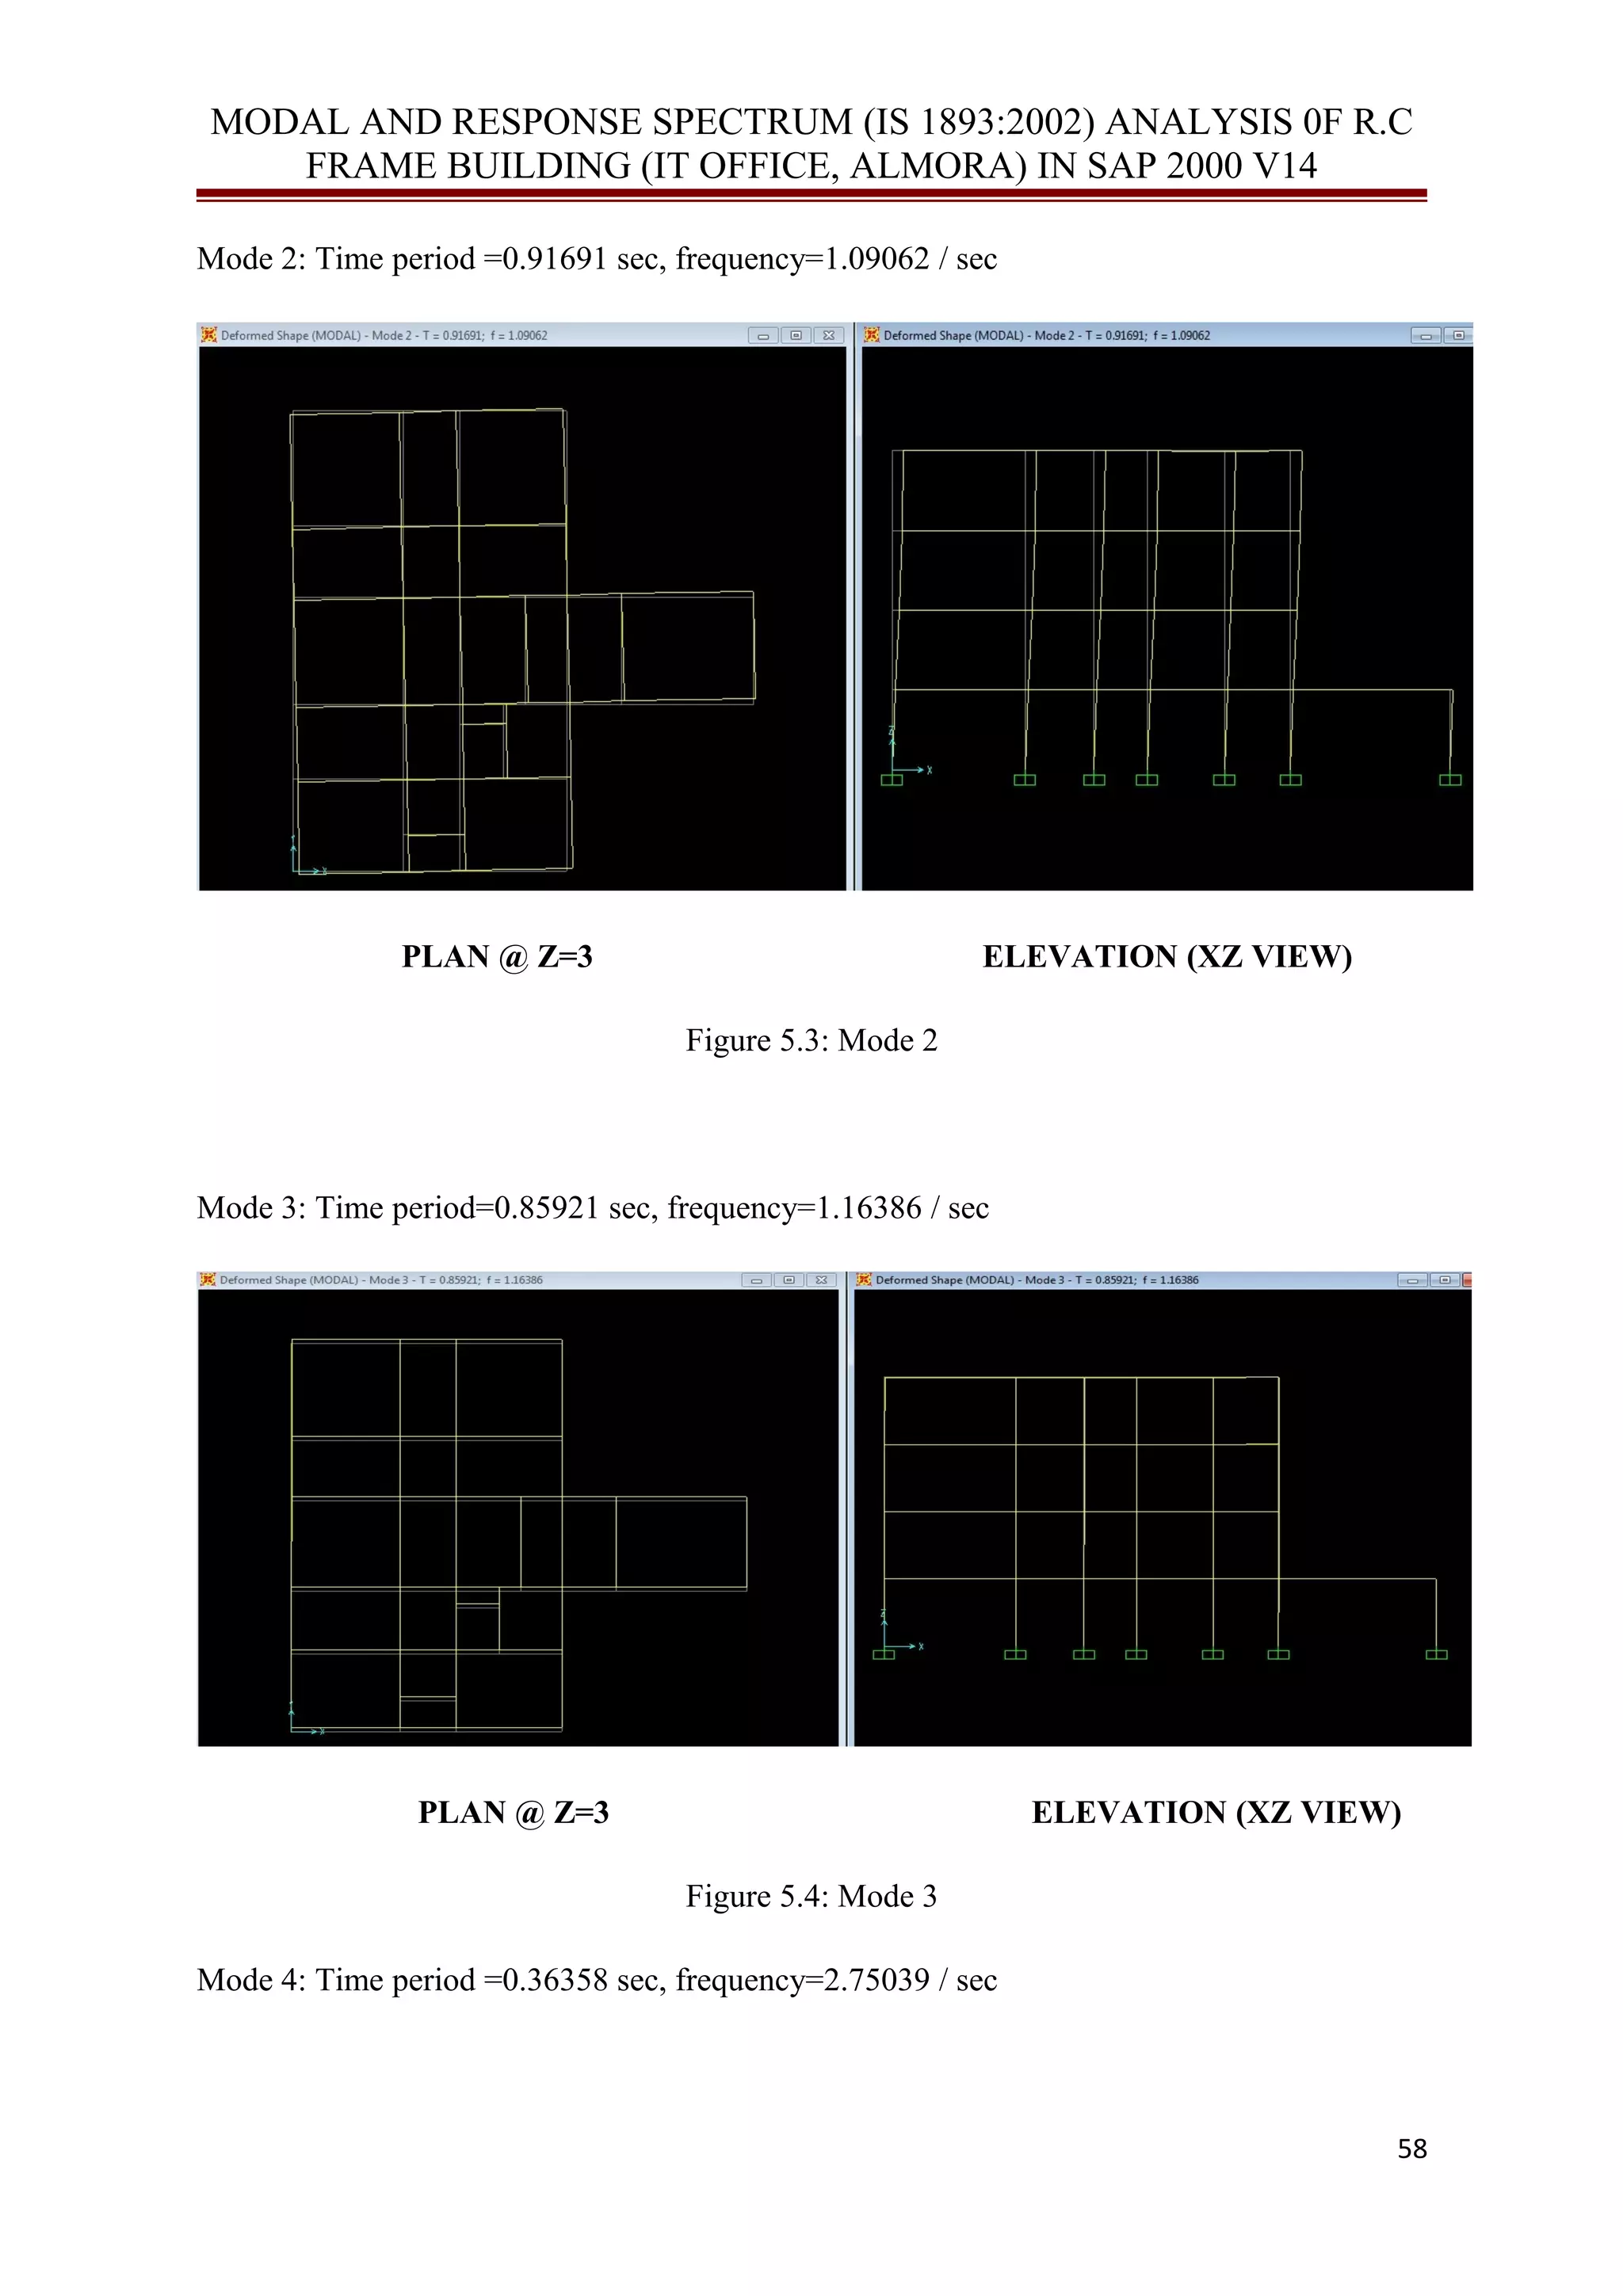
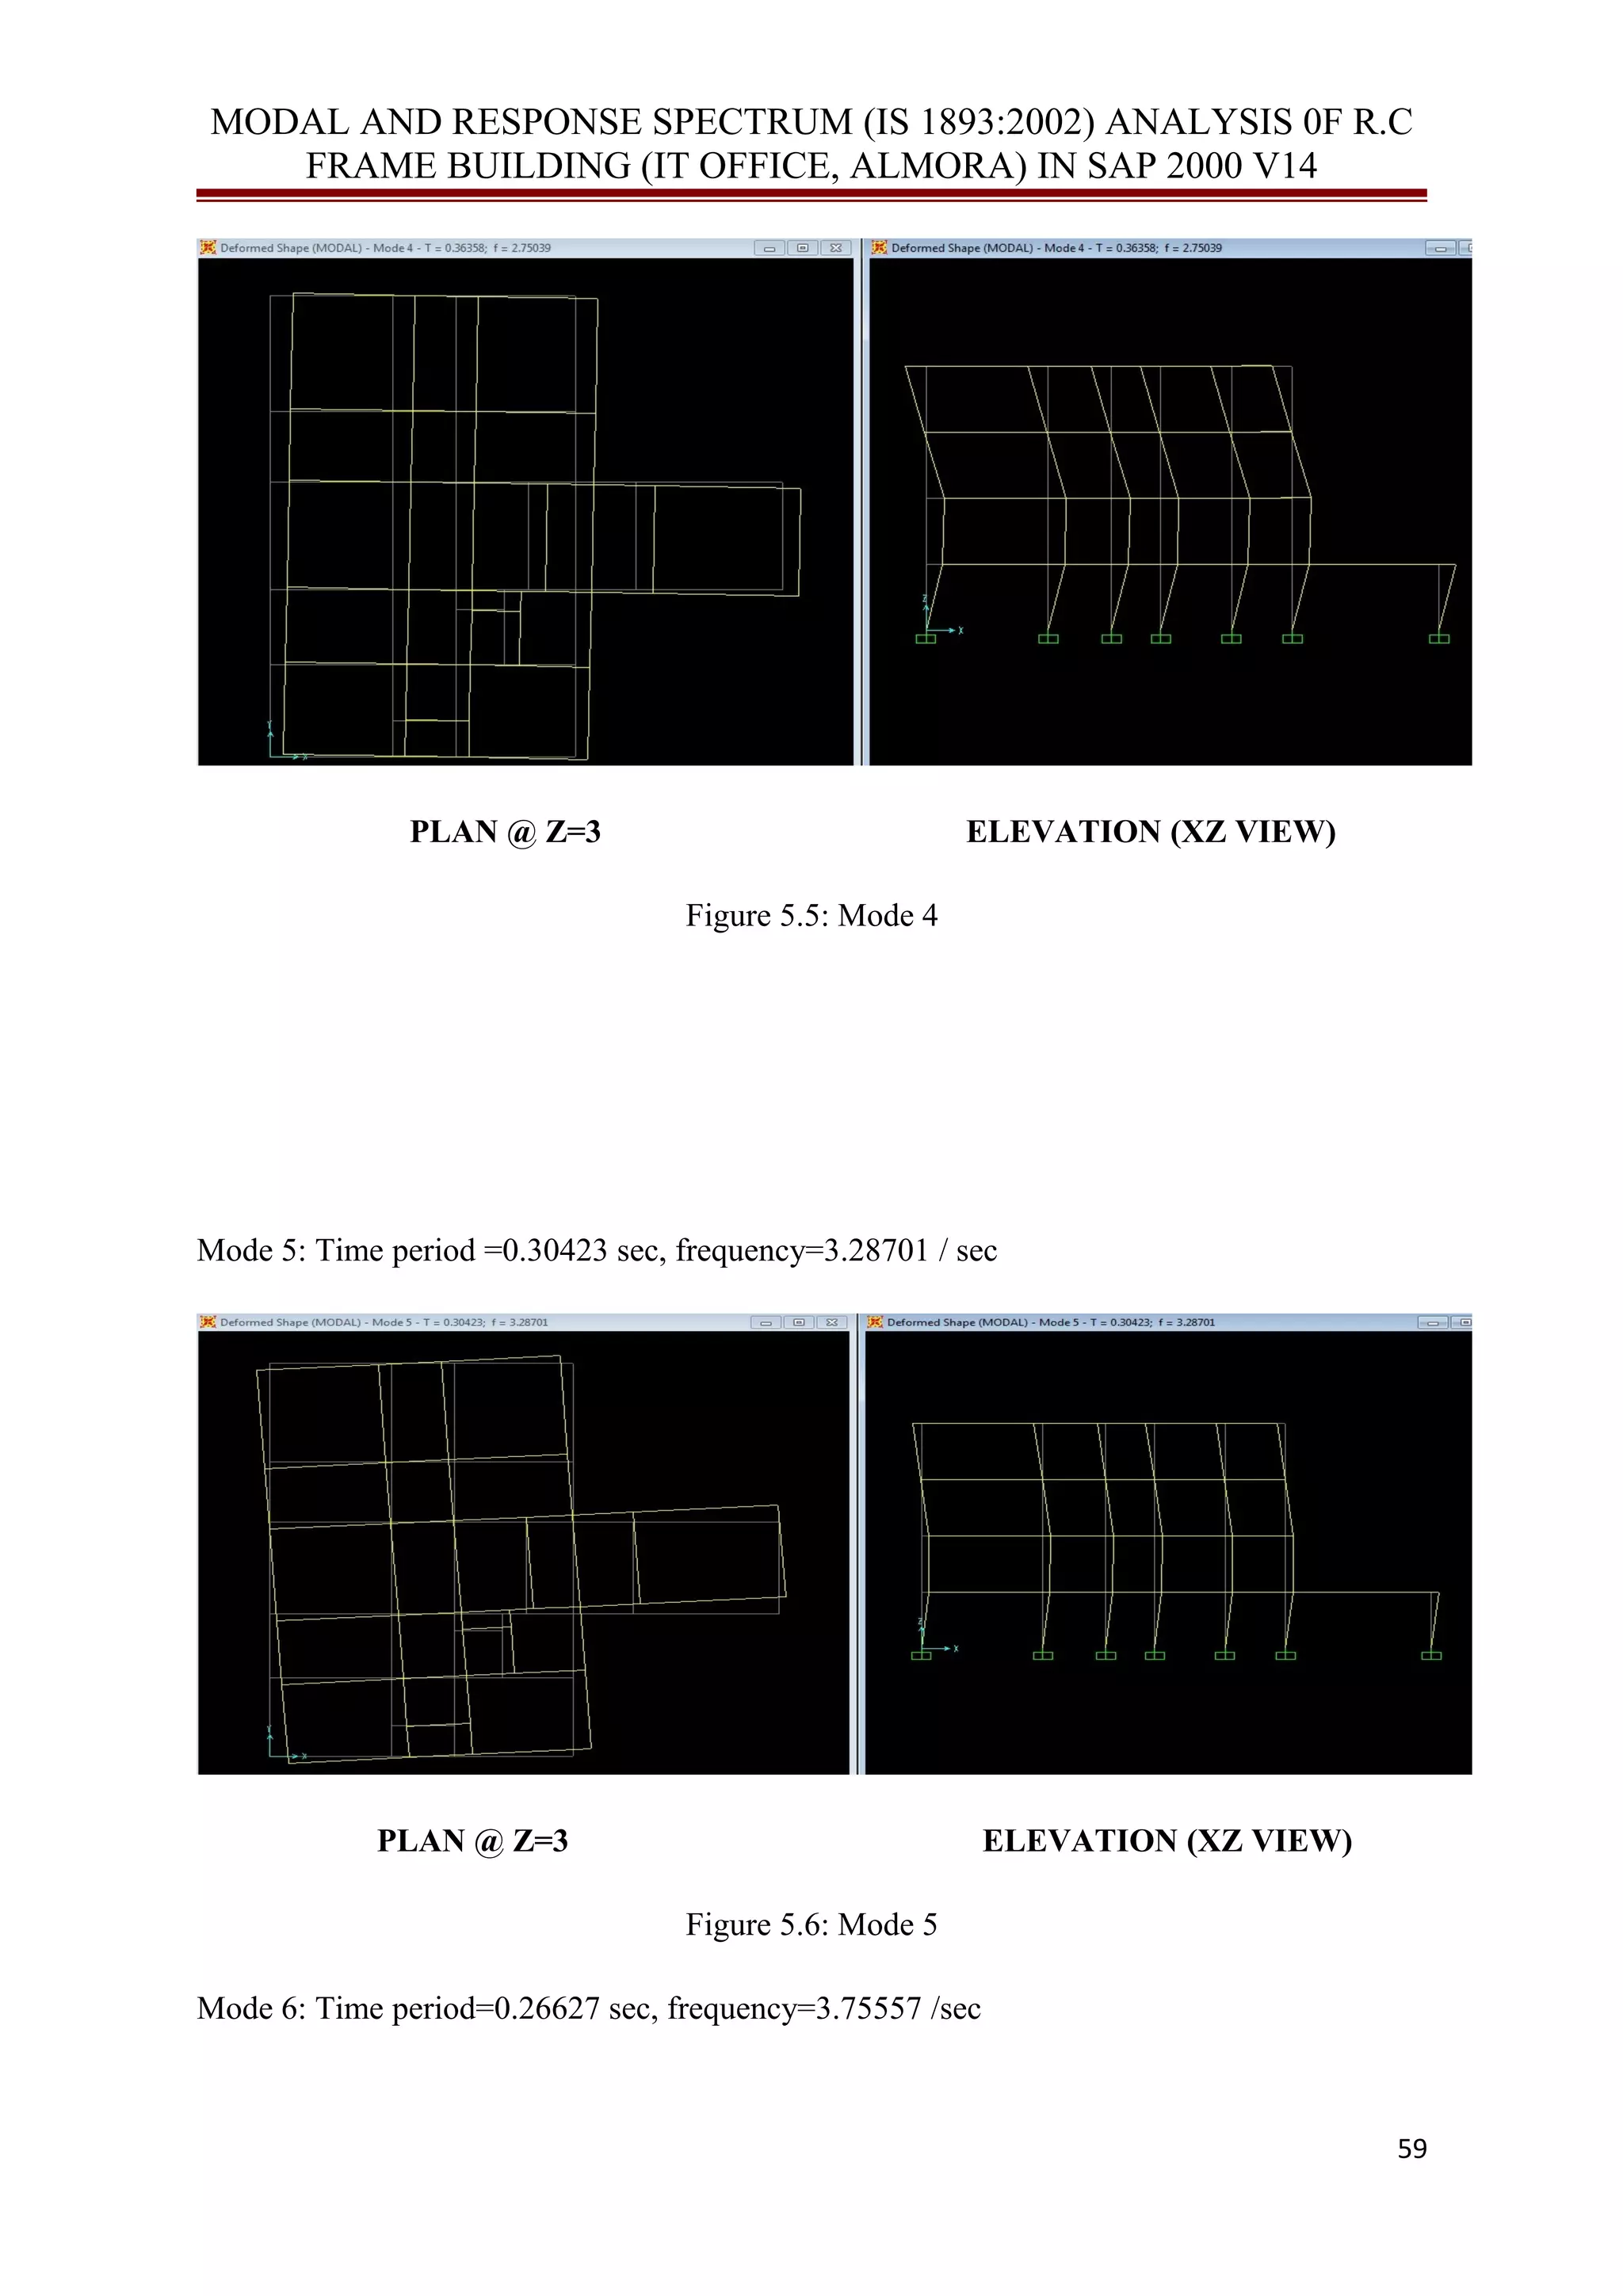
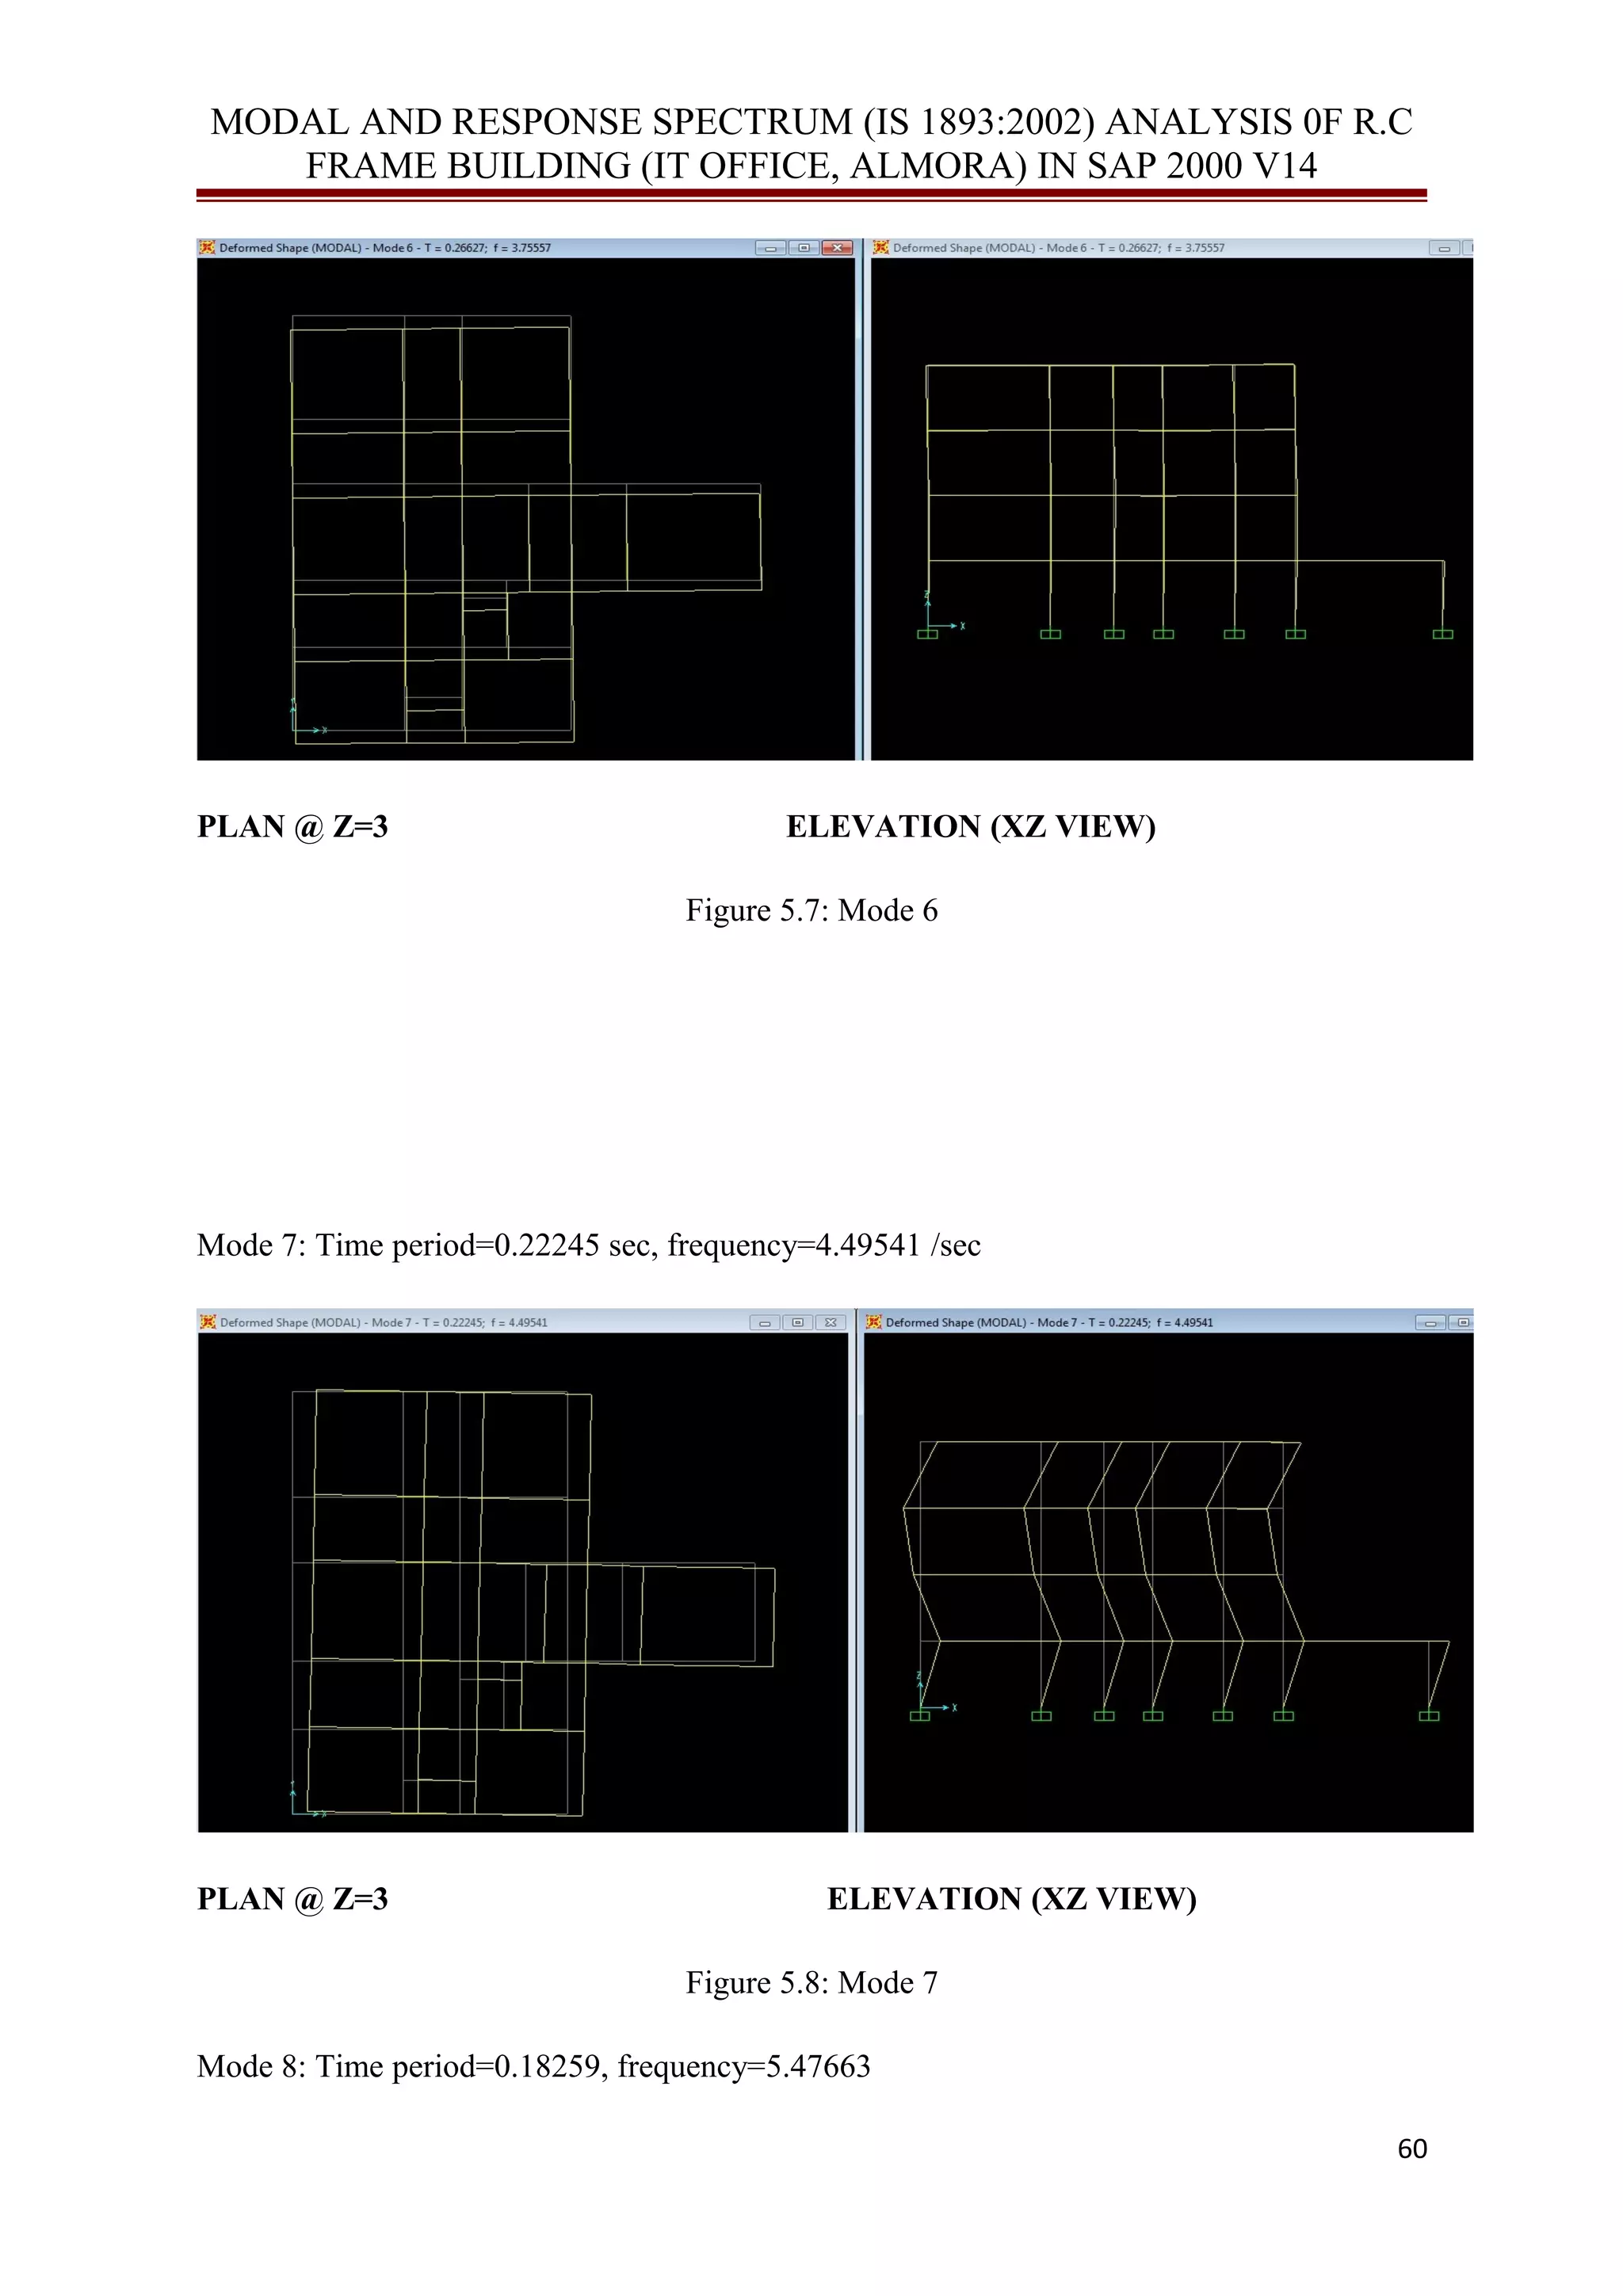
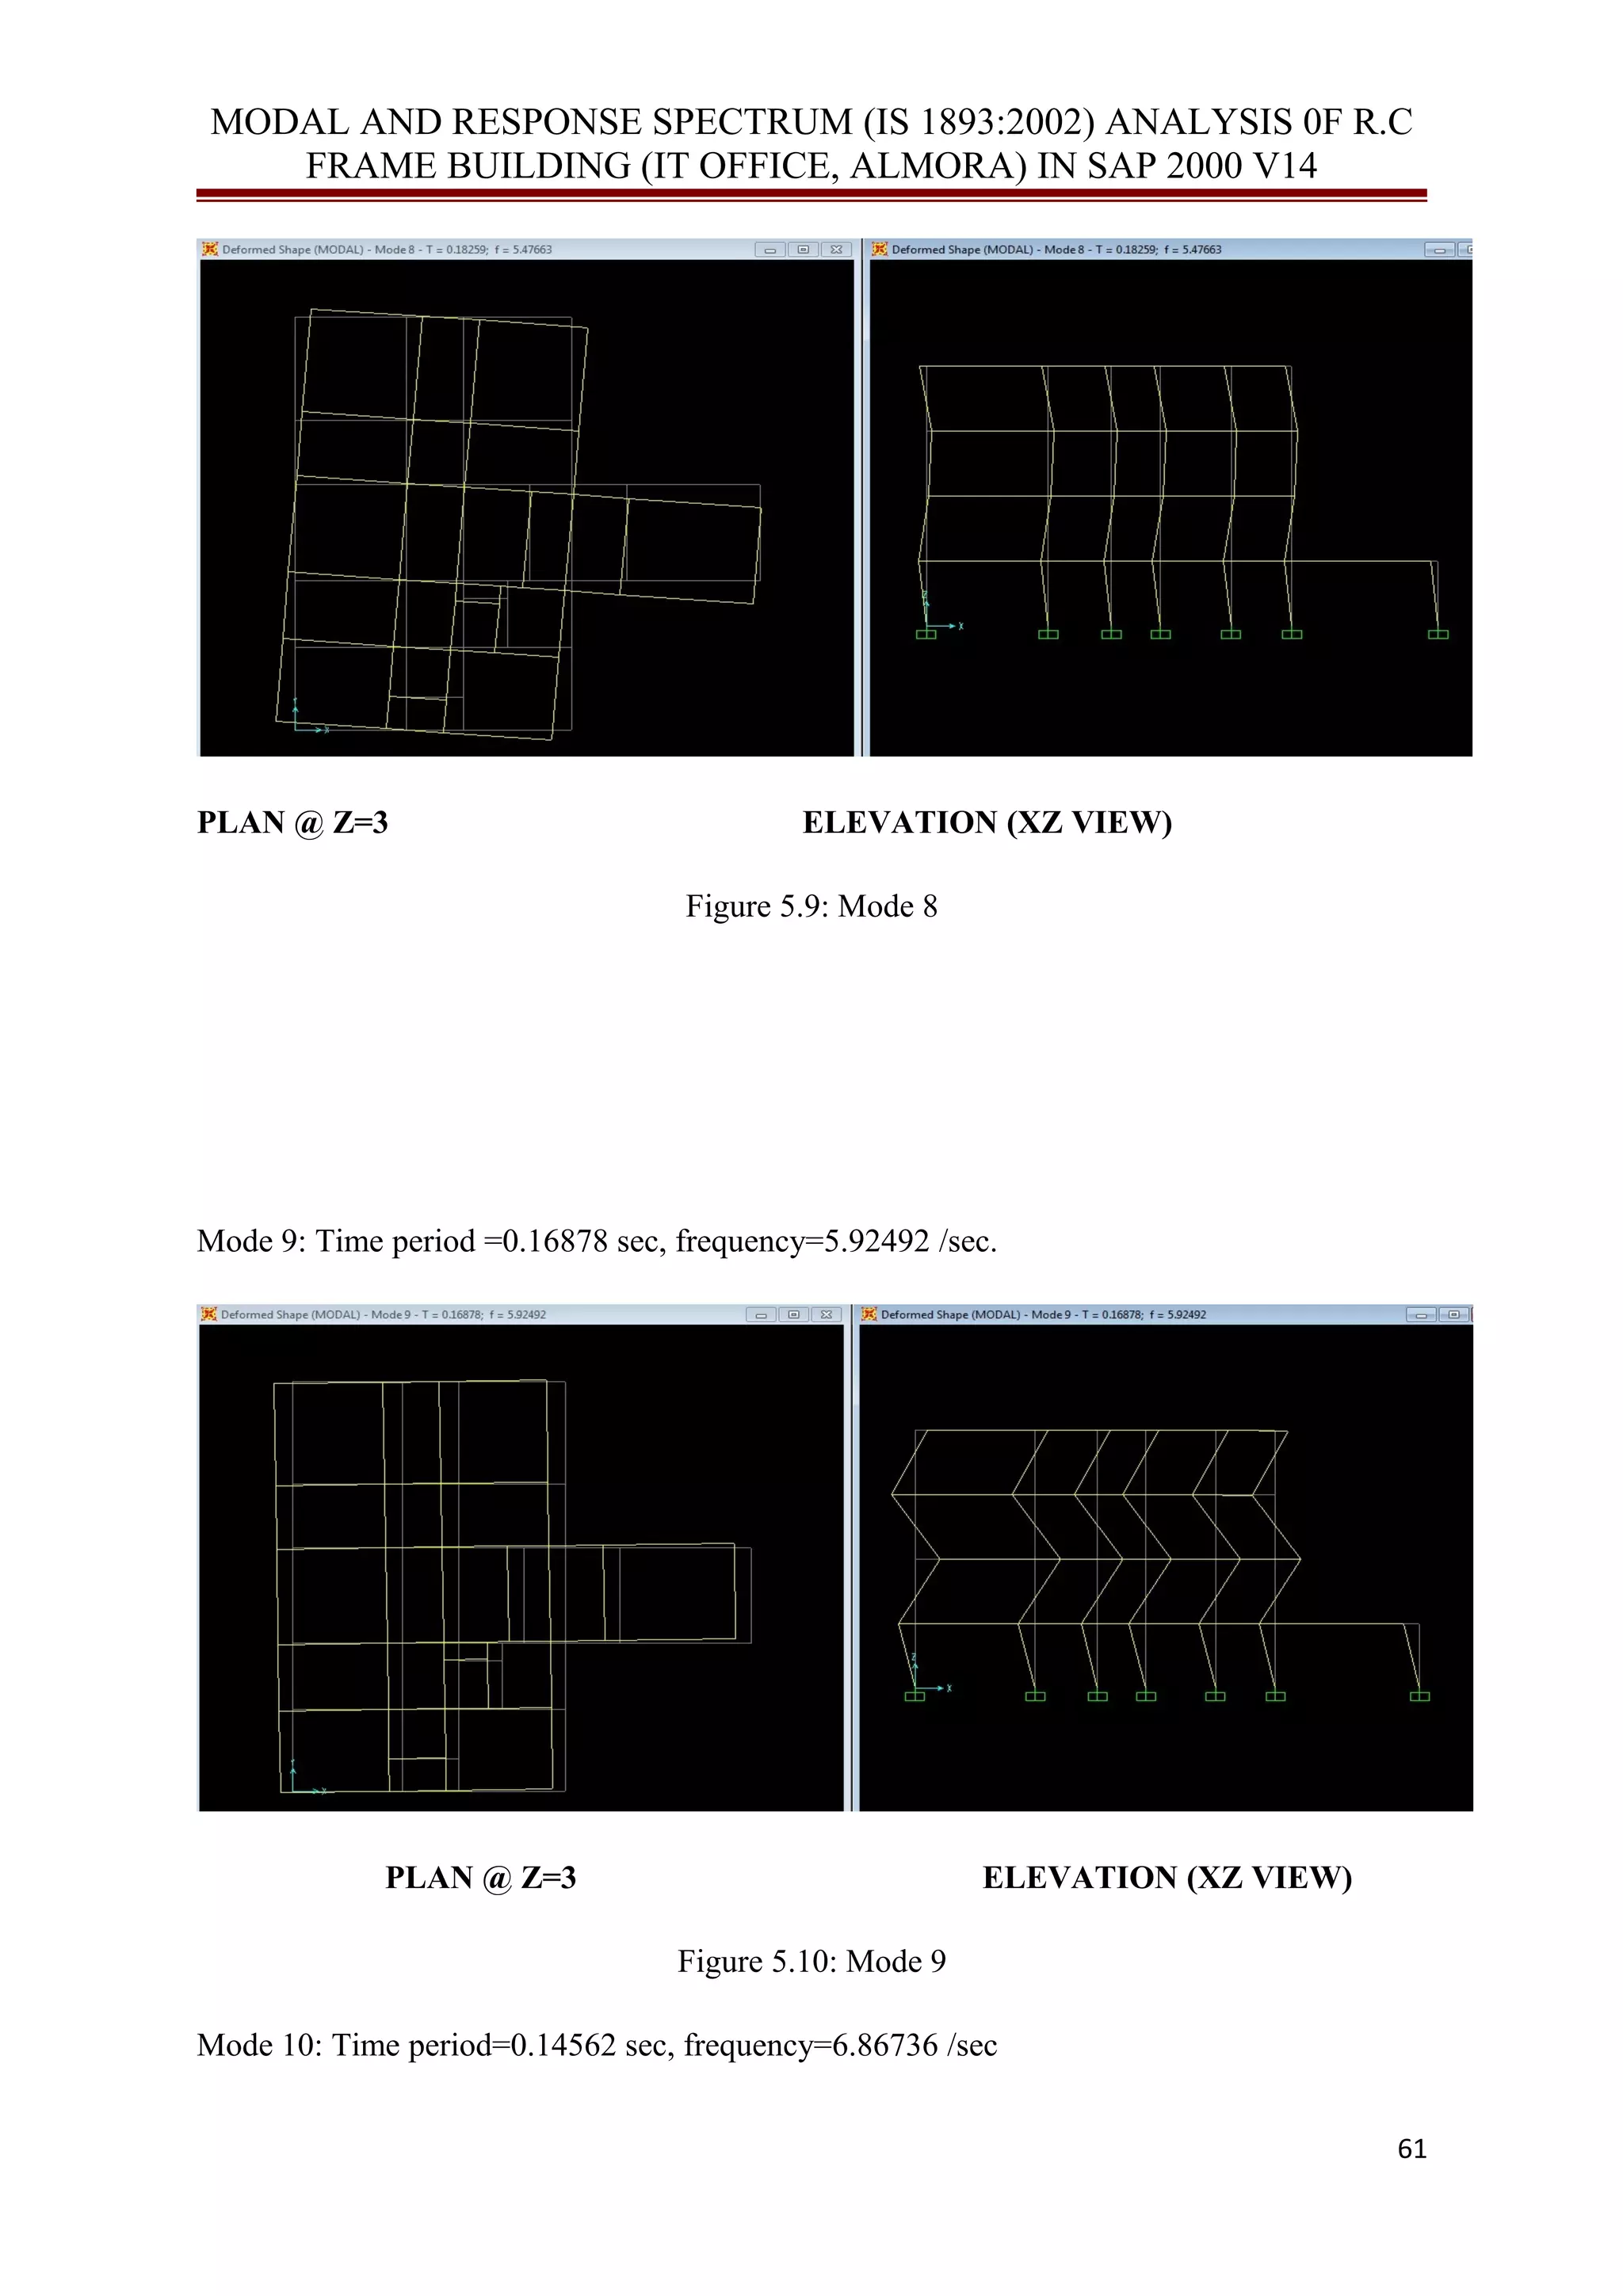
- Performing modal analysis to determine the building's vibration modes and periods
- Conducting response spectrum analysis and comparing results to the equivalent lateral force method


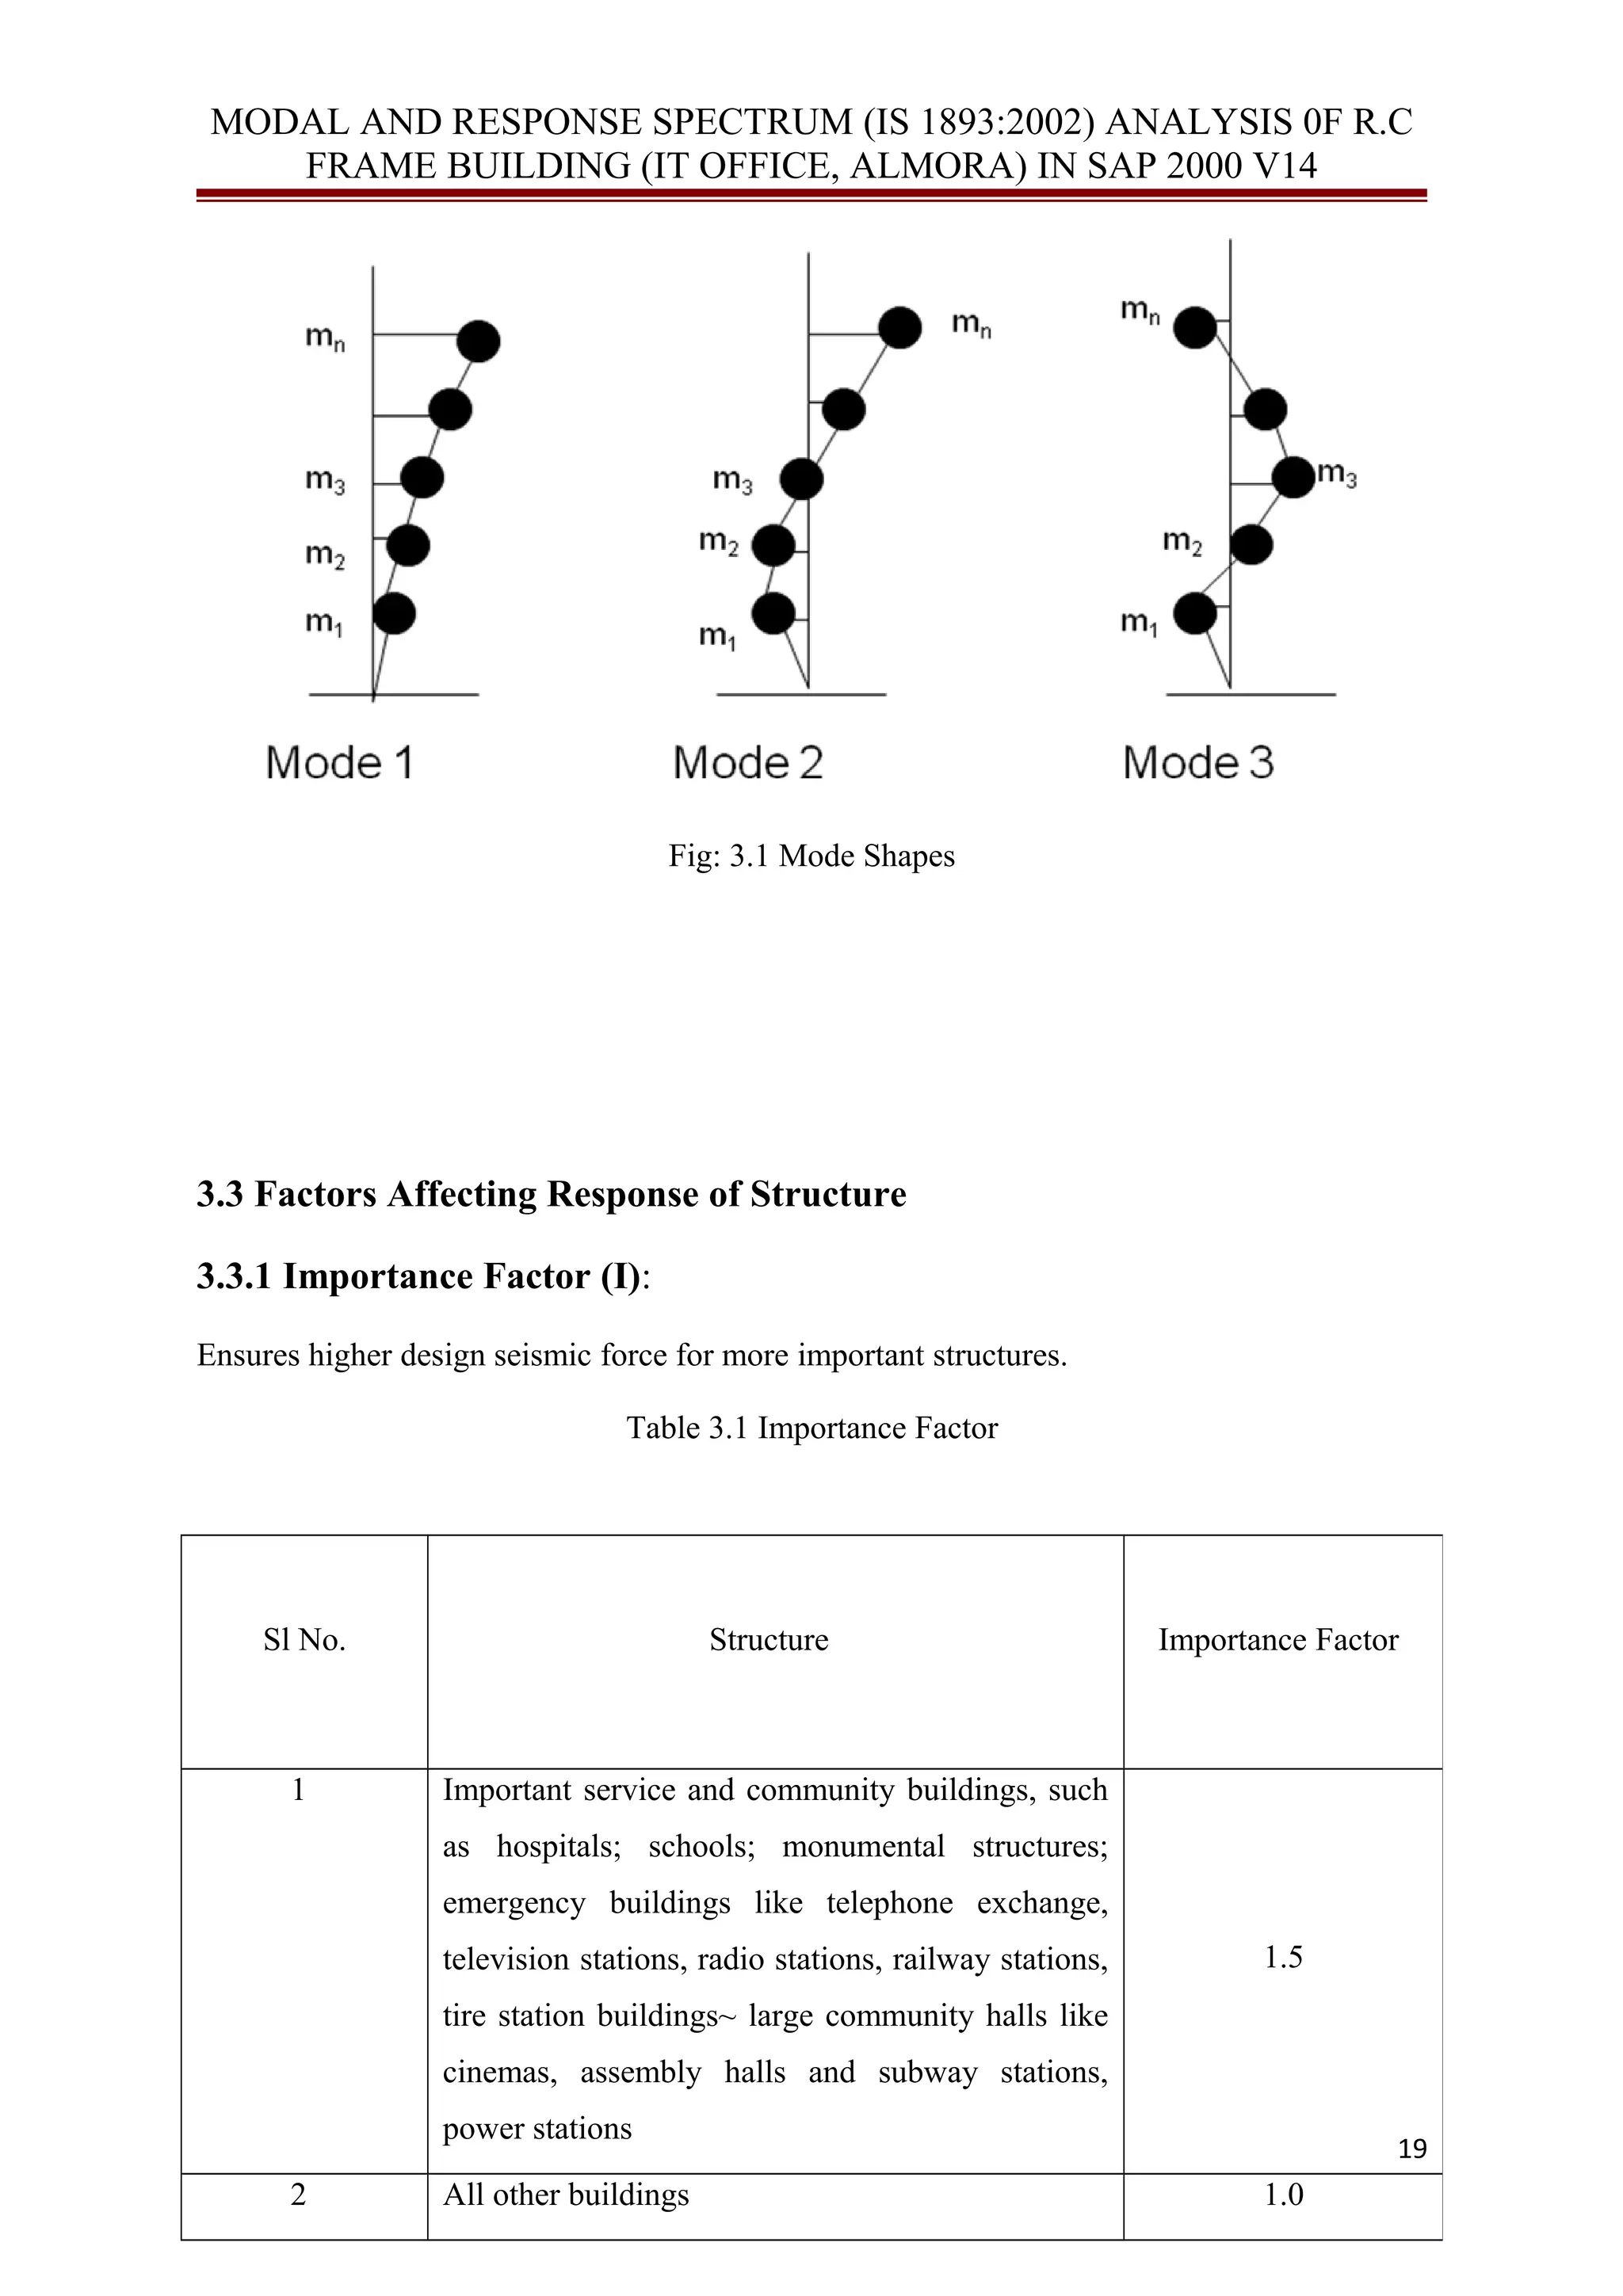
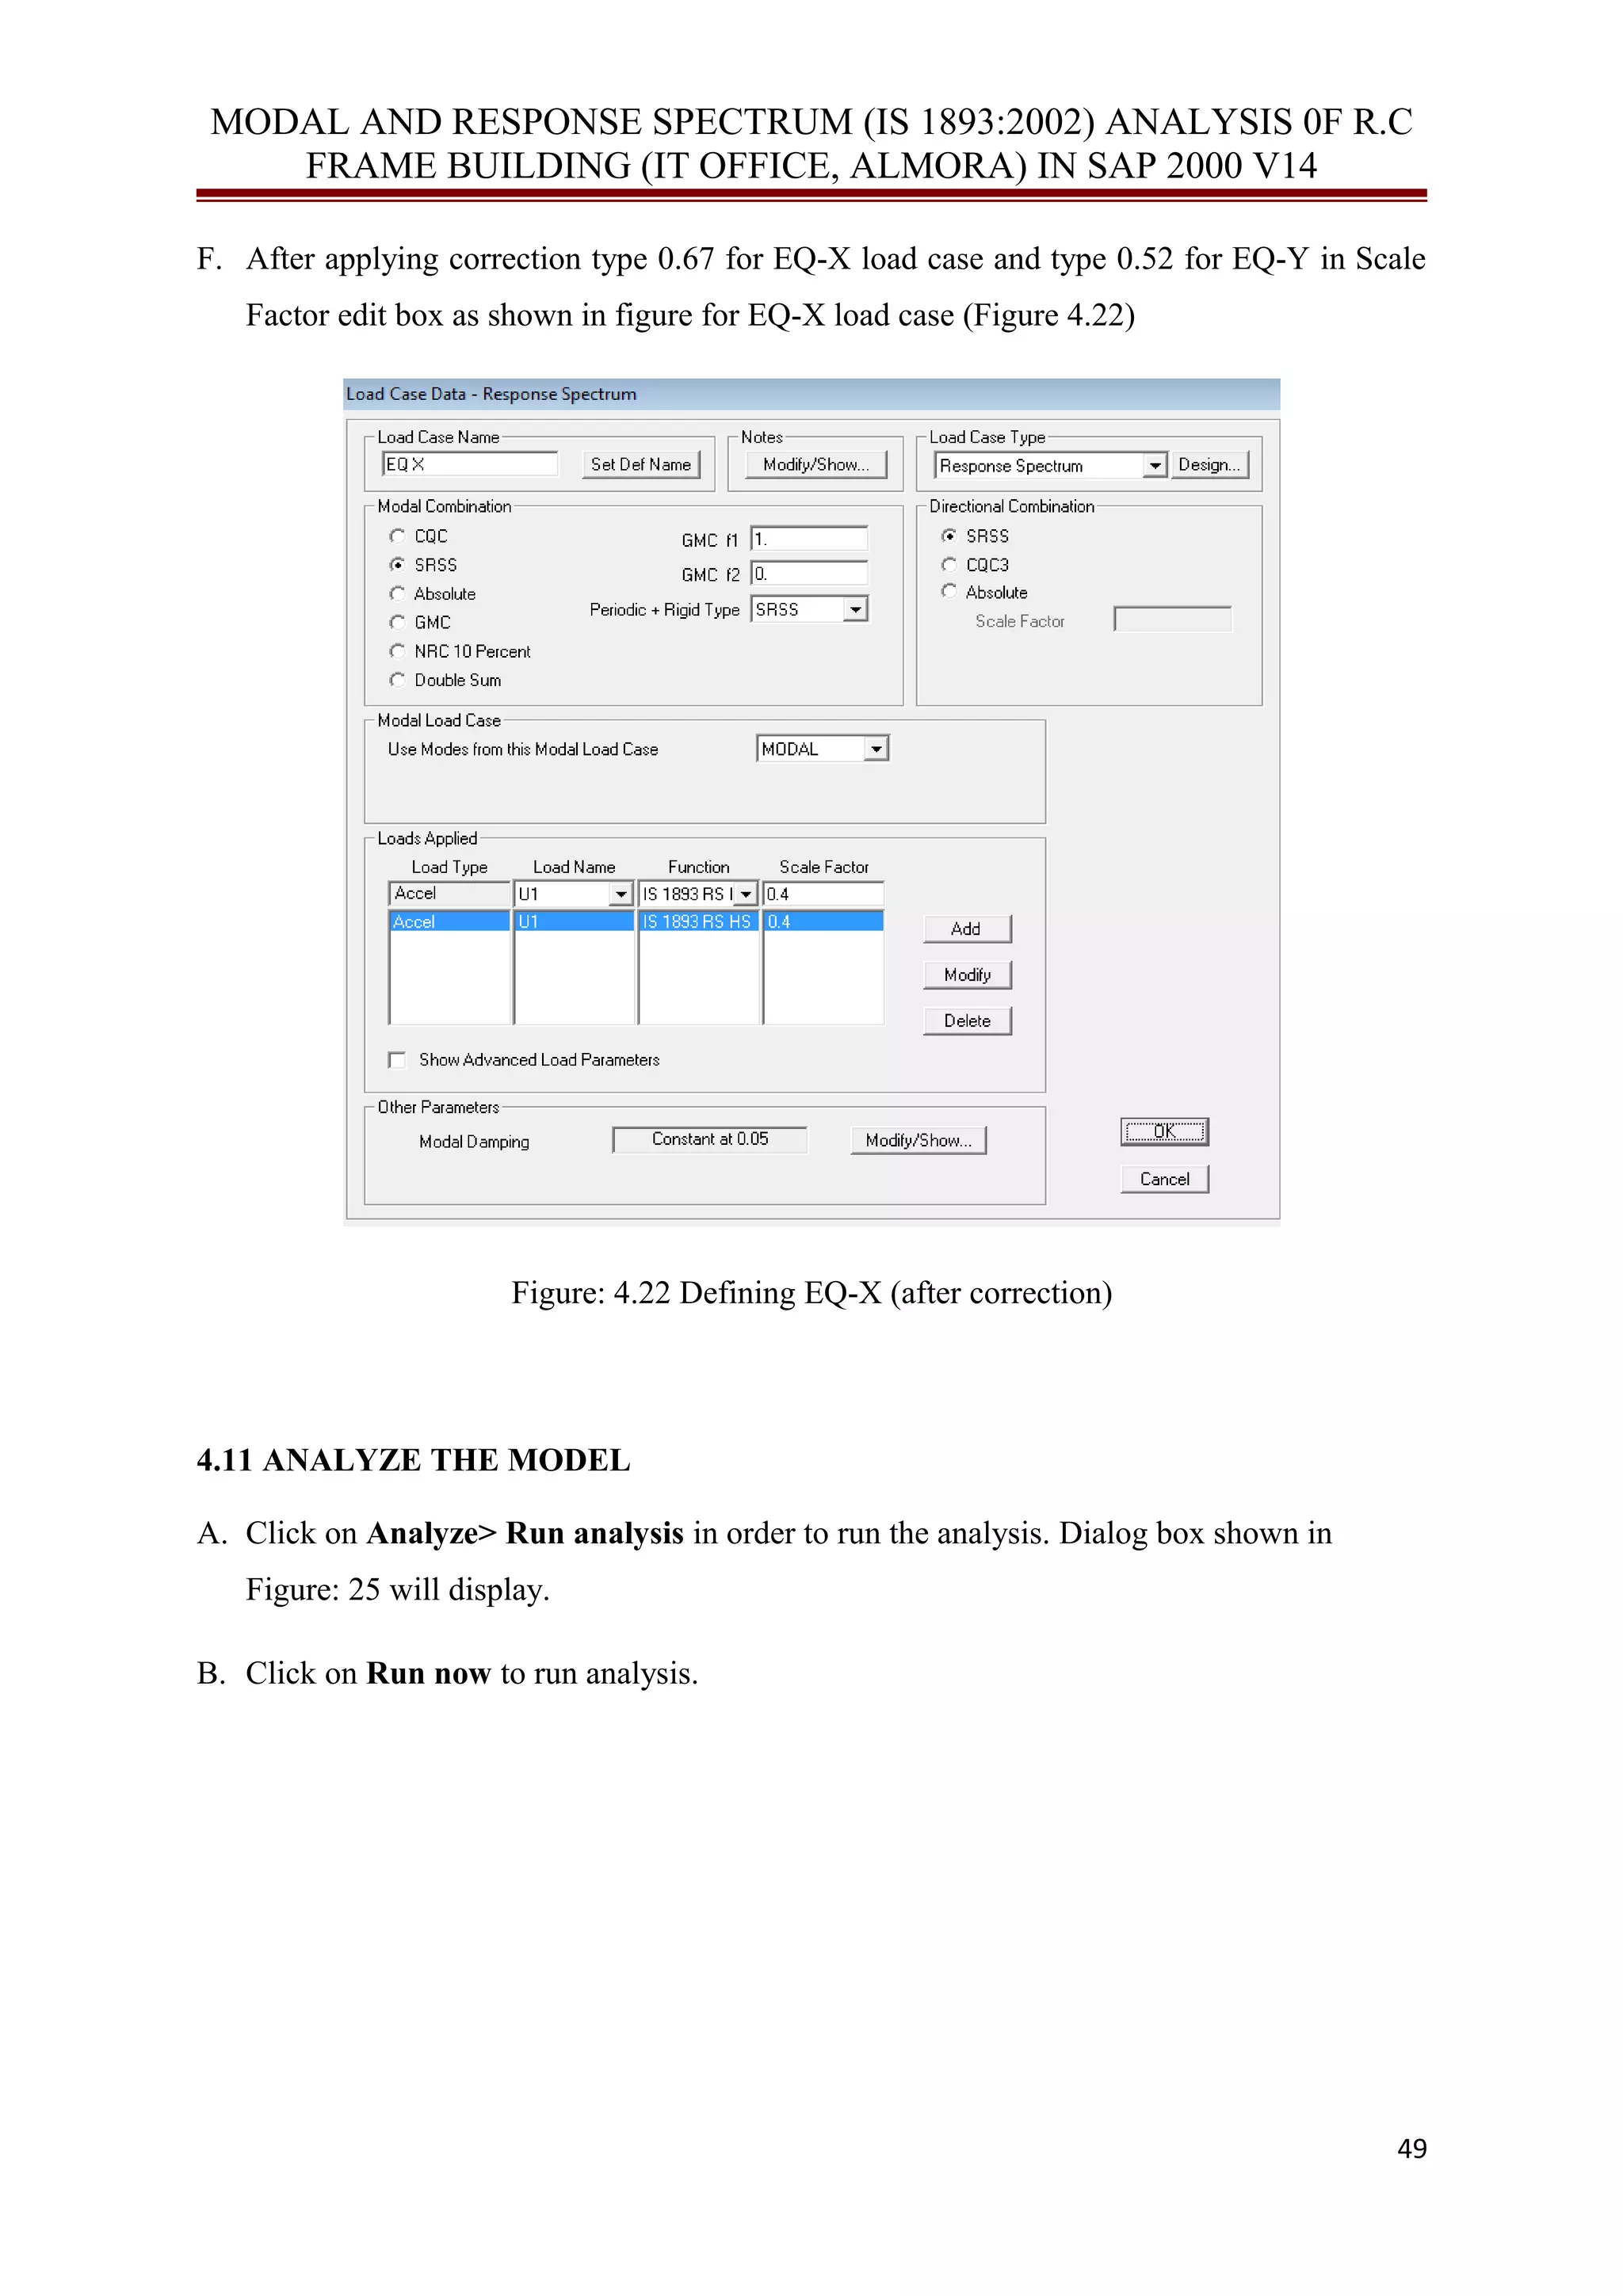
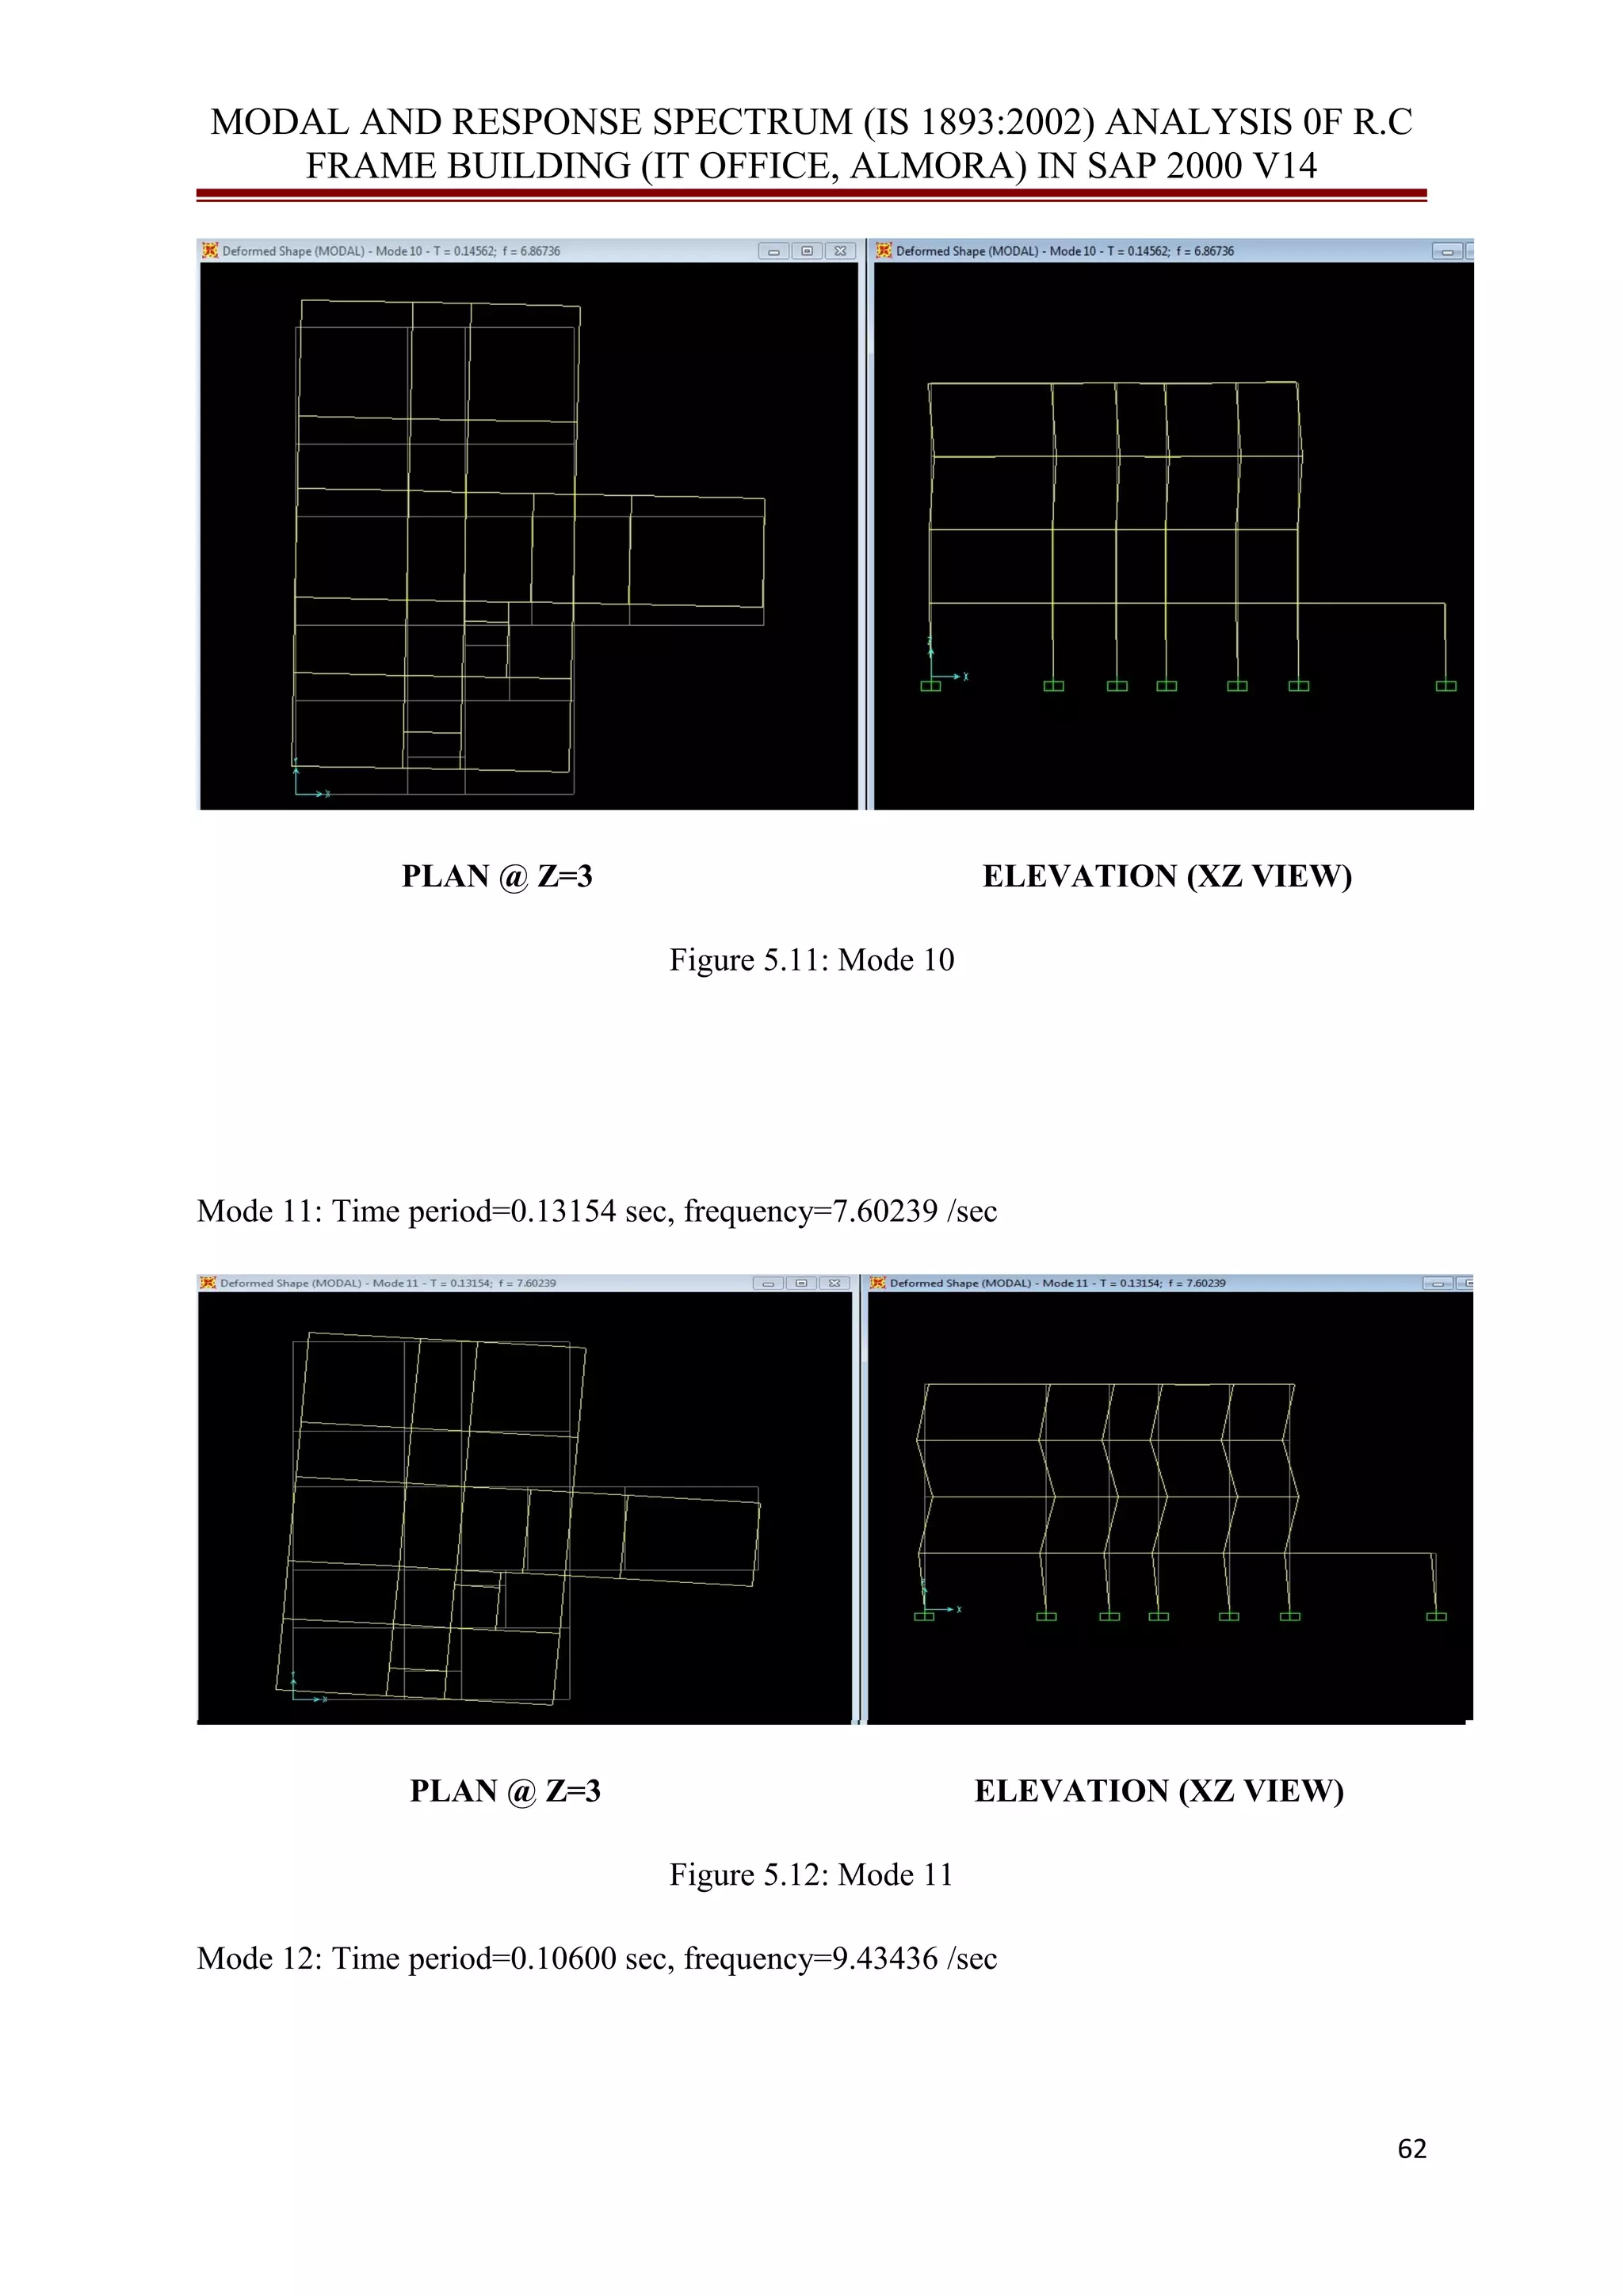
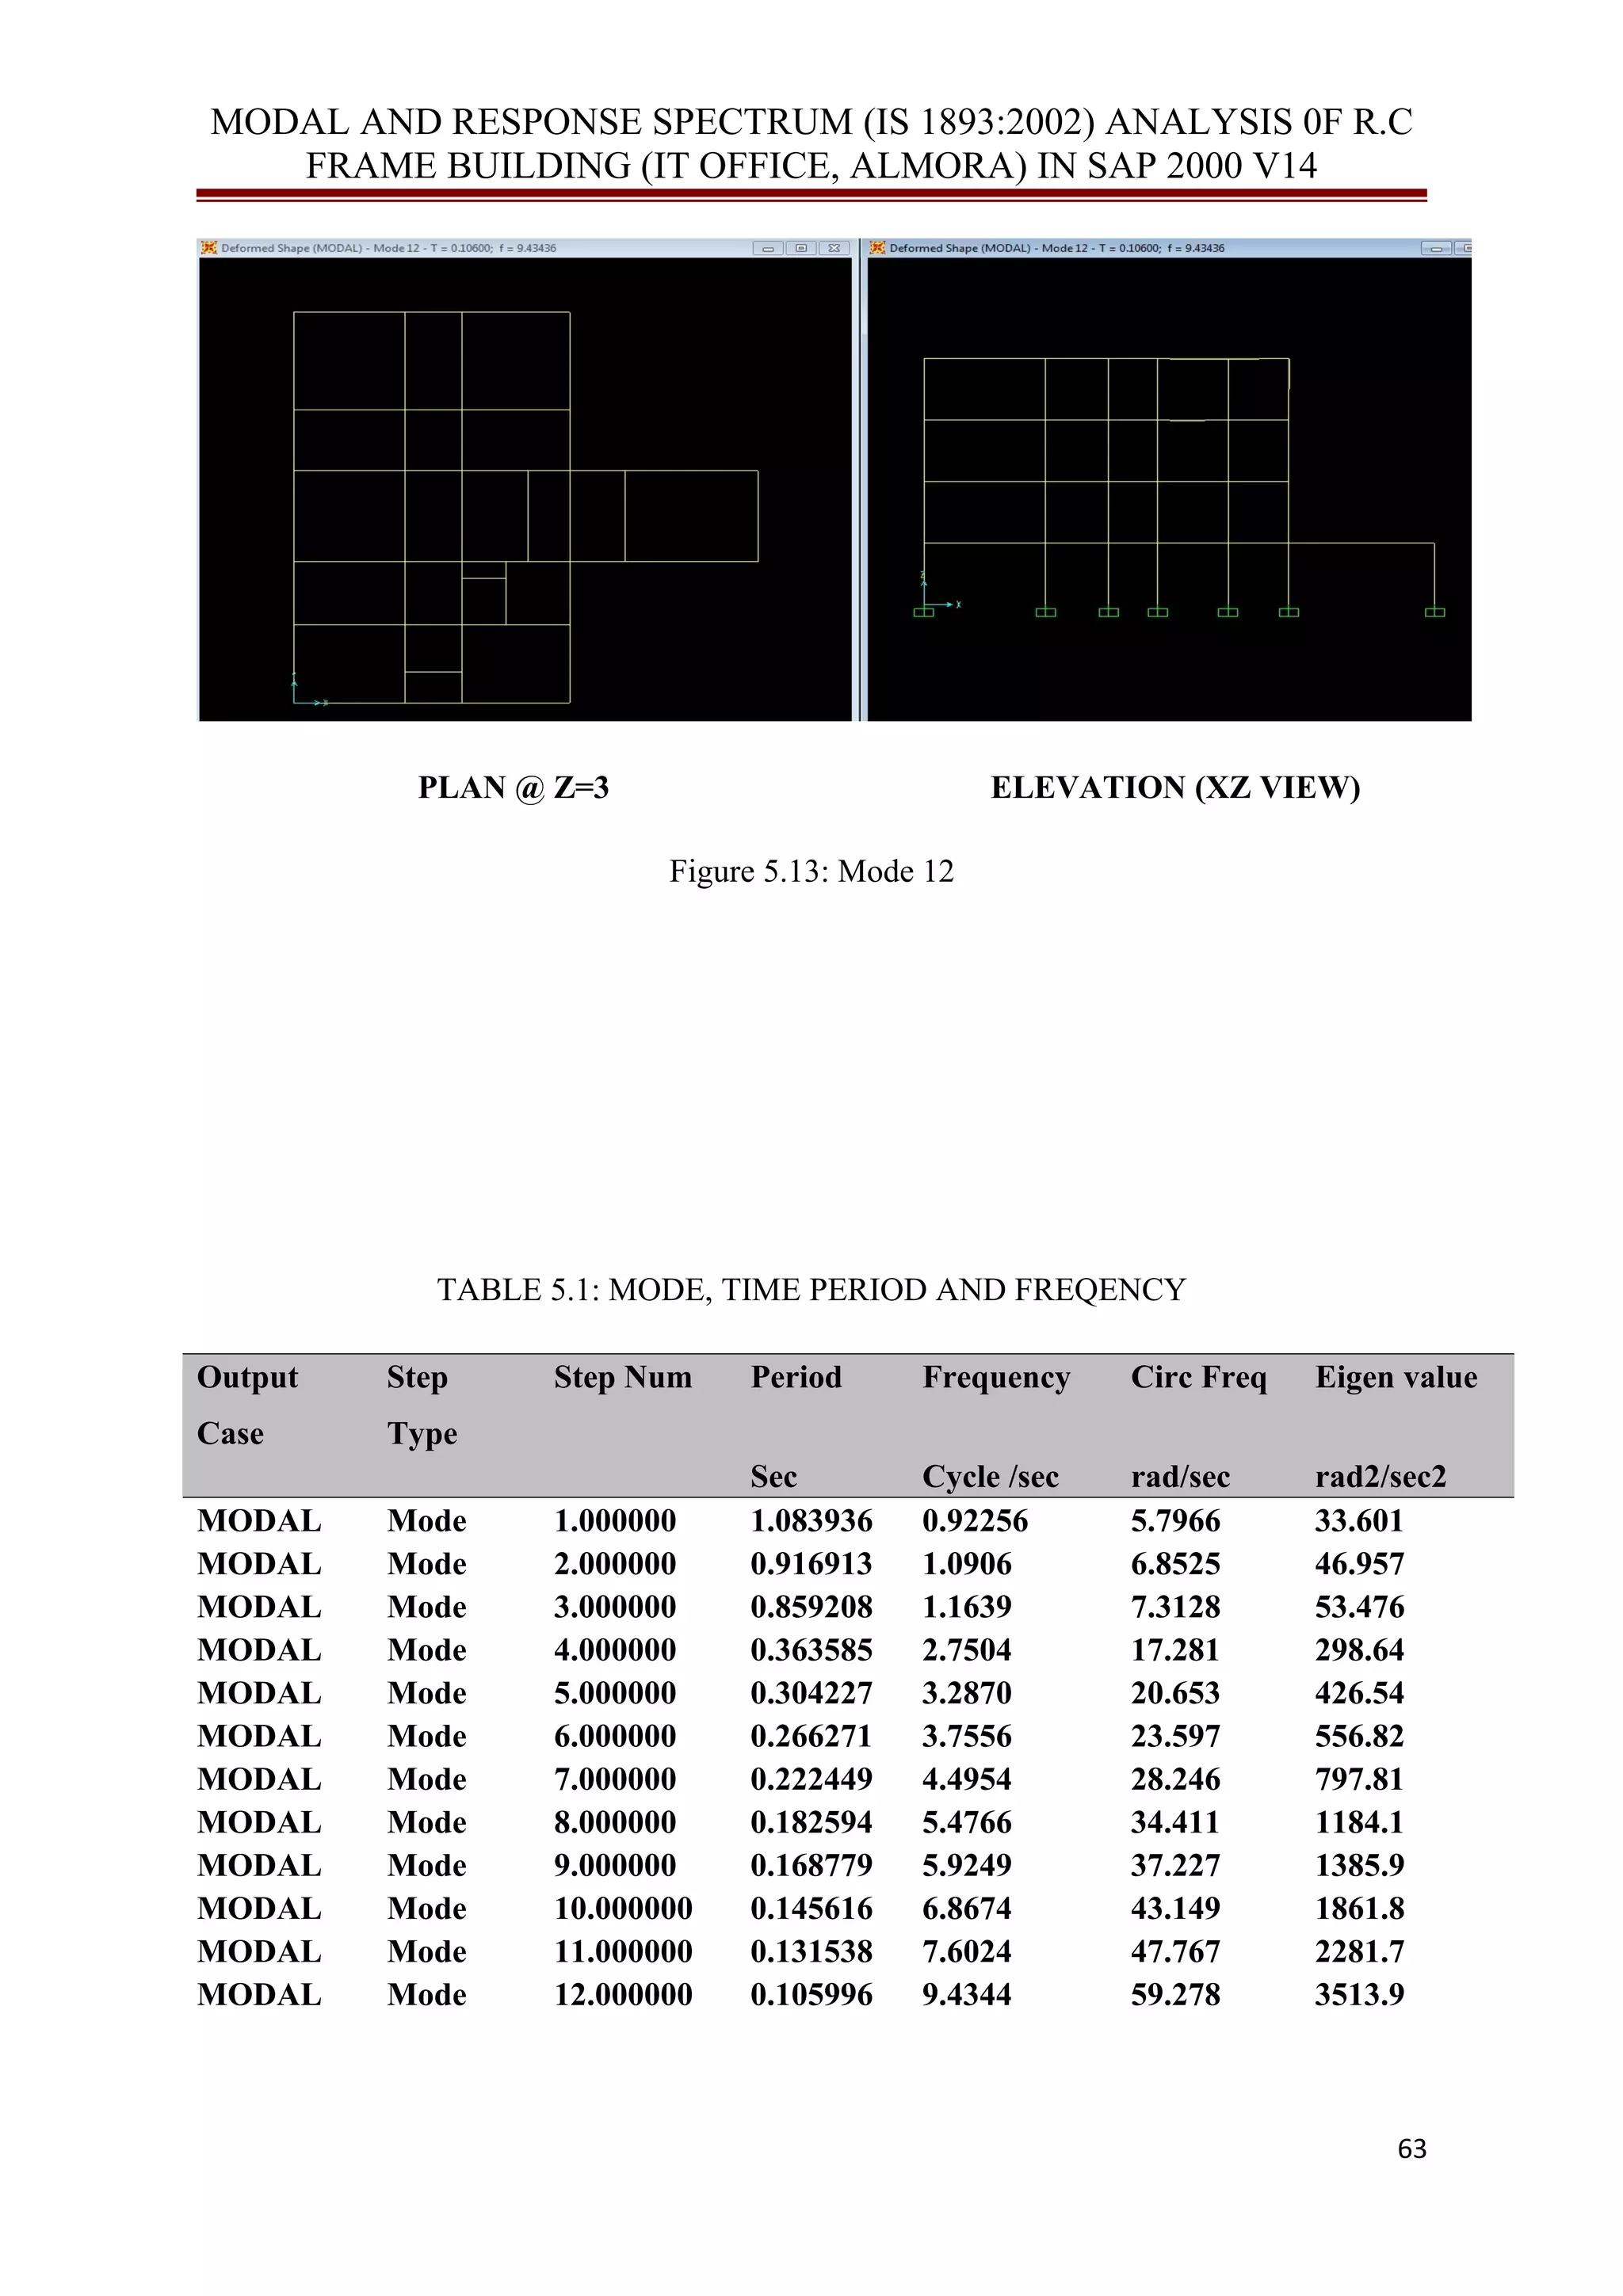
![MODAL AND RESPONSE SPECTRUM (IS 1893:2002) ANALYSIS 0F R.C
FRAME BUILDING (IT OFFICE, ALMORA) IN SAP 2000 V14
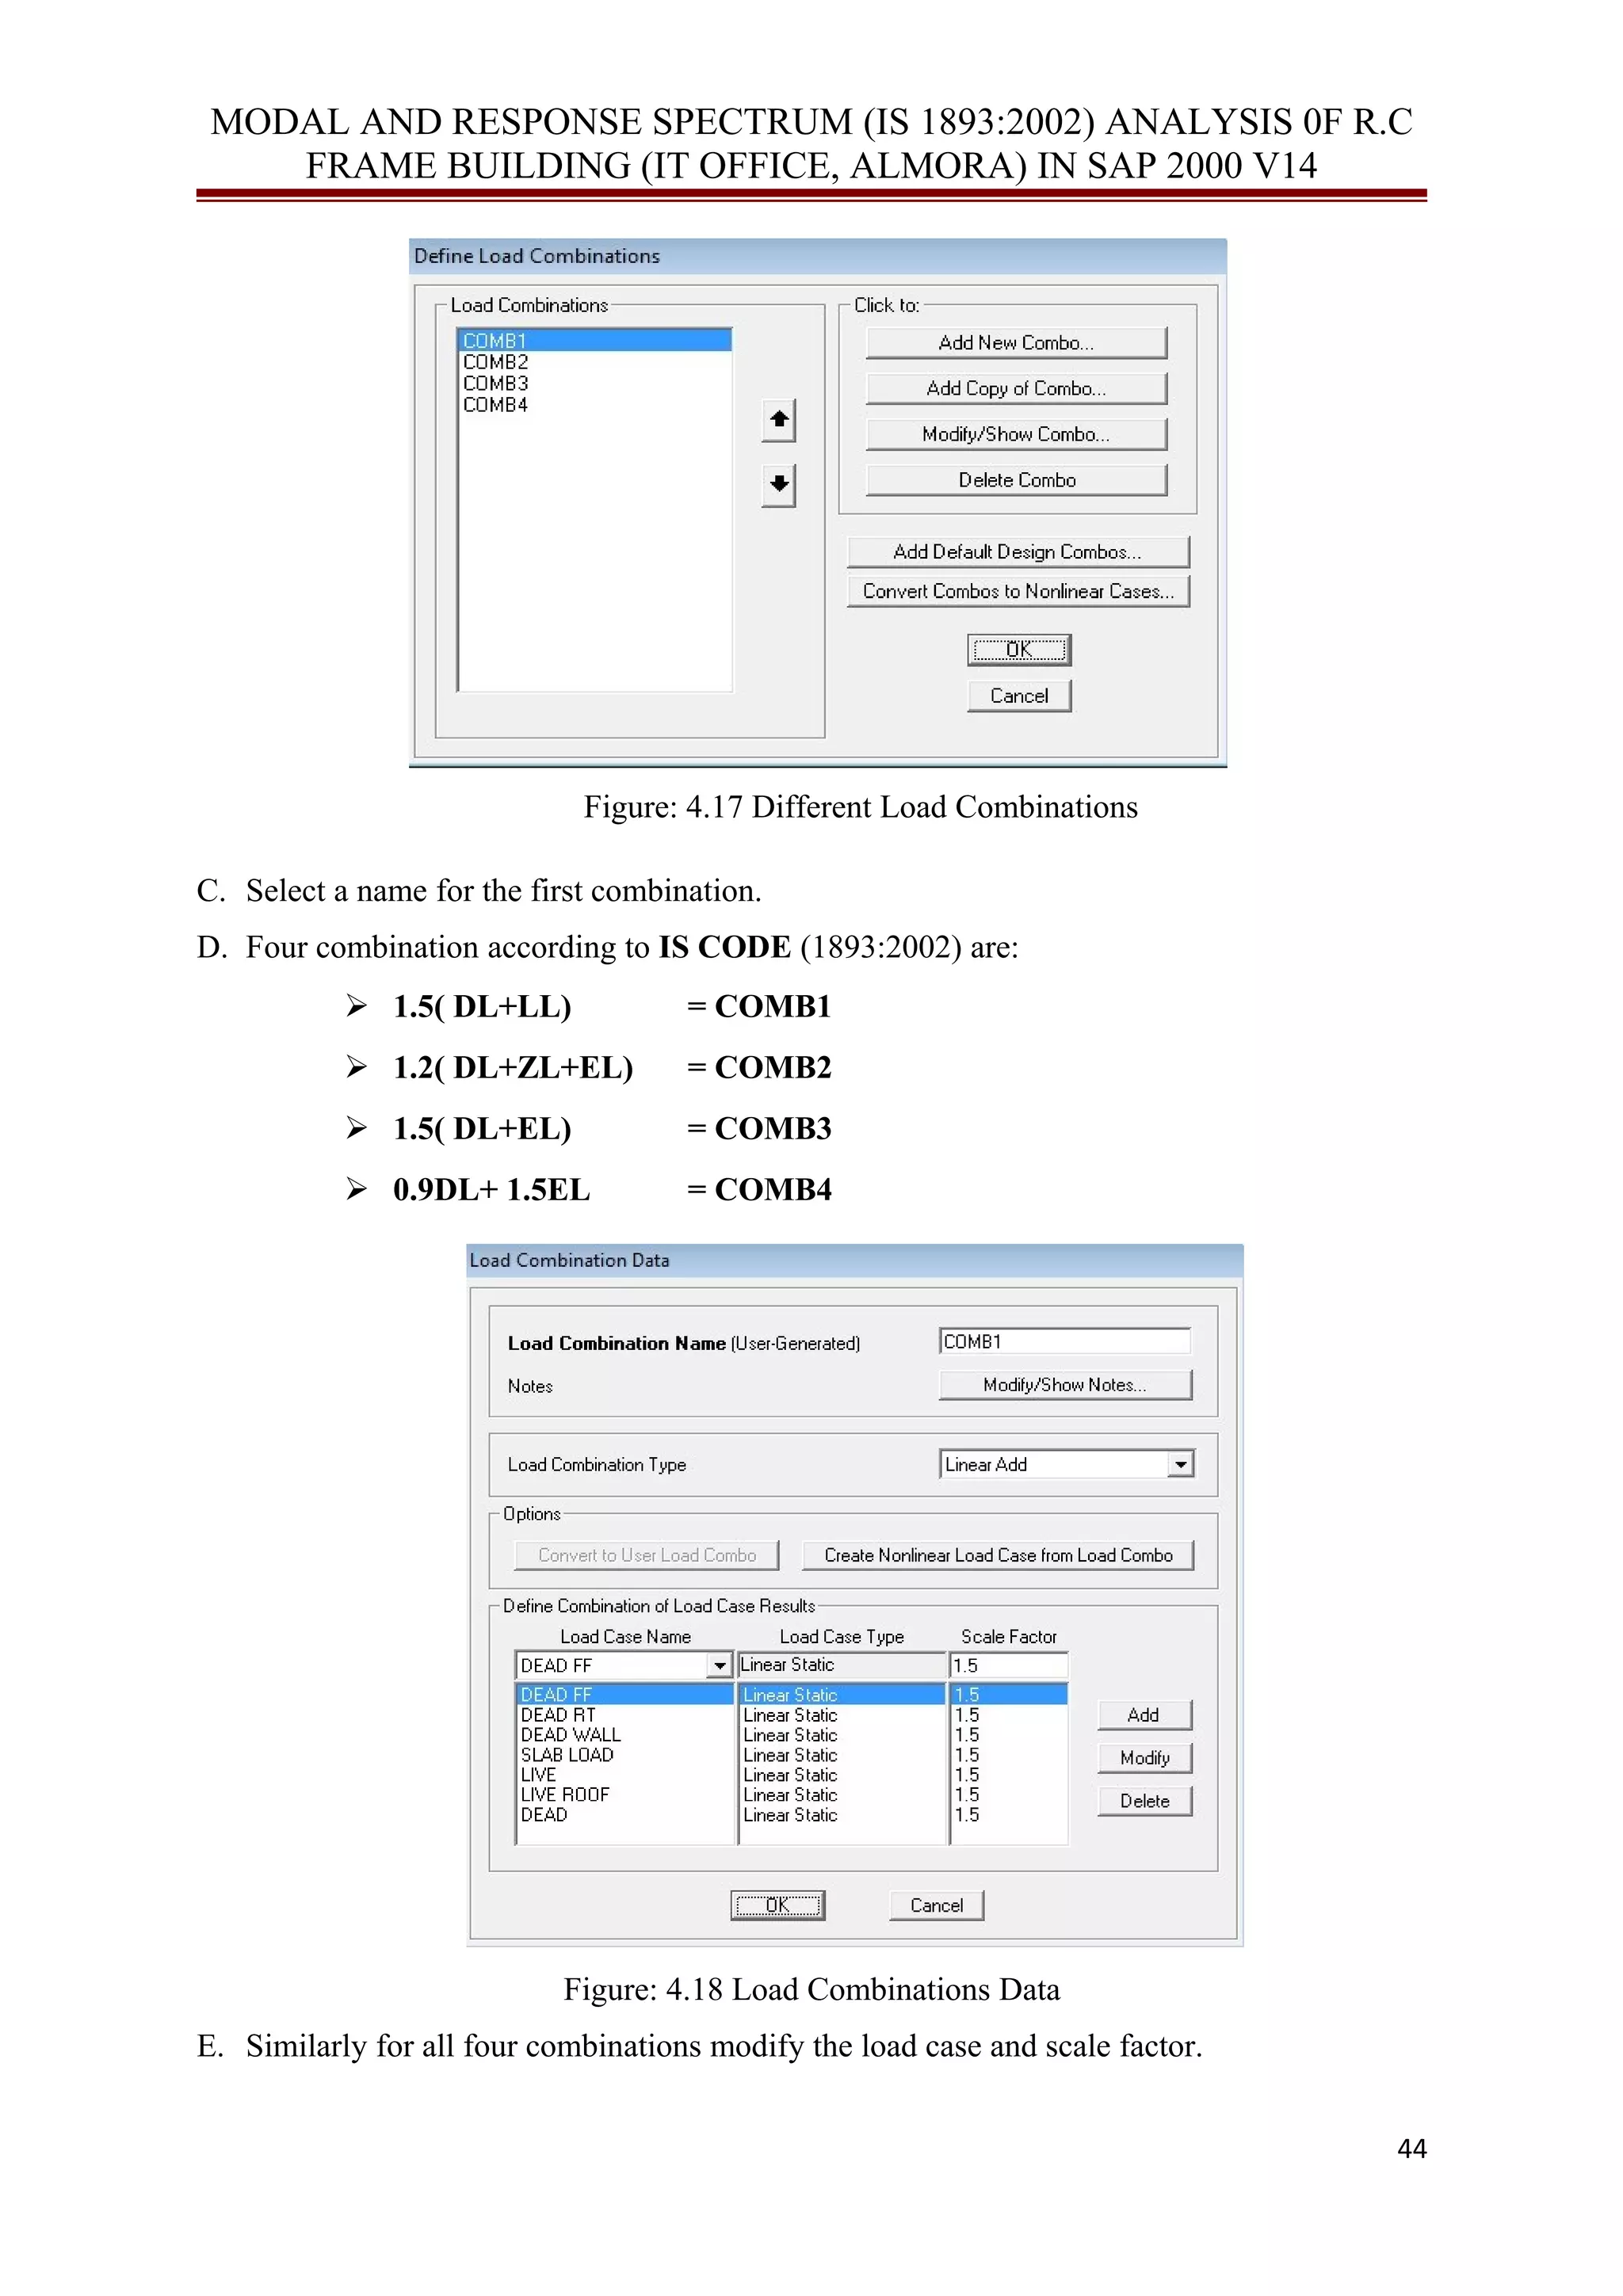
C. Dialog box will open; select fixed support as shown in Figure 10.
Figure: 4.11 Assign Restraints to Foundation (Fixed Base)
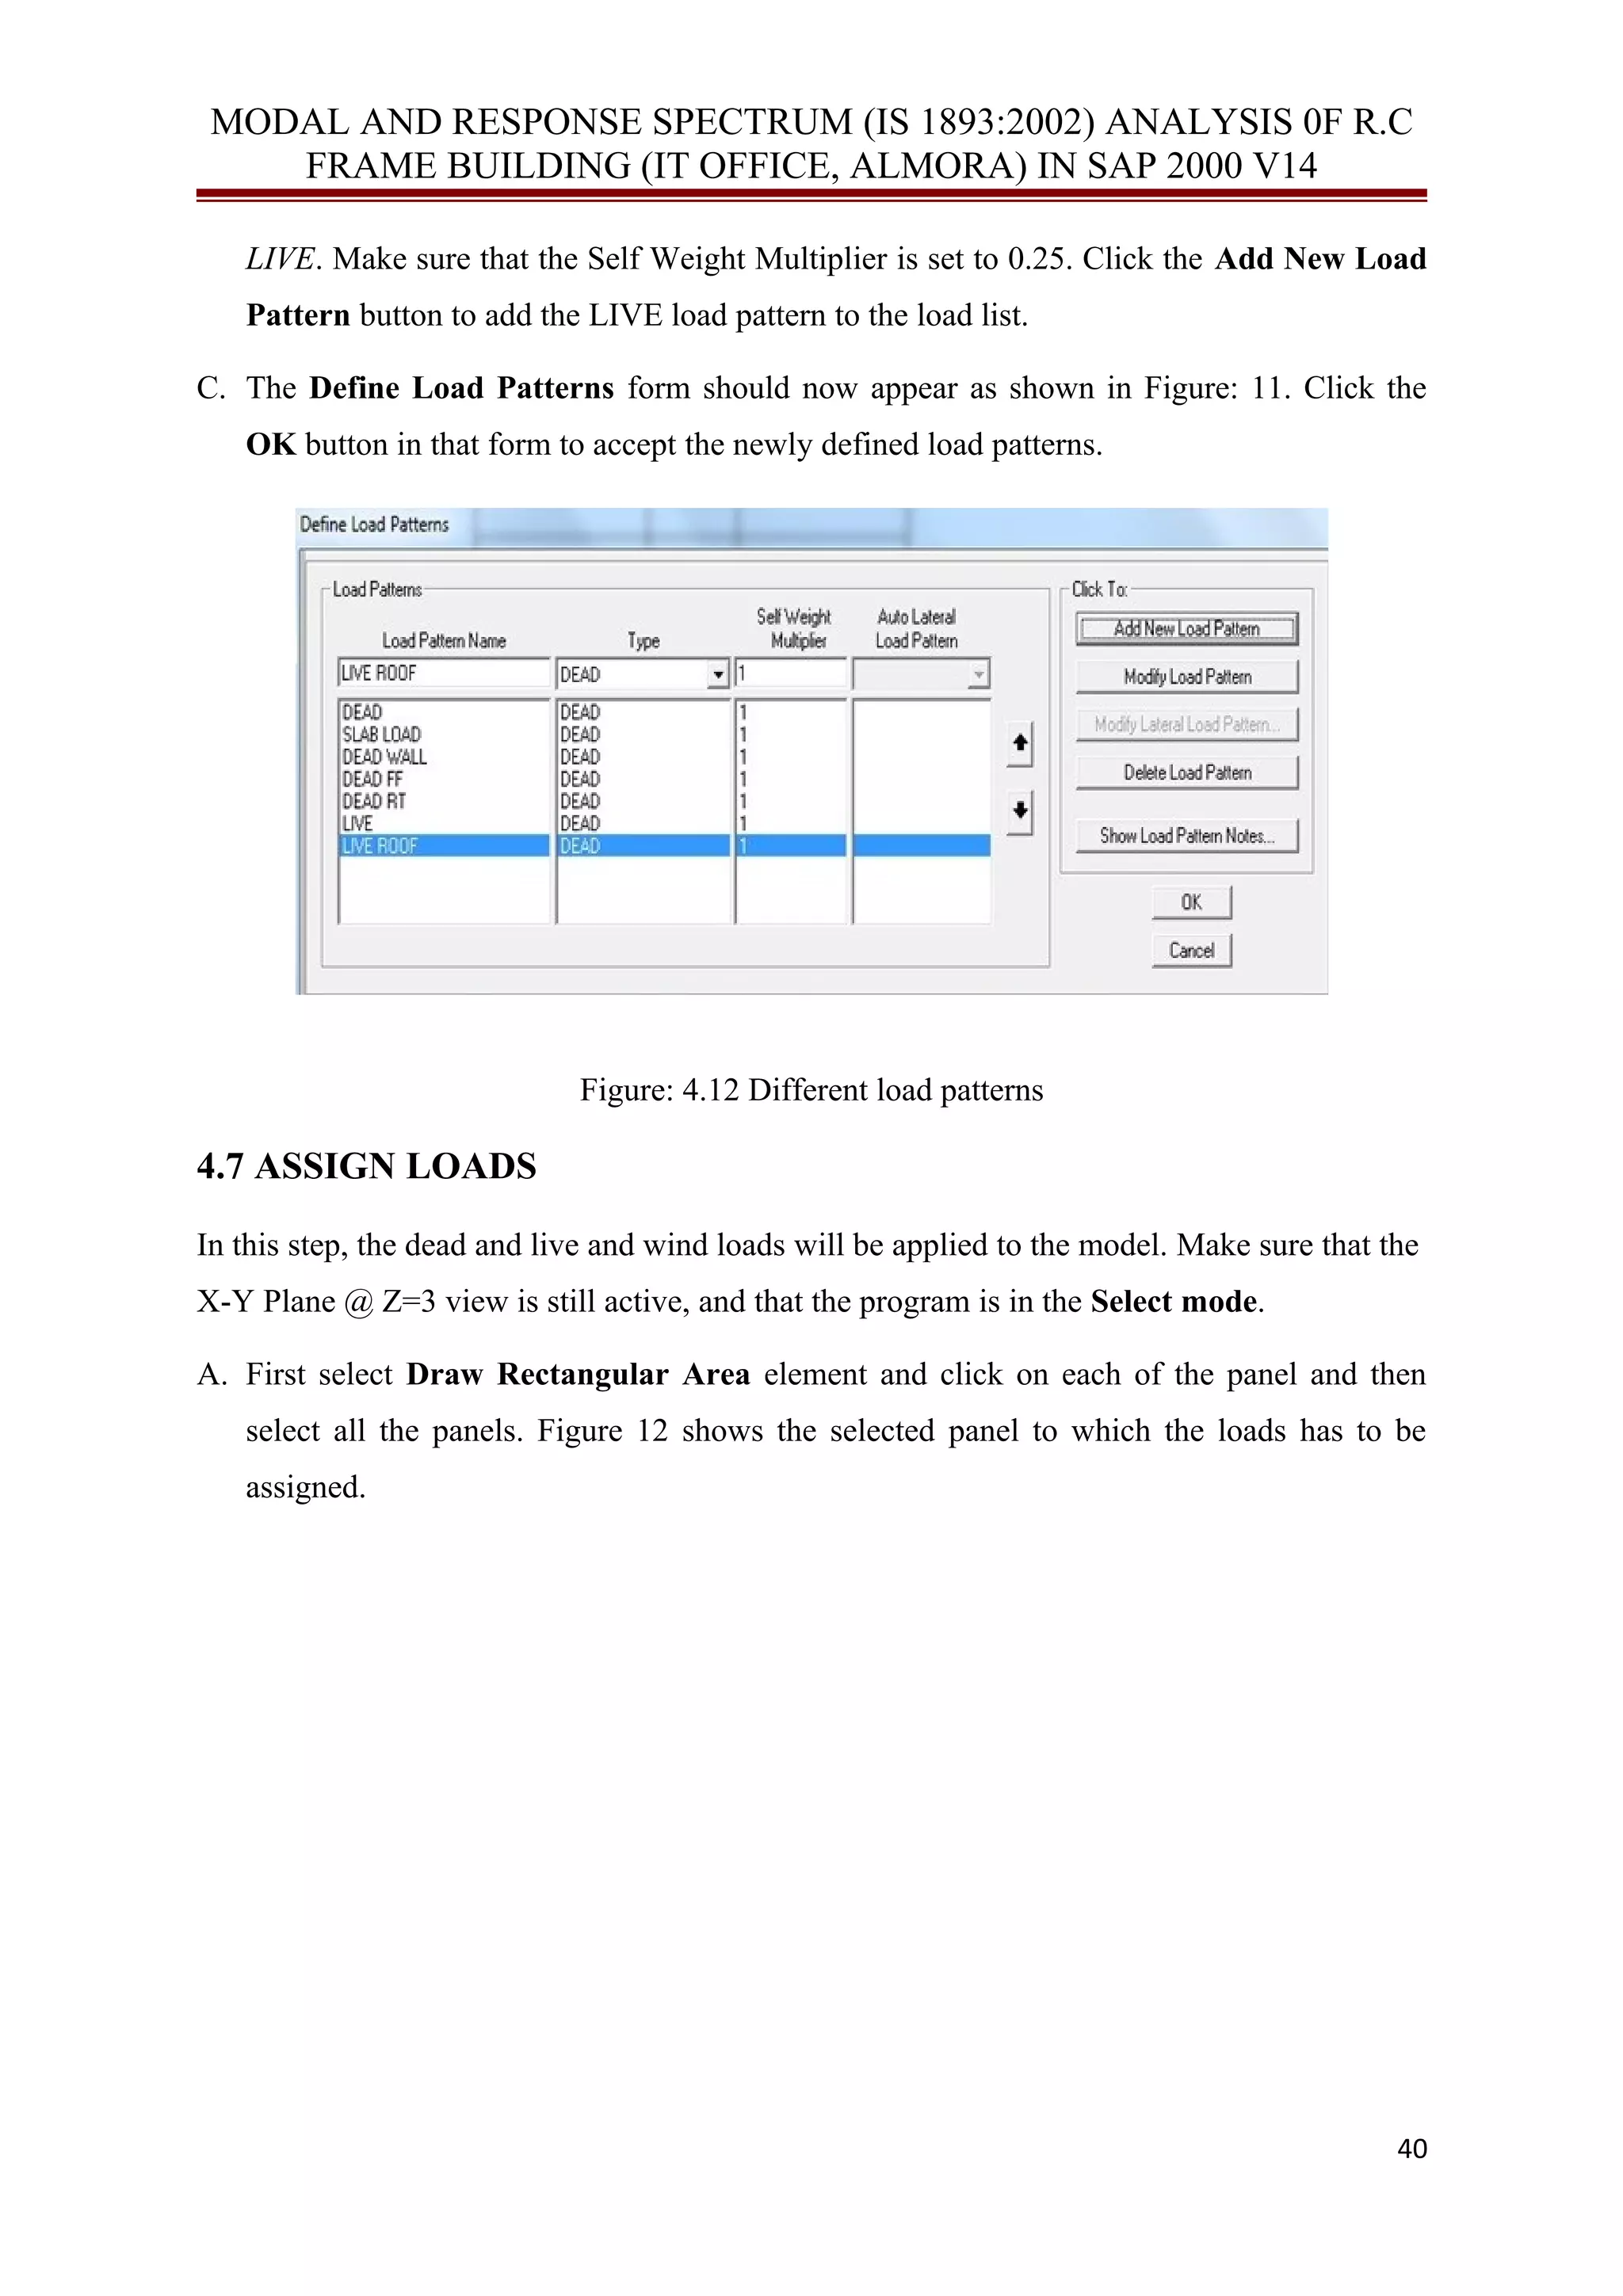
4.6 DEFINE LOAD PATTERNS
The loads used in this modeling consist of dead and live load patterns. The dead and live
loads act in the gravity direction. Dead load consists of slab load, wall load, floor finishing
load and roof treatment. Following is the procedure to define the various load patterns.
A. Click the Define menu > Load Patterns command to access the Define Load Patterns
form shown in Figure: 11. Note there is only a single default load pattern defined which is
a dead load pattern with self-weight (DEAD).
[Note that the self-weight multiplier is set to 1 for the default pattern. This indicates that this
load pattern will automatically include 1.0 times the self-weight of all members. In SAP2000,
both Load Patterns and Load Cases exist, and they may be different. However, the program
automatically creates a corresponding load case when a load pattern is defined, and the load
cases are available for review at the time the analysis is run.]
B. Click in the edit box for the Load Pattern Name column. Type the name of the new
pattern, LIVE. Select a Type of load pattern from the drop-down list; in this case, select
39](https://image.slidesharecdn.com/e2296c29-cdbf-4667-905e-ace2d9d4dd5f-150321092042-conversion-gate01/75/MODAL-AND-RESPONSE-SPECTRUM-IS-18932002-ANALYSIS-0F-R-C-FRAME-BUILDING-IT-OFFICE-ALMORA-IN-SAP-2000-V14-39-2048.jpg)

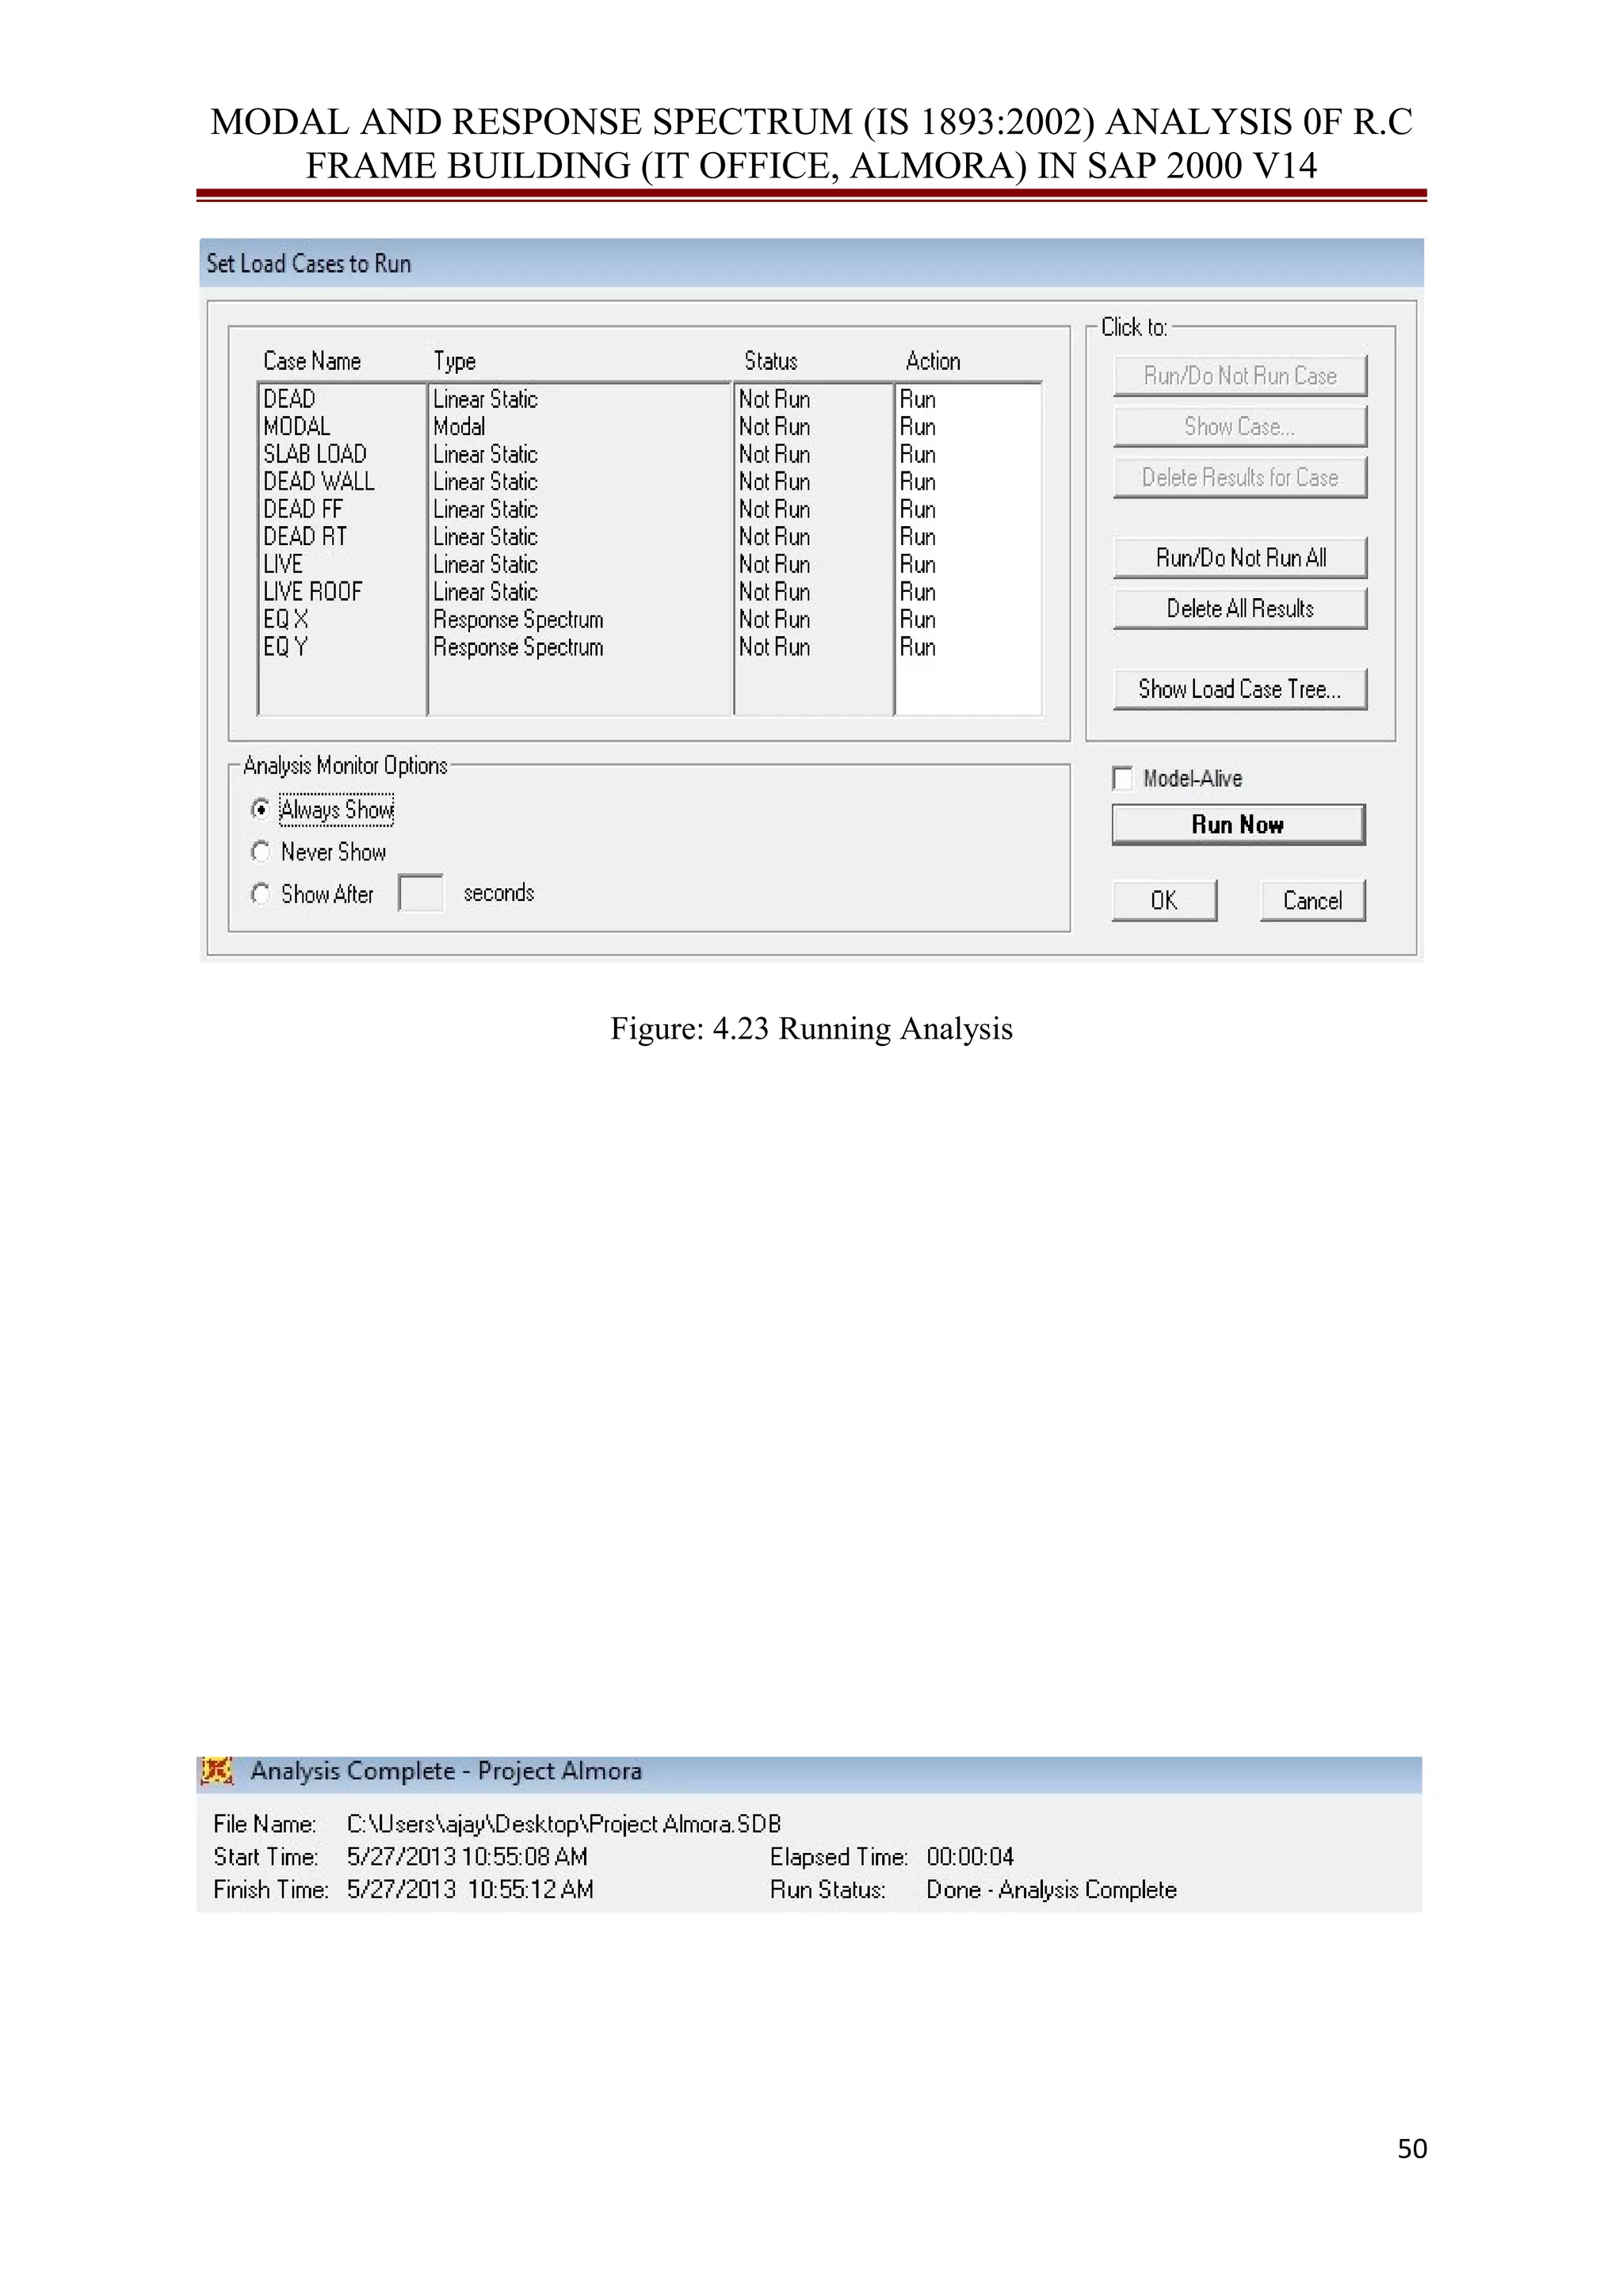


![MODAL AND RESPONSE SPECTRUM (IS 1893:2002) ANALYSIS 0F R.C
FRAME BUILDING (IT OFFICE, ALMORA) IN SAP 2000 V14
Here the terms or represent the response of different modes of a certain storey level.
Now calculate the storey shear for every mode.
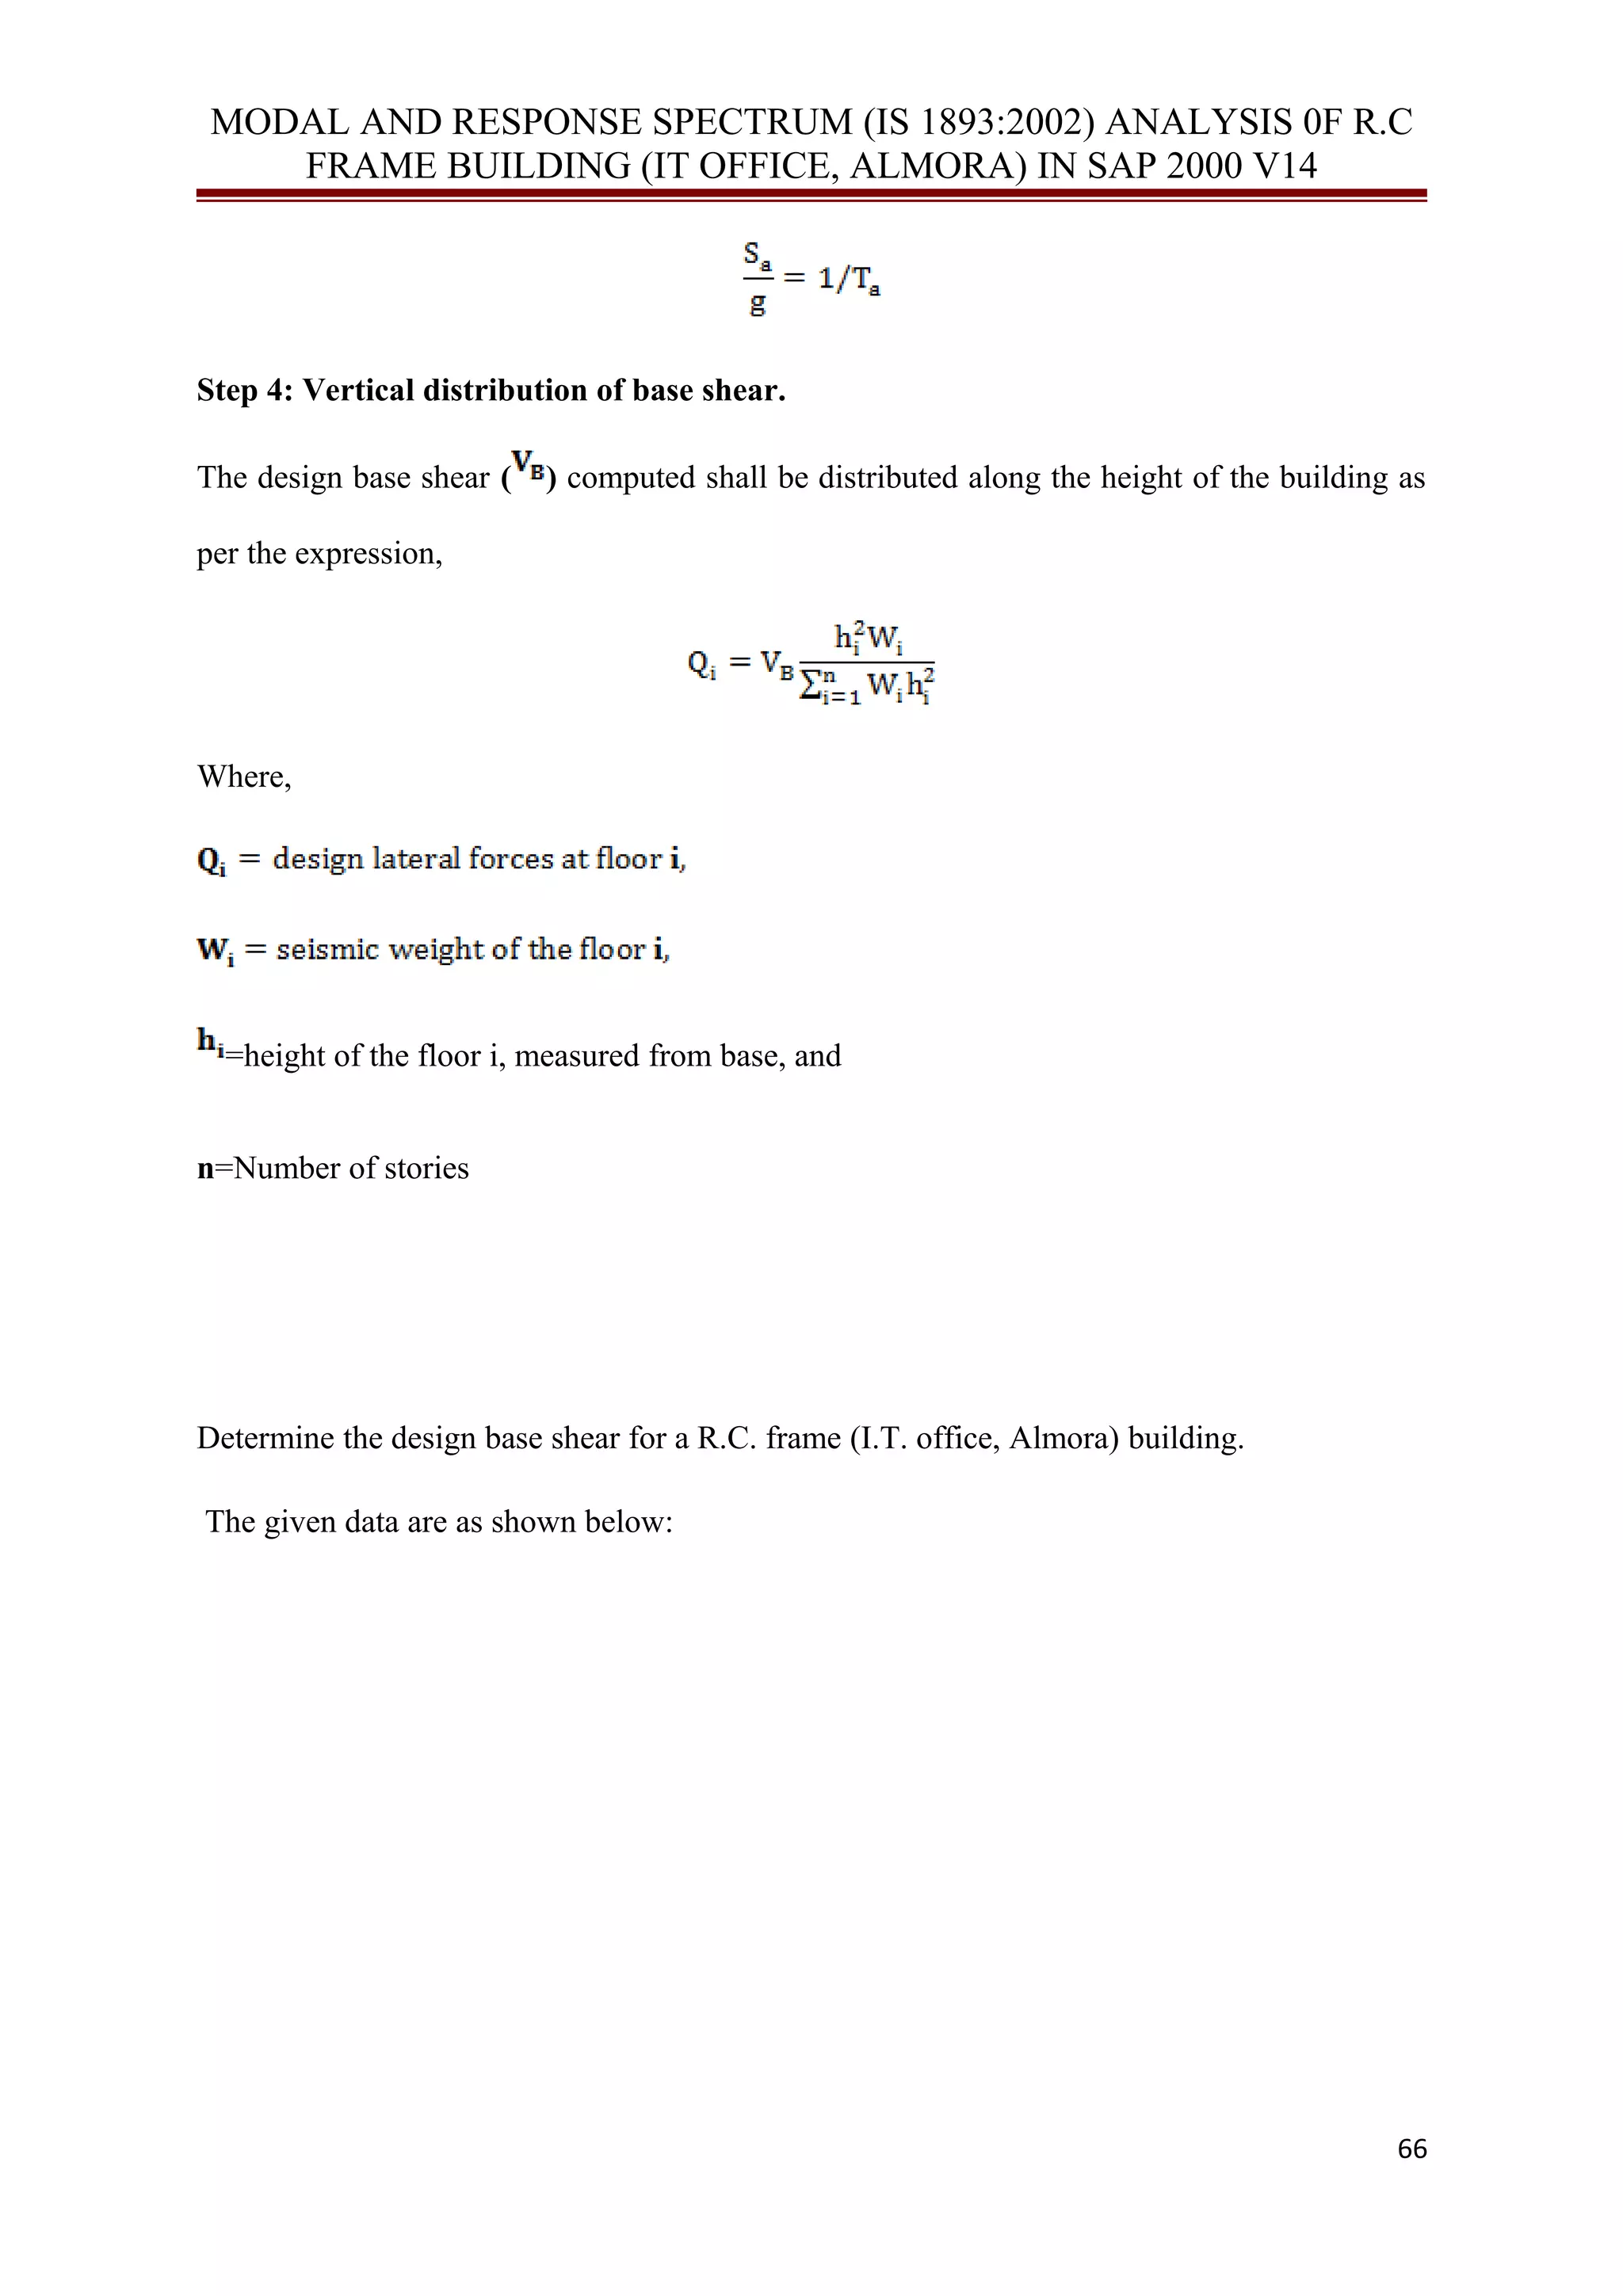
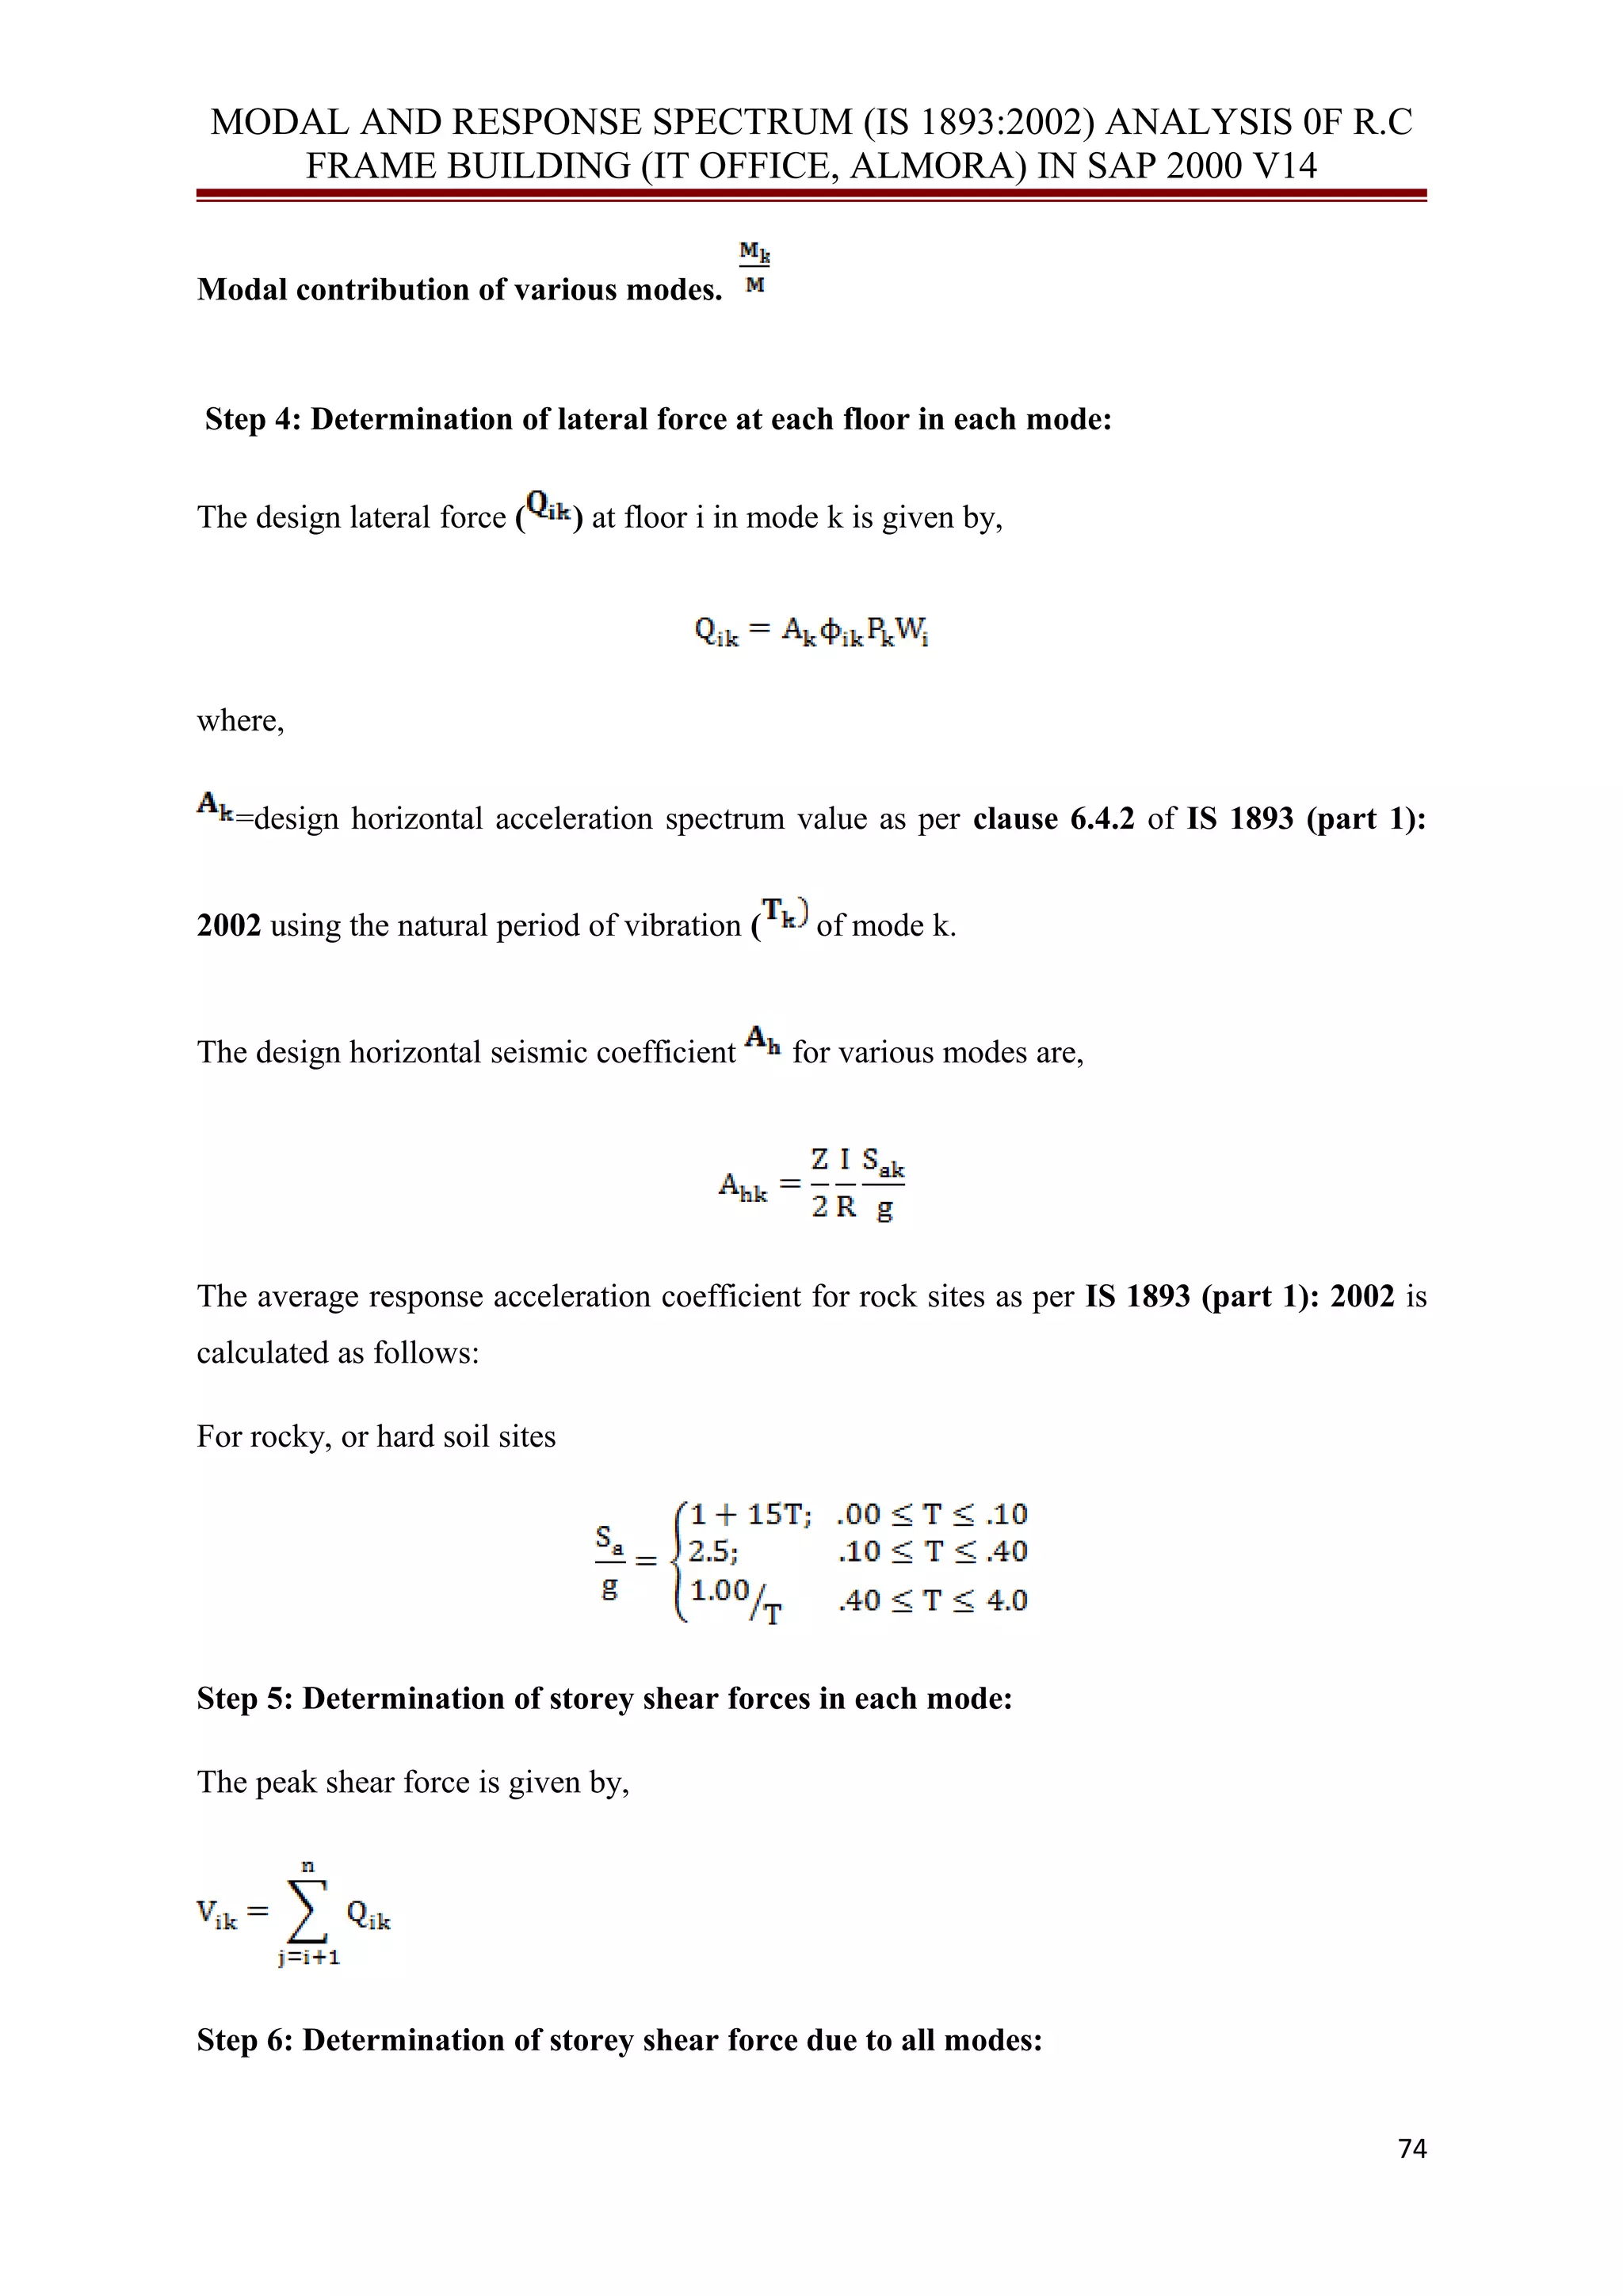
Step 7: Determination of lateral forces at each storey:
The design lateral forces , at roof and at floor, are calculated as,
And =
Frame considering the stiffness of infill.
The frame considering in previous section is again analyzed by considering the stiffness of
infill walls. The infill is modeled as equivalent diagonal strut. The mass matrix [M] for the
lumped plane frame model is,
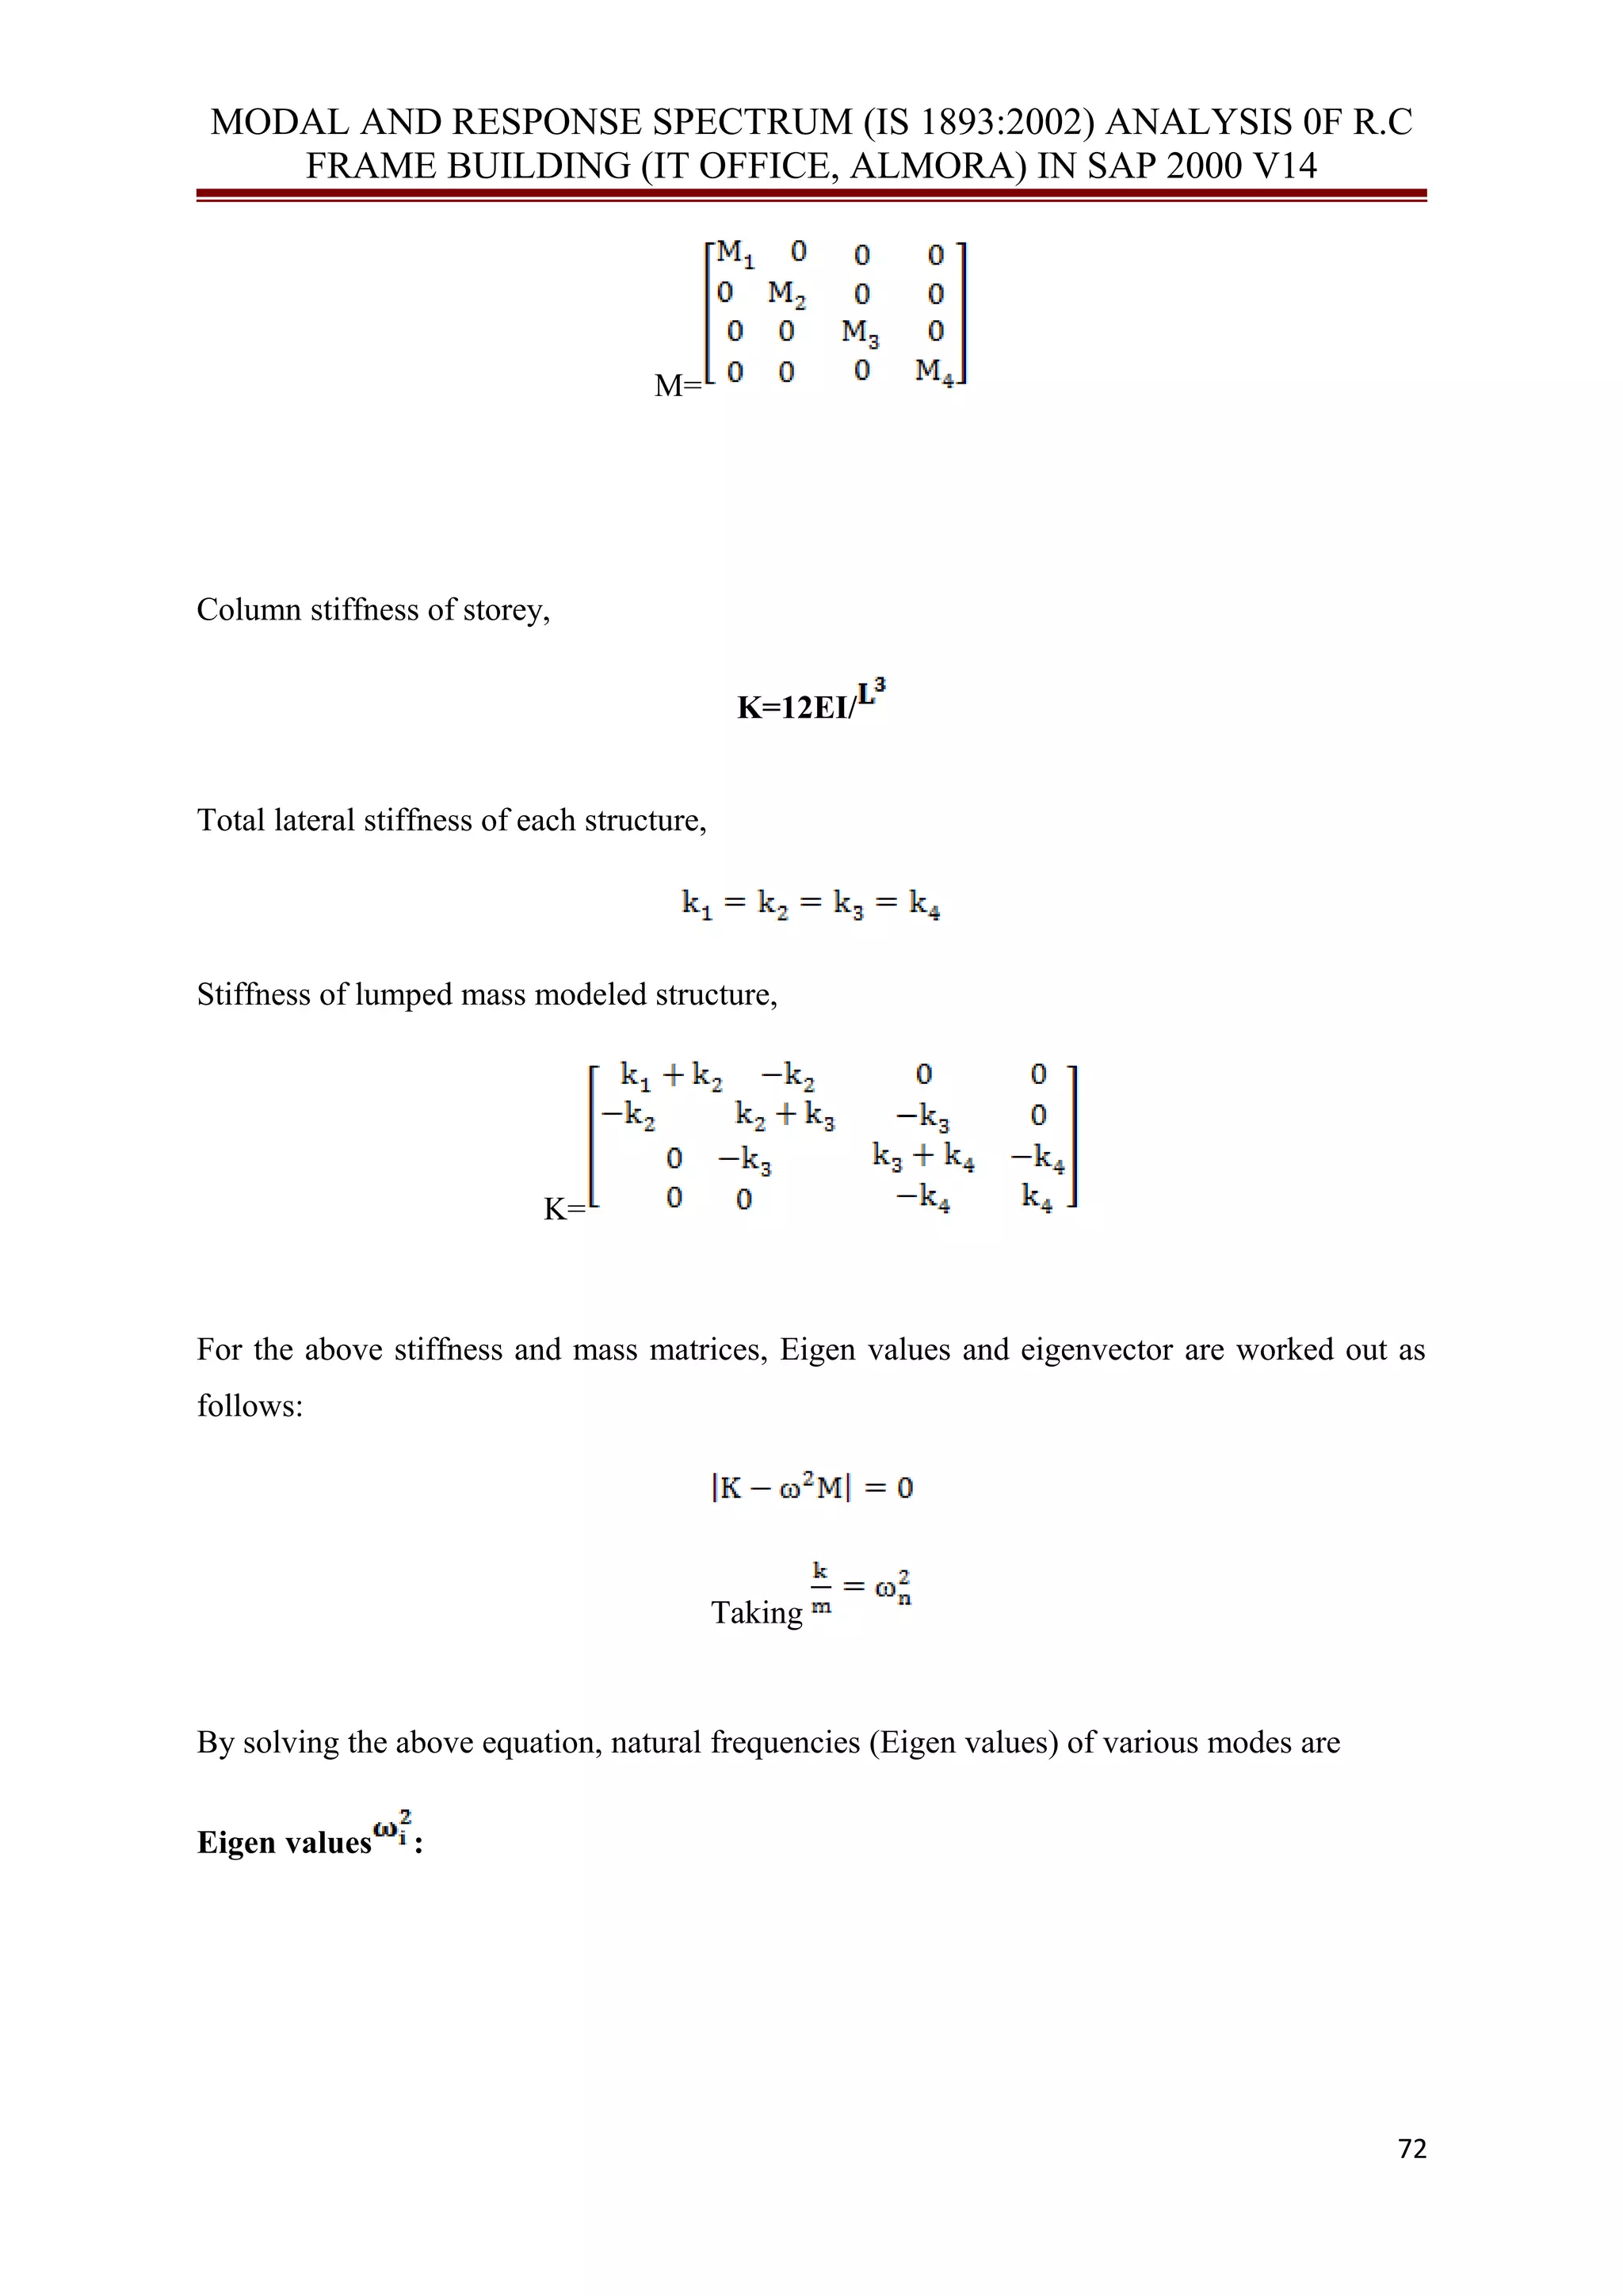
Column stiffness of storey
K=12EI/
Stiffness of infill is determined by modeling the infill as an equivalent diagonal strut, in
which,
Width of strut
77](https://image.slidesharecdn.com/e2296c29-cdbf-4667-905e-ace2d9d4dd5f-150321092042-conversion-gate01/75/MODAL-AND-RESPONSE-SPECTRUM-IS-18932002-ANALYSIS-0F-R-C-FRAME-BUILDING-IT-OFFICE-ALMORA-IN-SAP-2000-V14-77-2048.jpg)
![MODAL AND RESPONSE SPECTRUM (IS 1893:2002) ANALYSIS 0F R.C
FRAME BUILDING (IT OFFICE, ALMORA) IN SAP 2000 V14
And are given as,
, ,
where,
= Elastic modulus of frame material
= moment of inertia of column
= moment of inertia of beam
W=
A = Cross sectional area of diagonal stiffness= W*t
= diagonal length of strut =
Therefore, stiffness of infill is
Stiffness matrix [k] of lumped mass model is,
K=
78](https://image.slidesharecdn.com/e2296c29-cdbf-4667-905e-ace2d9d4dd5f-150321092042-conversion-gate01/75/MODAL-AND-RESPONSE-SPECTRUM-IS-18932002-ANALYSIS-0F-R-C-FRAME-BUILDING-IT-OFFICE-ALMORA-IN-SAP-2000-V14-78-2048.jpg)