This document discusses static pushover analysis for seismic design performance assessment. It describes how to construct a pushover curve by defining a structural model and loads, and performing an analysis while controlling displacements. Two main methods are presented for using the pushover curve: the Capacity Spectrum Method (ATC-40) which constructs a capacity spectrum and determines a performance point, and the Displacement Coefficient Method (FEMA 273) which estimates a target displacement. The document also provides examples of modeling elements and their force-deformation properties for the pushover analysis.
Static Pushover Analysis
Performance Based Design
Modeling for Pushover Analysis
Use of the Pushover Curve
M. Iqbal Suharwardy
Computers and Structures, Inc.
Static Pushover Analysis for Seismic Design
March 22, 1999
2.
Performance Check ofStructures
Purpose
How will a structure perform when subjected to
a given level of earthquake?
– Definition of structural performance
– Definition of earthquake level
– Determination of performance level
3.
Performance Check ofStructures
Process
Recently released guidelines for Seismic
Rehabilitation of Buildings:
– ATC-40
– FEMA 273 (ATC-33)
4.
Types of PerformanceChecks
Linear Static Analysis
Linear Dynamic Analysis
Nonlinear Static Analysis
(Pushover Analysis)
Nonlinear Dynamic Analysis
5.
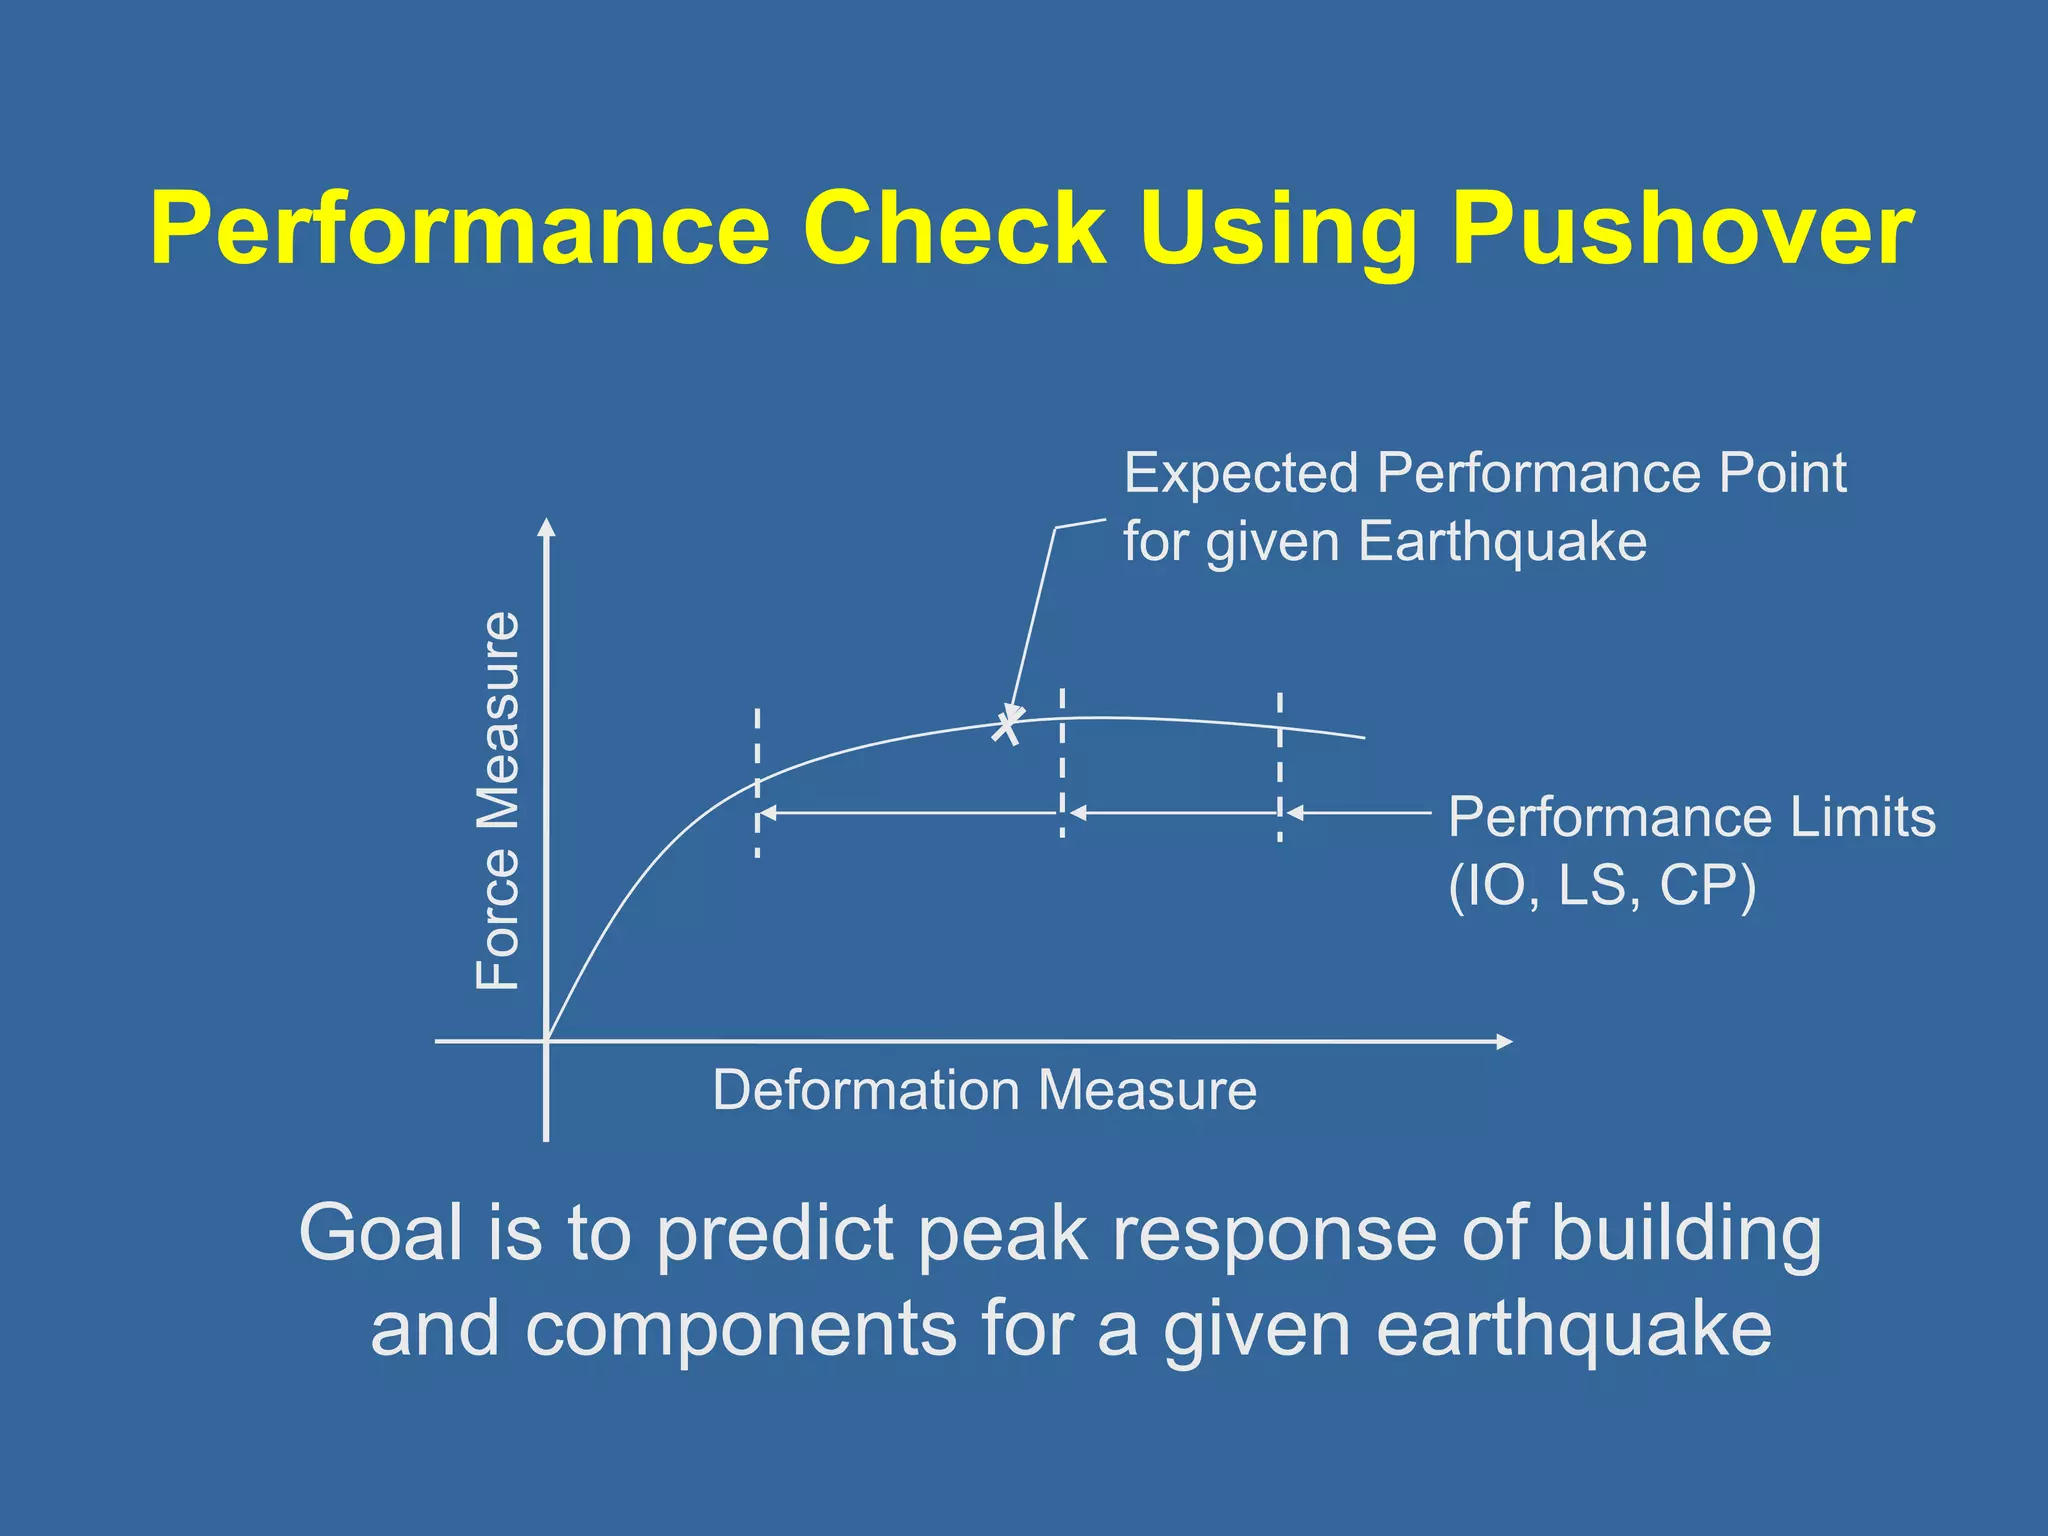
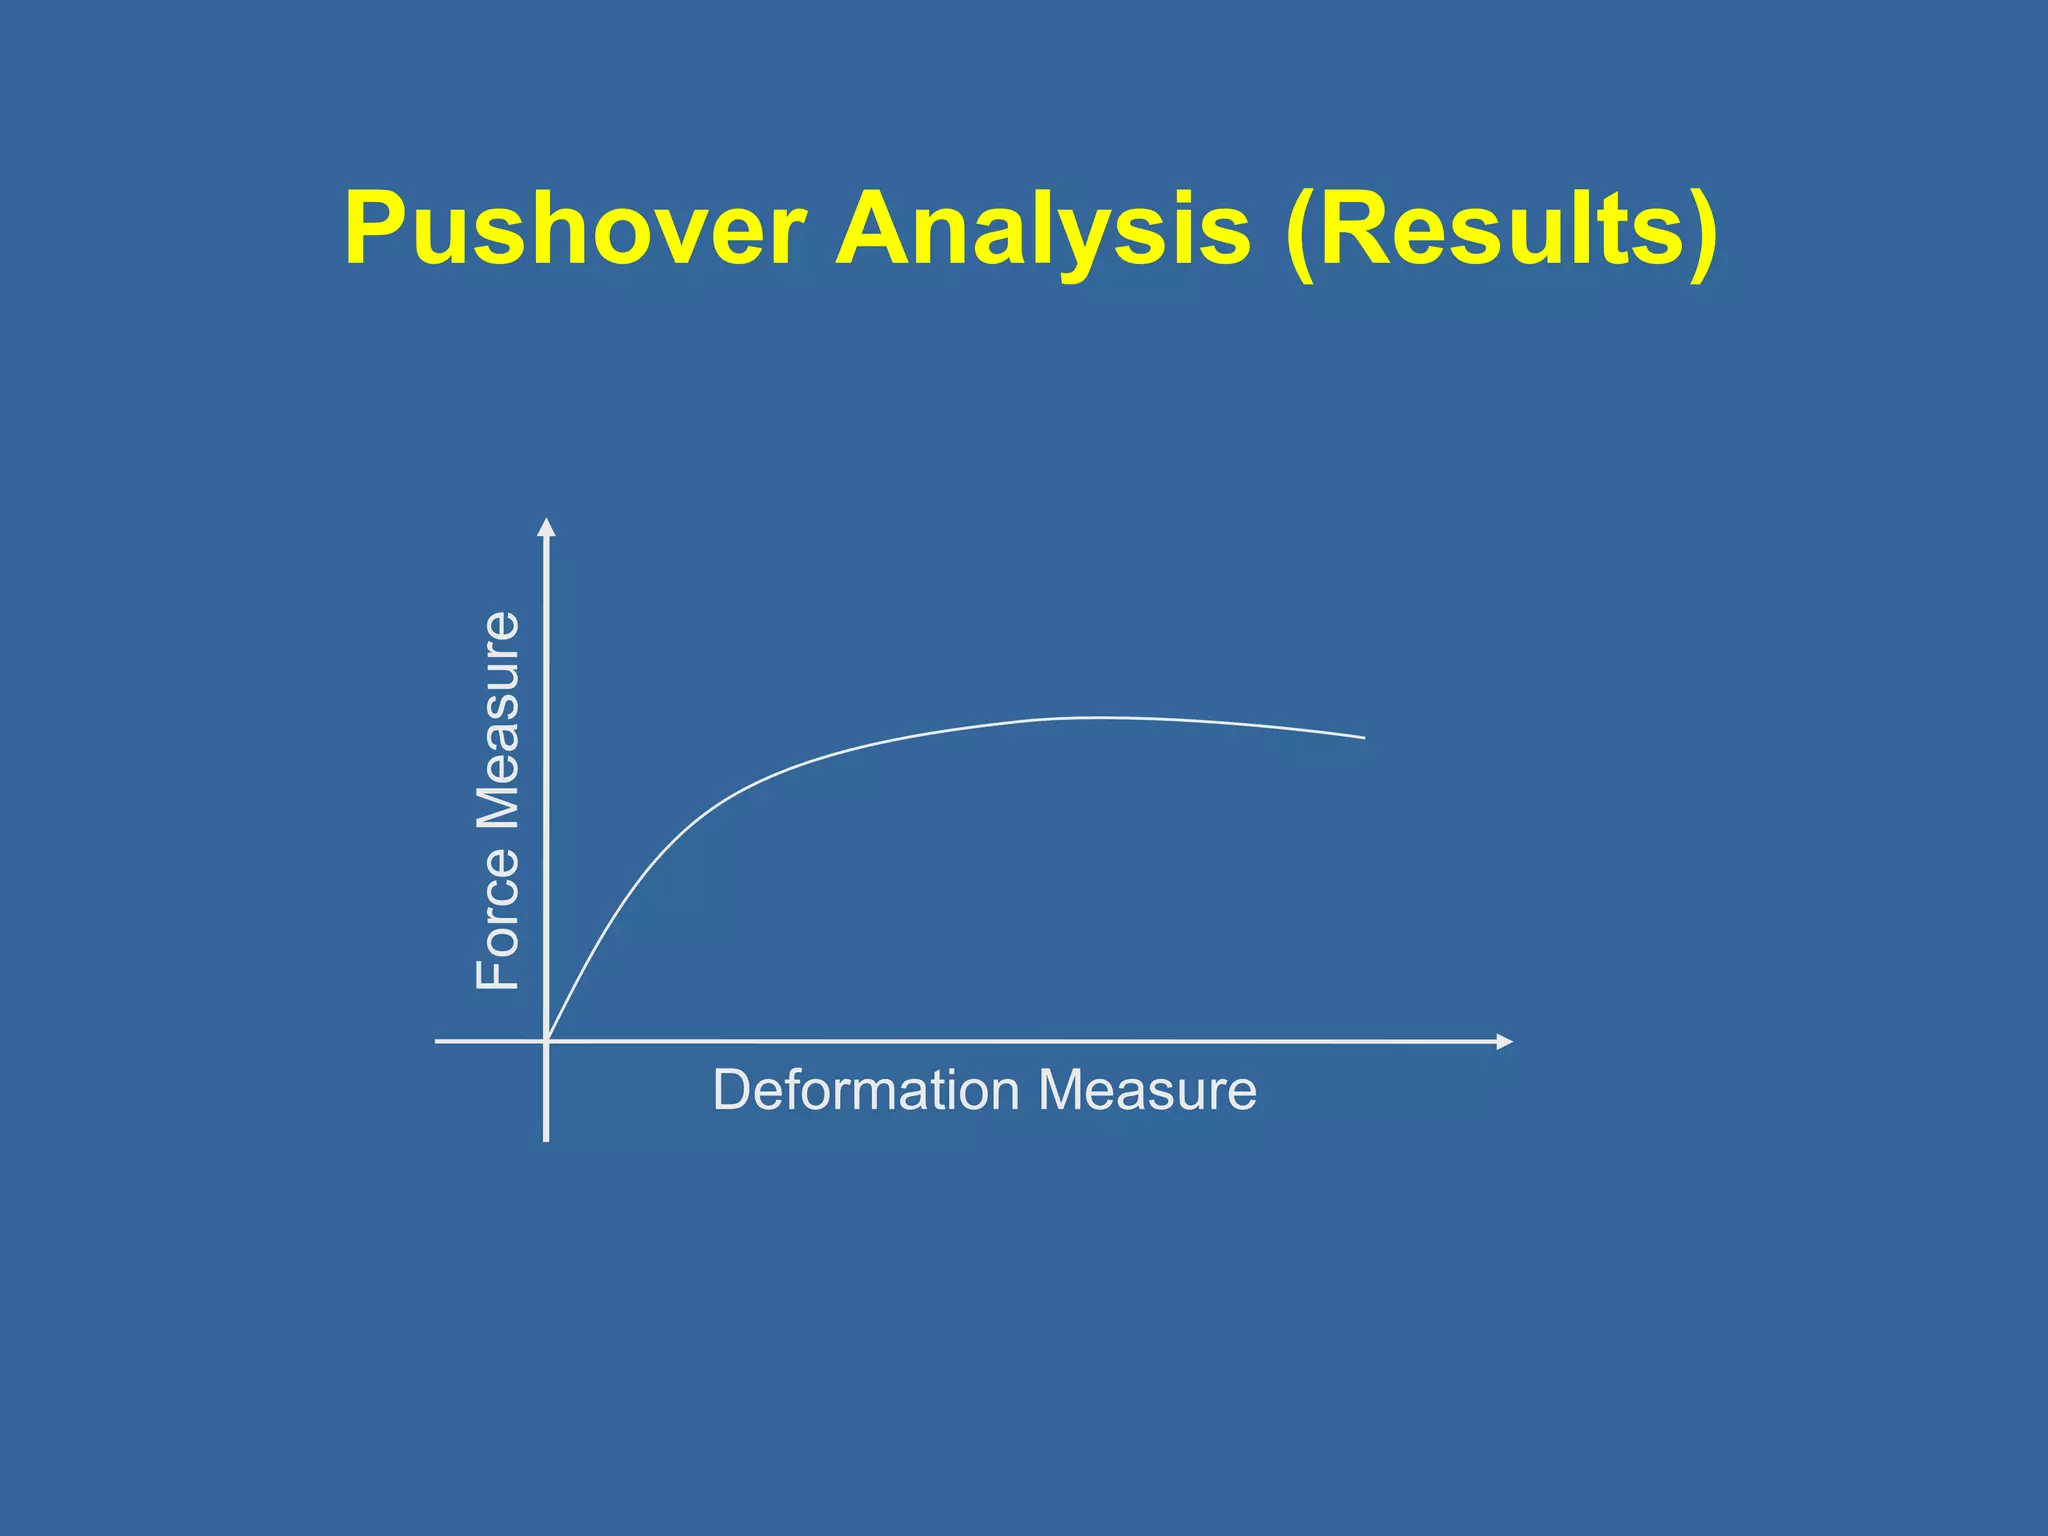
Performance Check UsingPushover
Expected Performance Point
for given Earthquake
Deformation Measure
Force Measure
Performance Limits
(IO, LS, CP)
Goal is to predict peak response of building
and components for a given earthquake
6.
Why Do PushoverAnalysis?
Design Earthquakes cause nonlinear
behavior
Better understand building behavior
- Identify weak elements
- Realistic prediction of element demands
Less conservative acceptance criteria can be
used with consequences understood
7.
Steps in PerformanceCheck
Construct Pushover curve
Select earthquake level(s) to check
Select performance level(s) to check
Select acceptance criteria for each
performance level
Verify acceptance
Capacity Spectrum Method (ATC-40)
Displacement Coefficient Method (FEMA 273)
8.
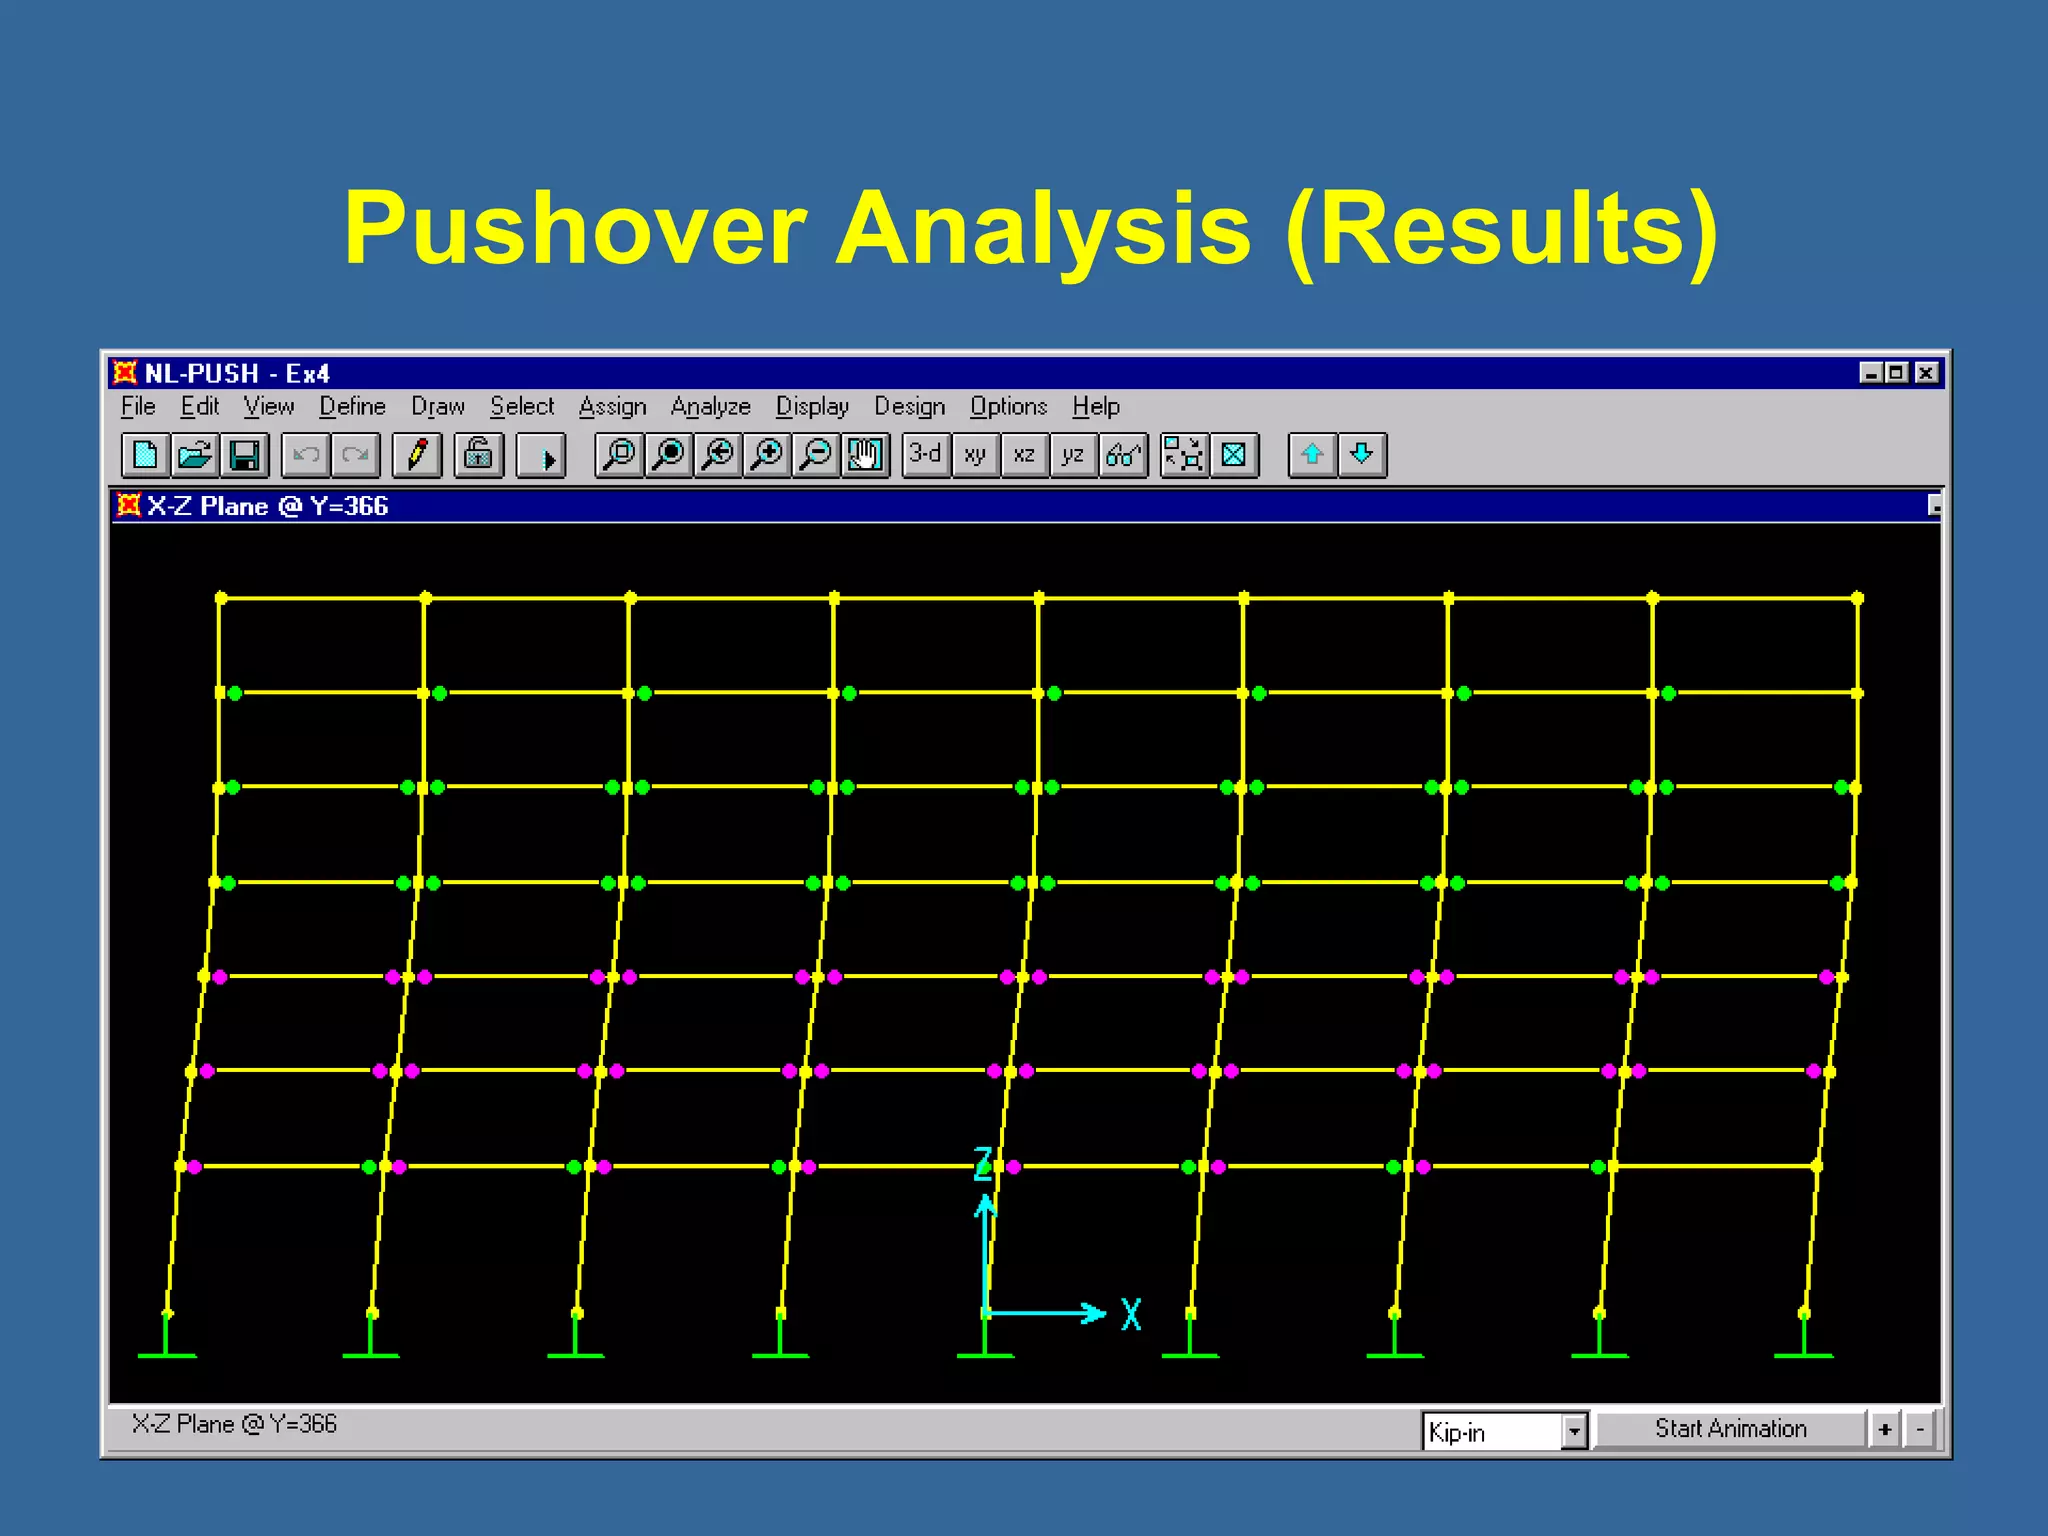
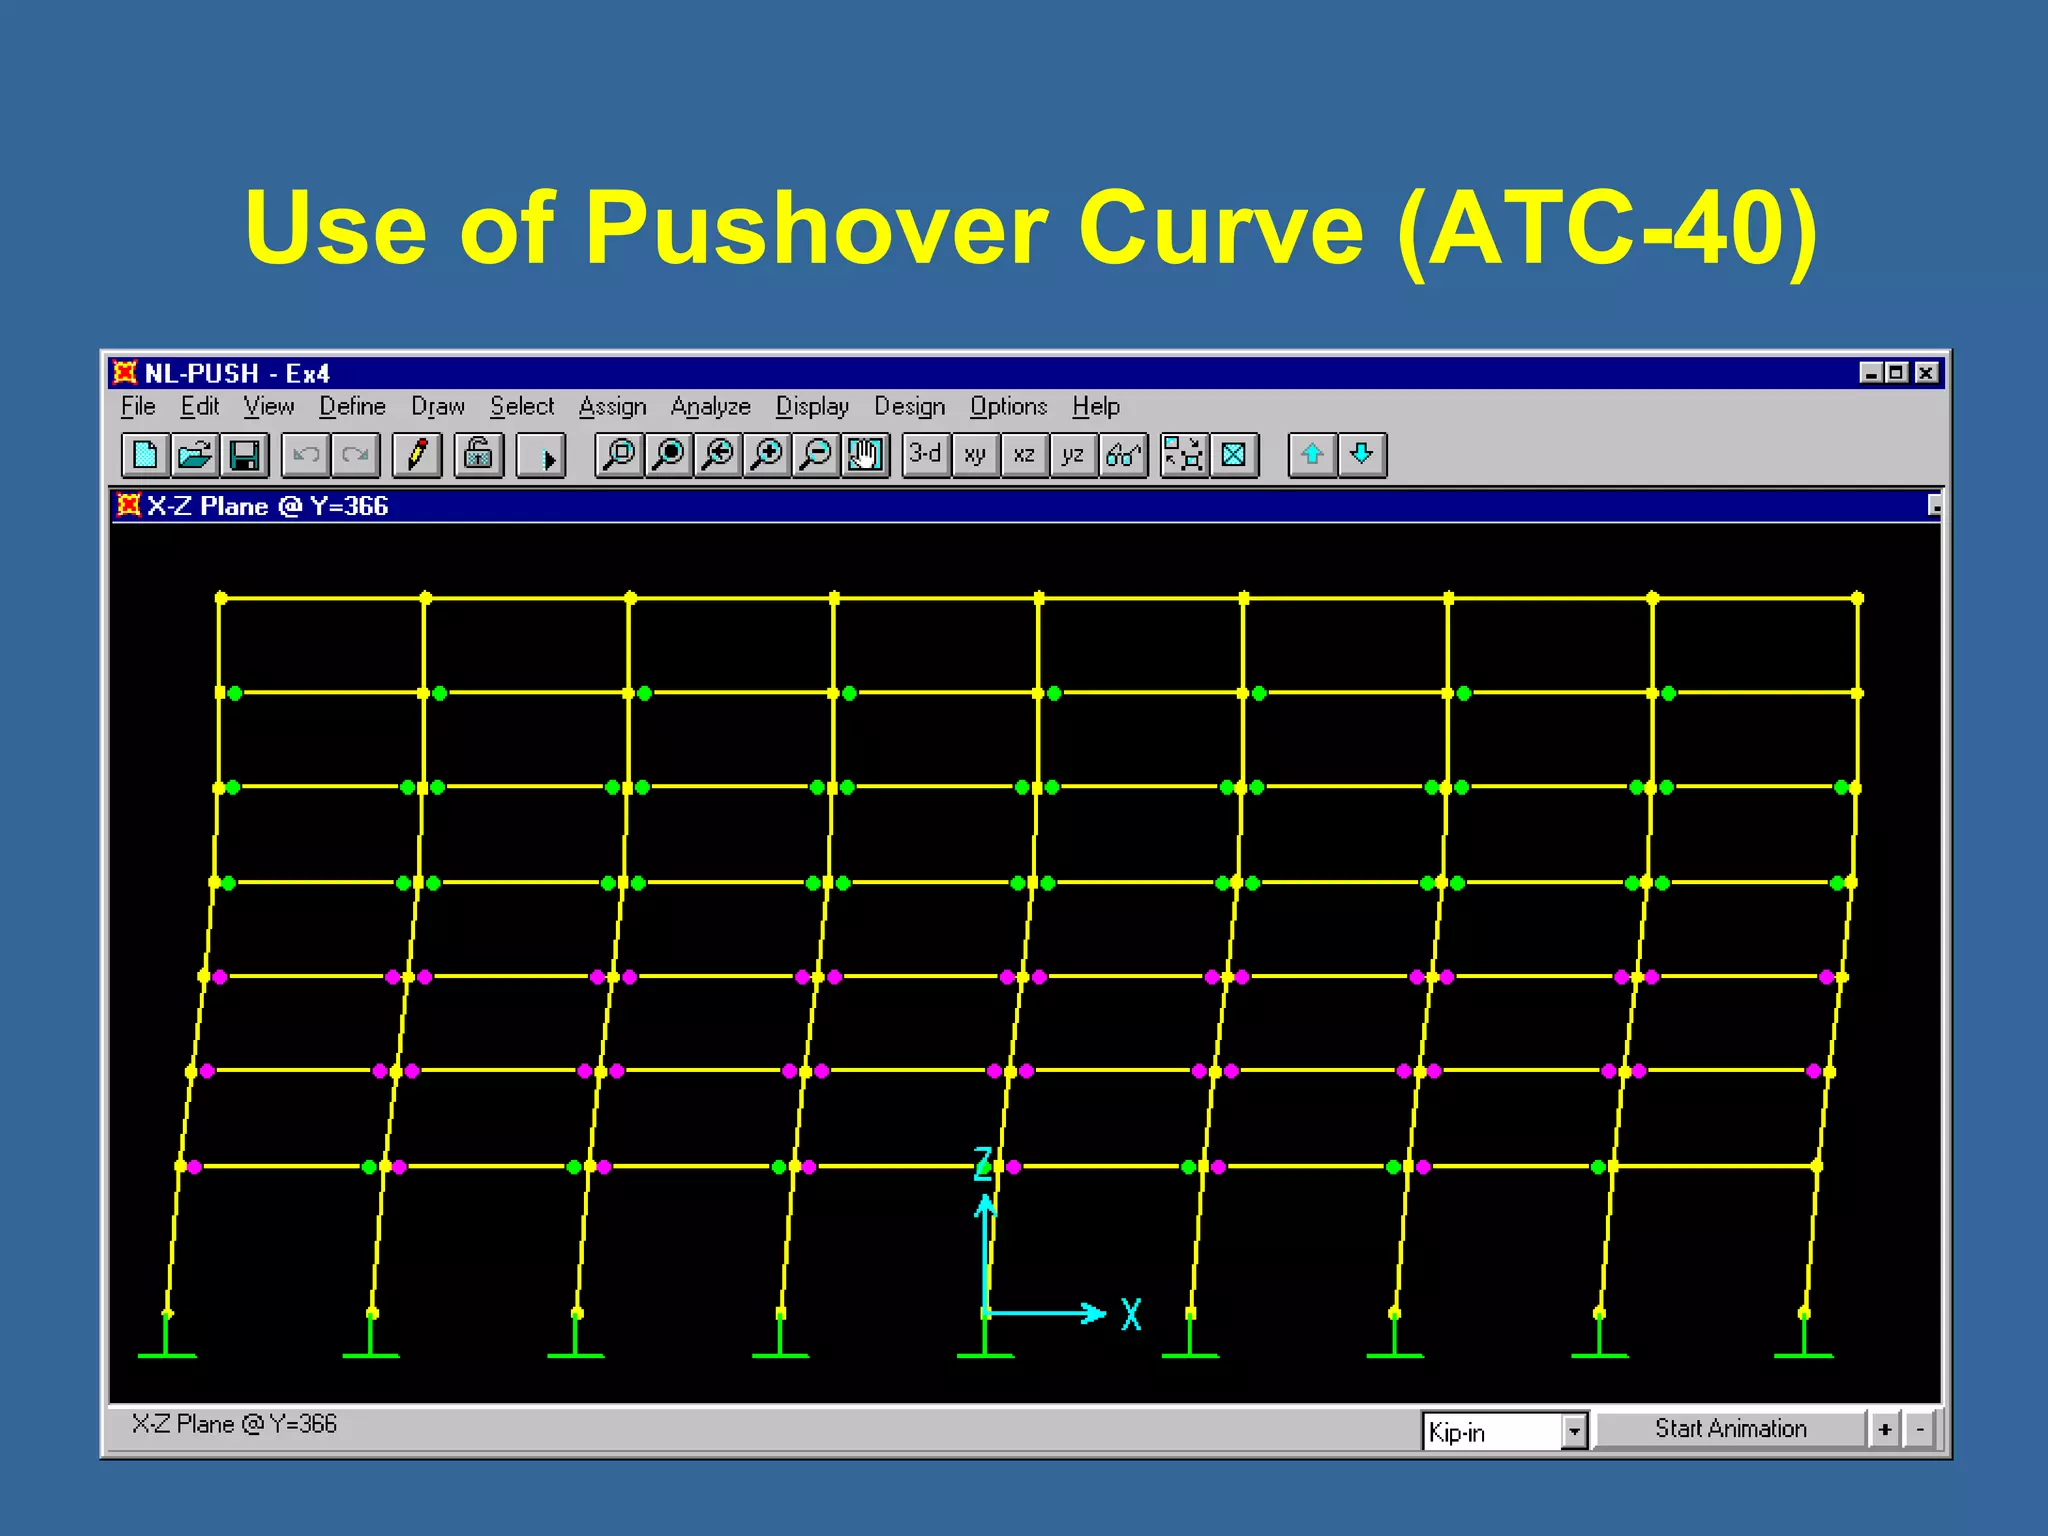
Constructing Pushover Curve
Define Structural Model
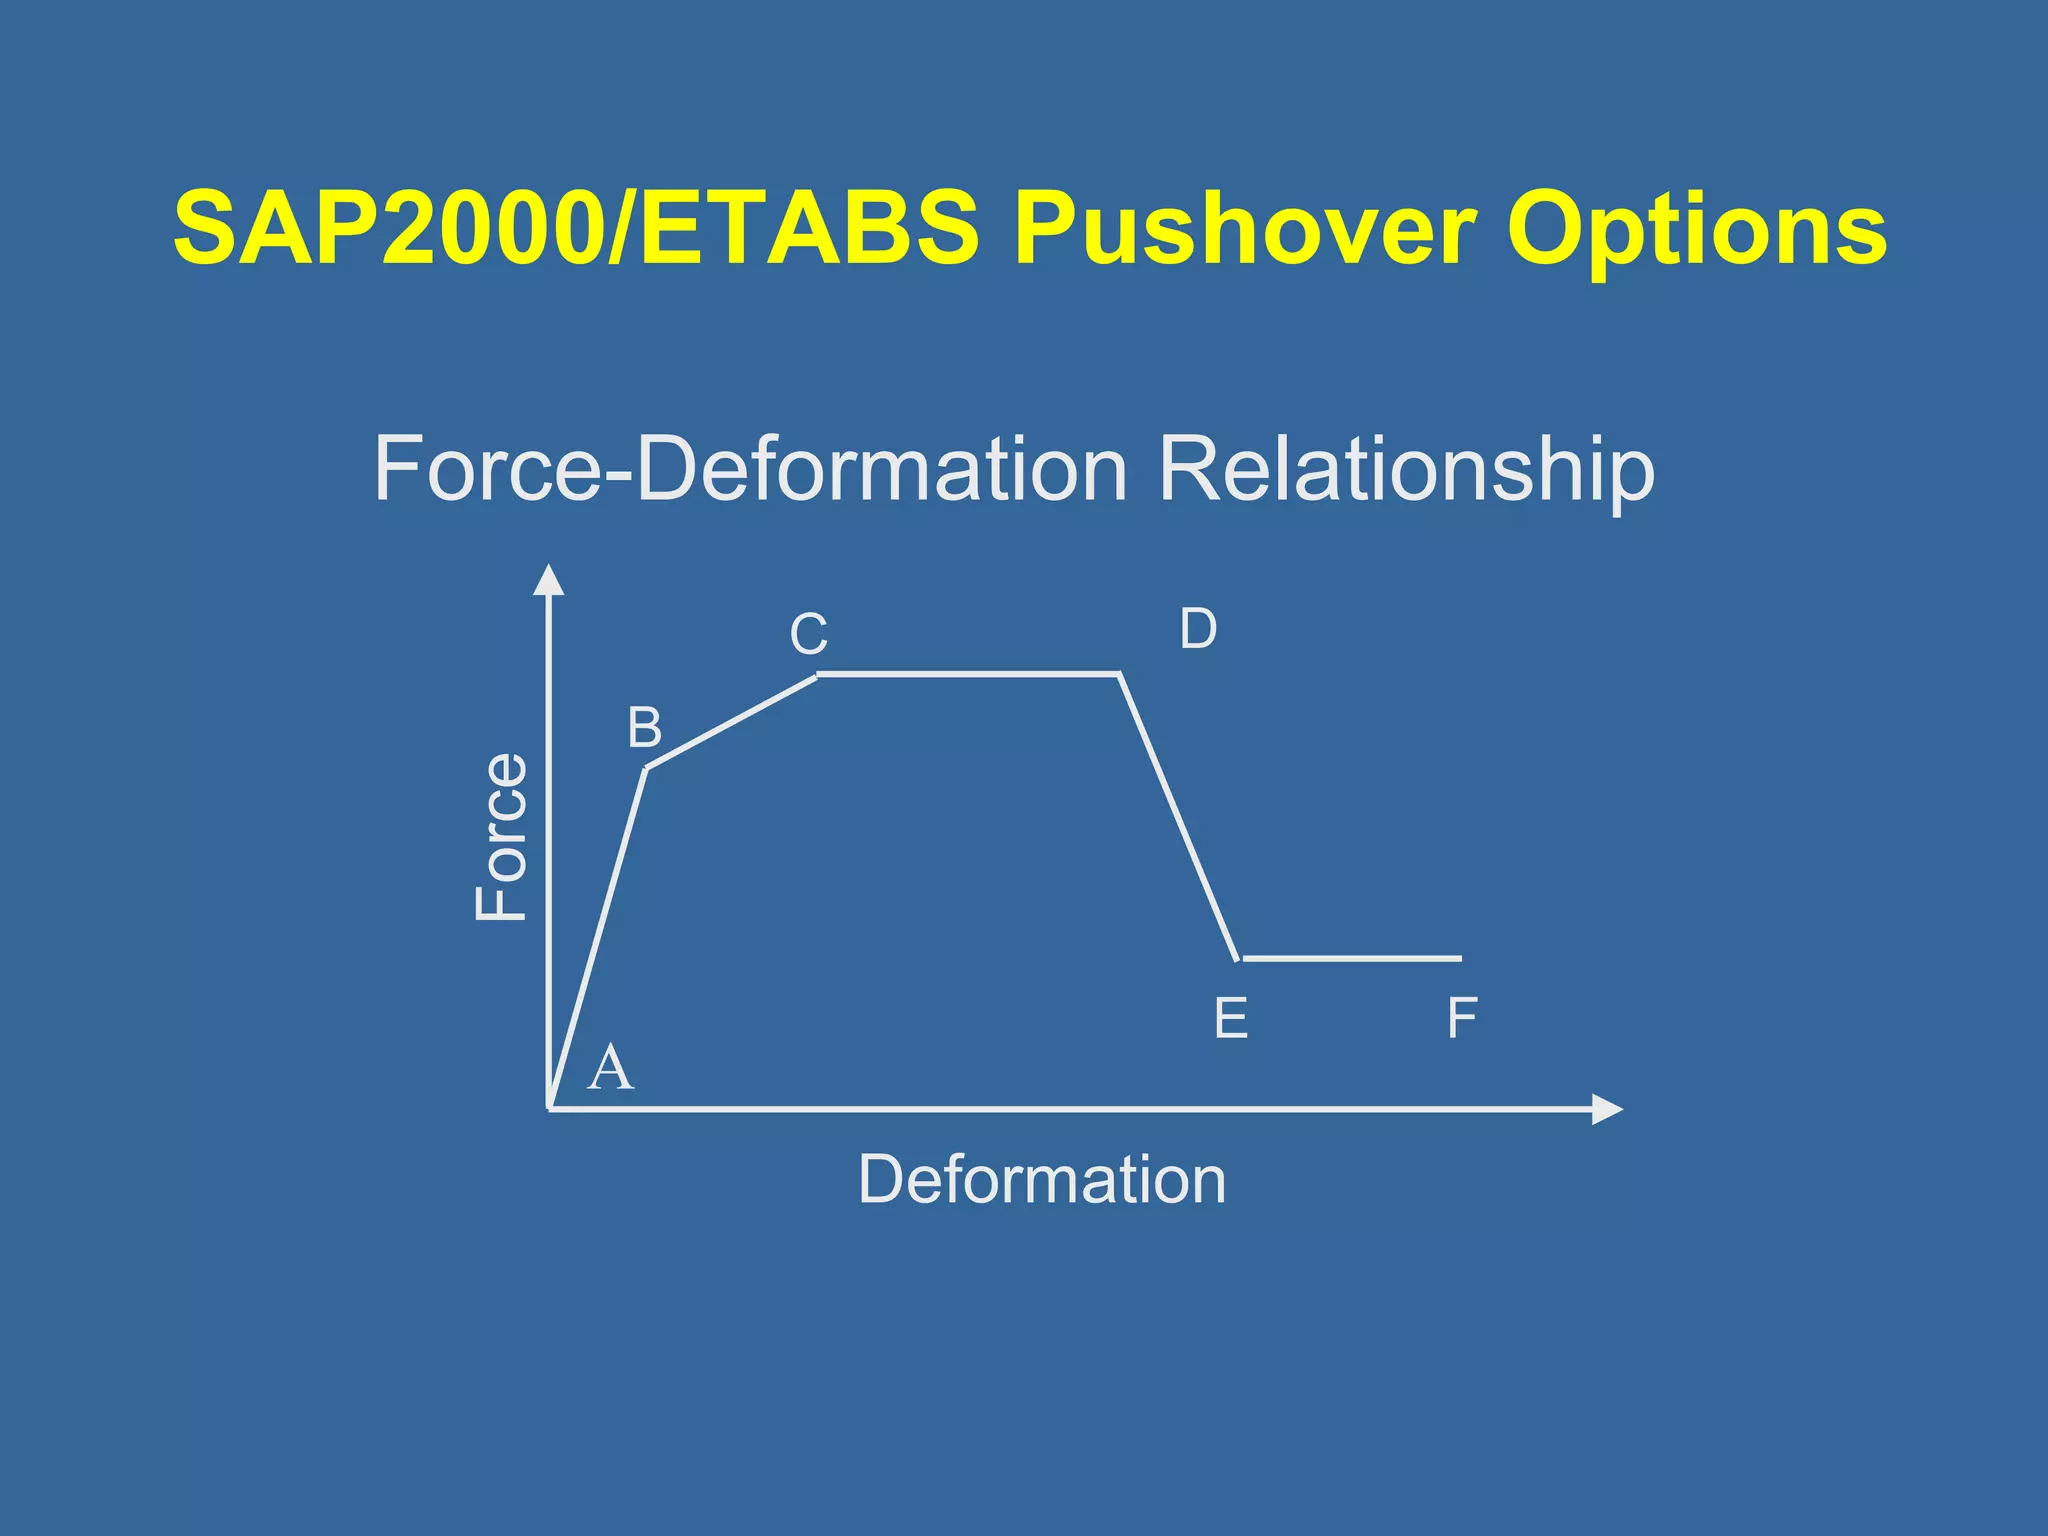
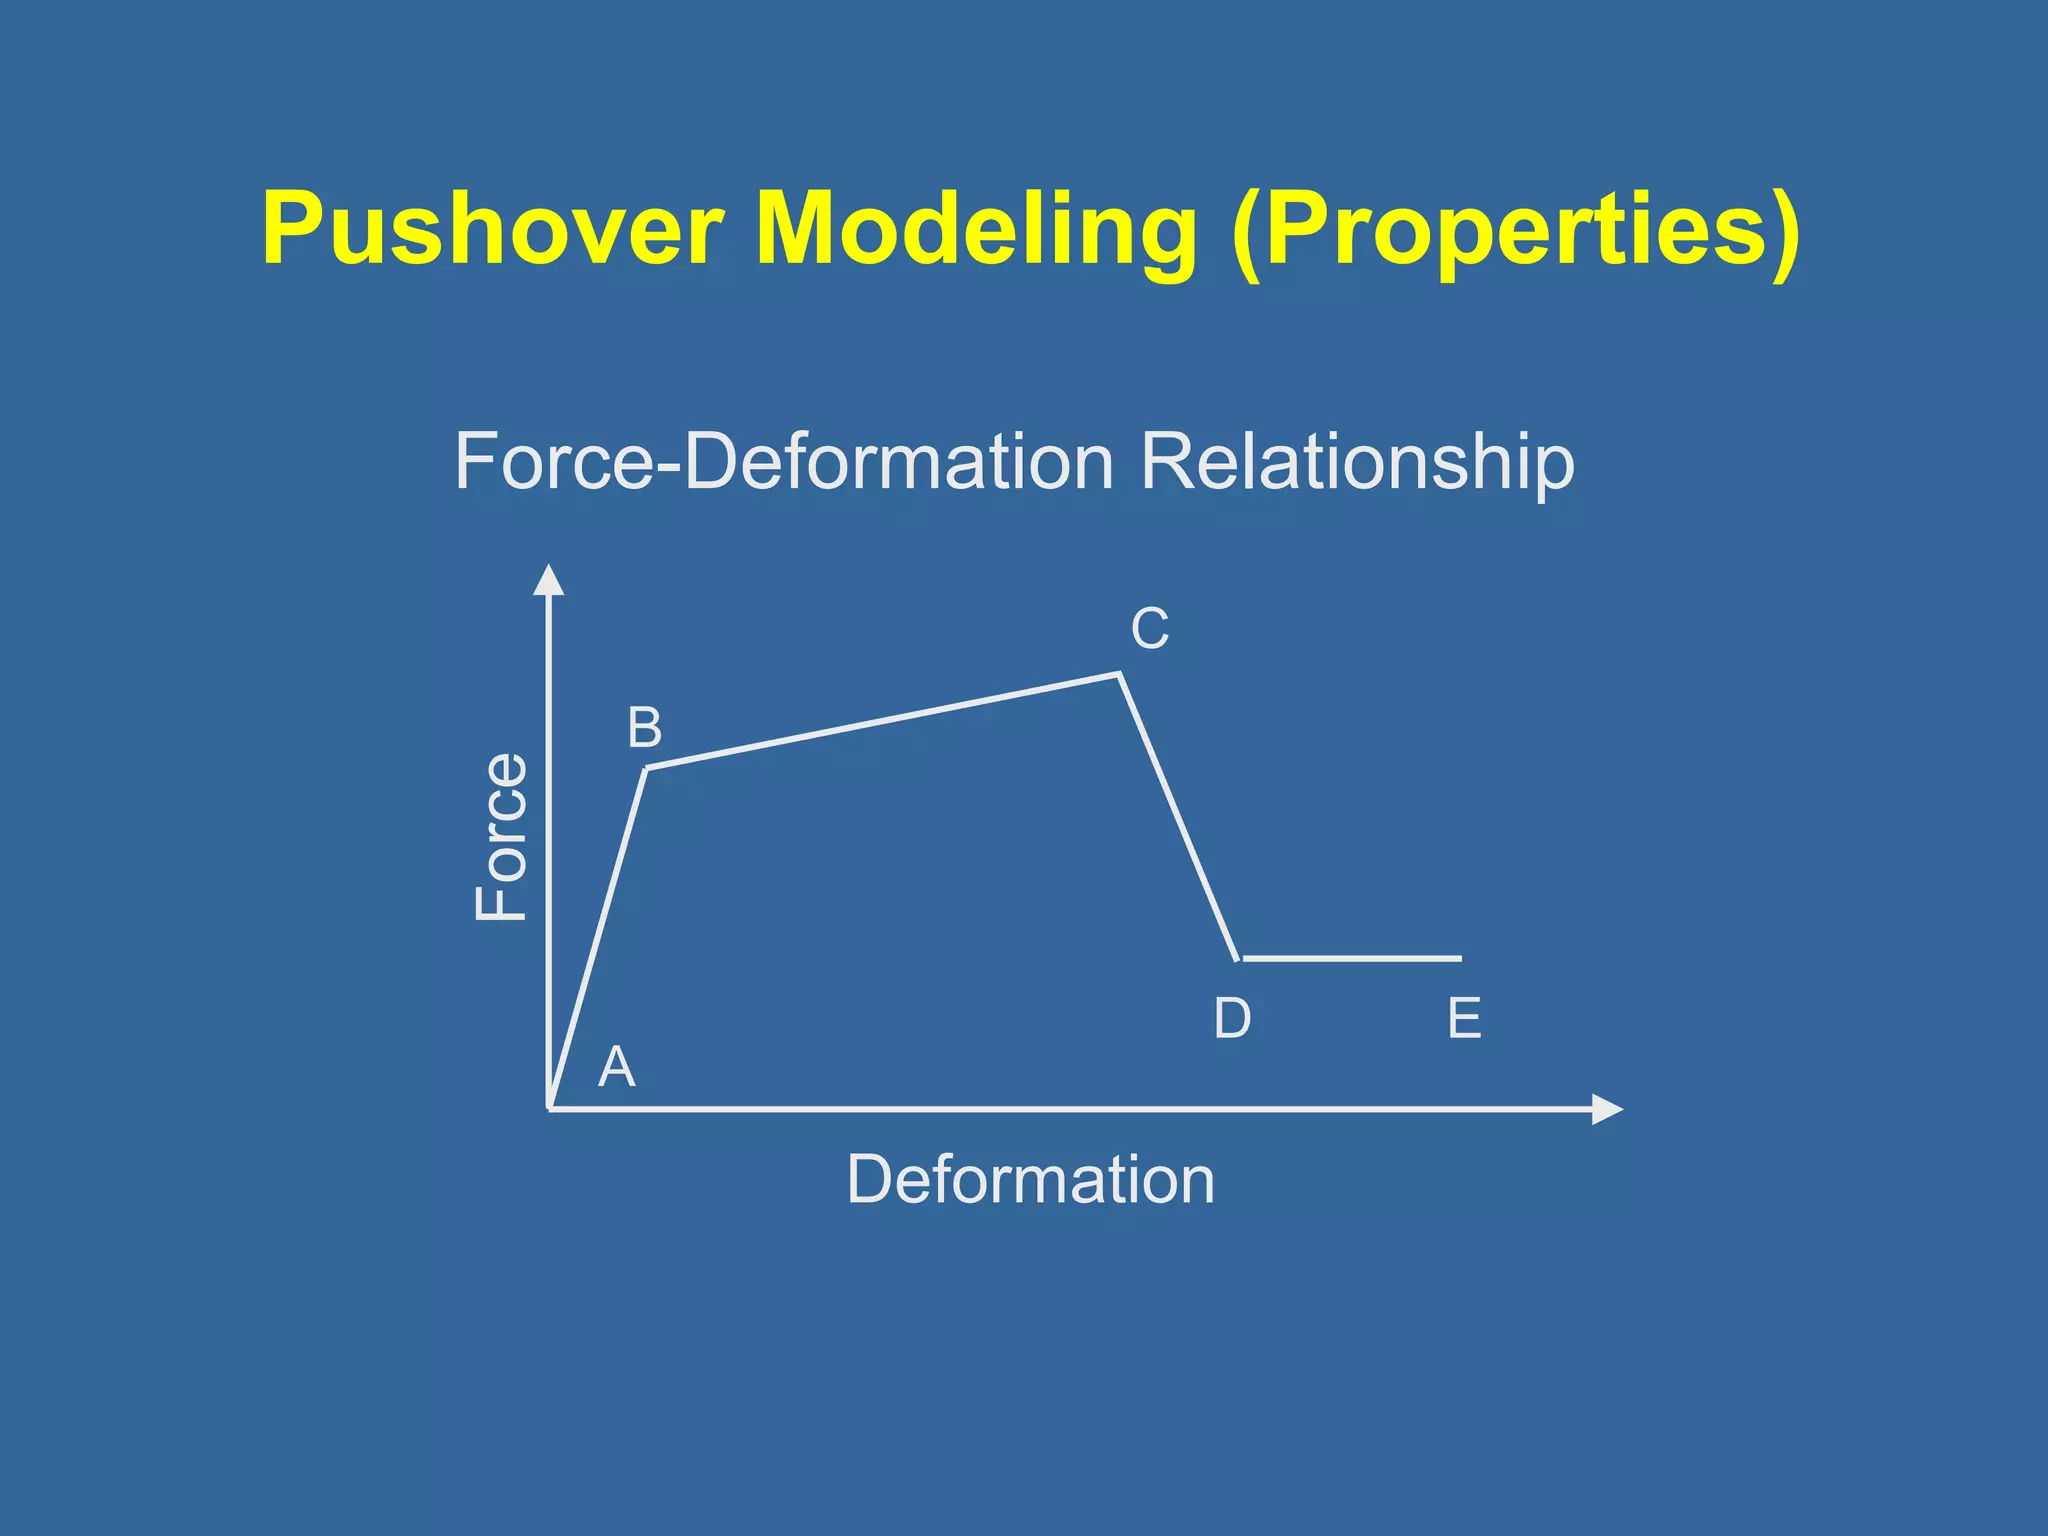
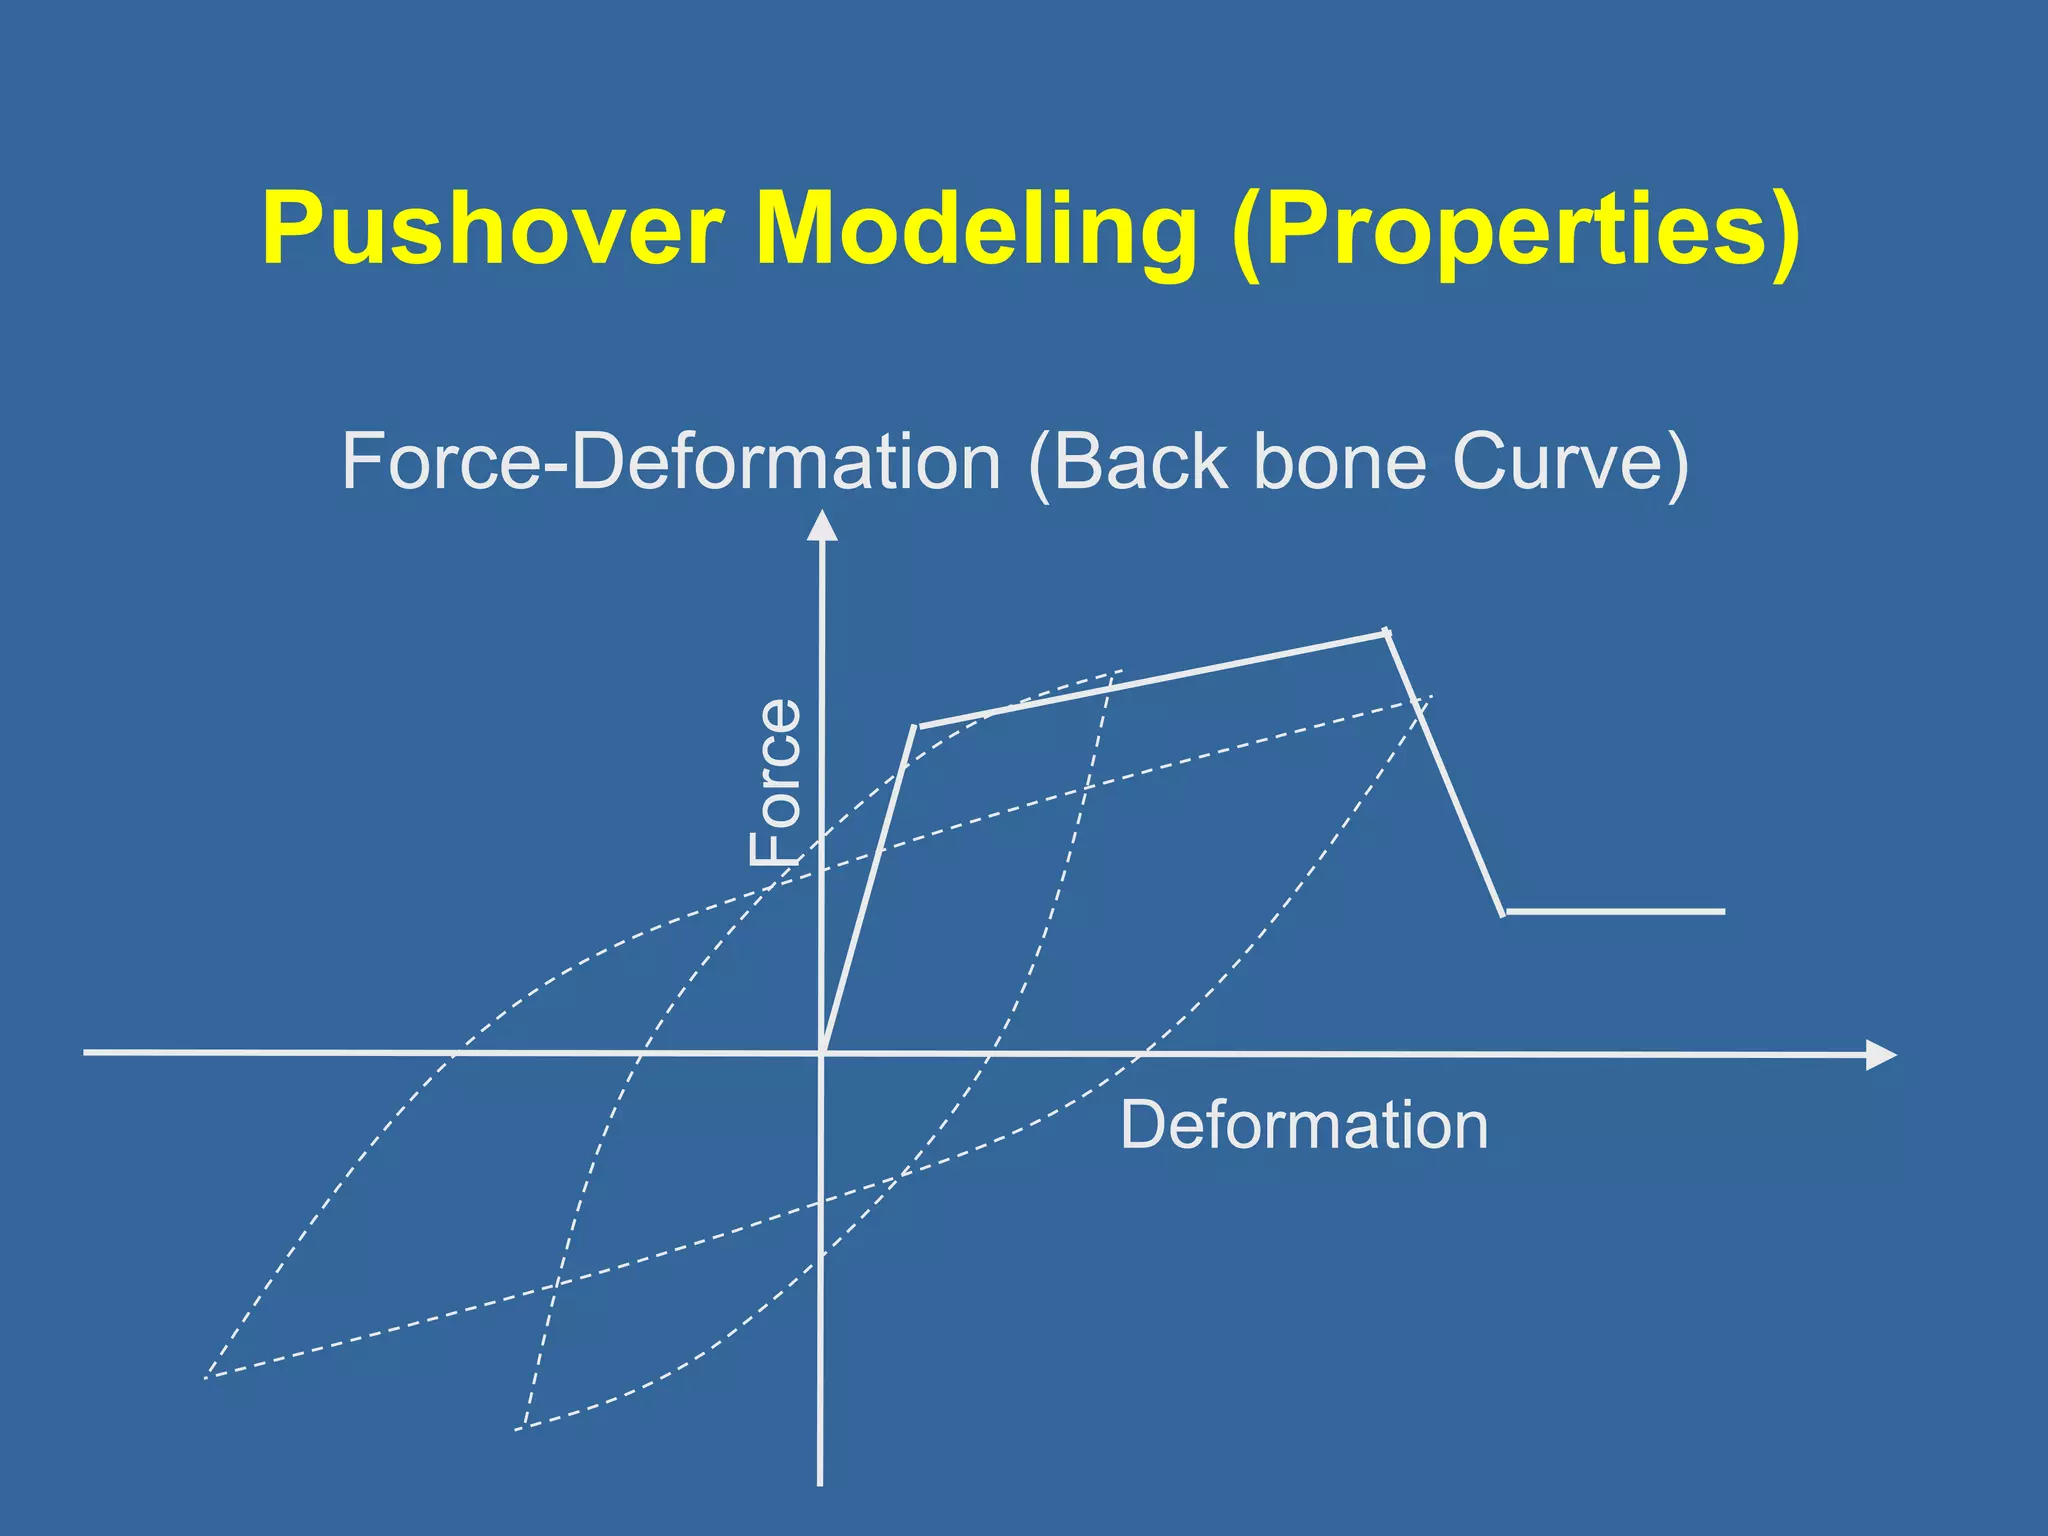
Elements (components)
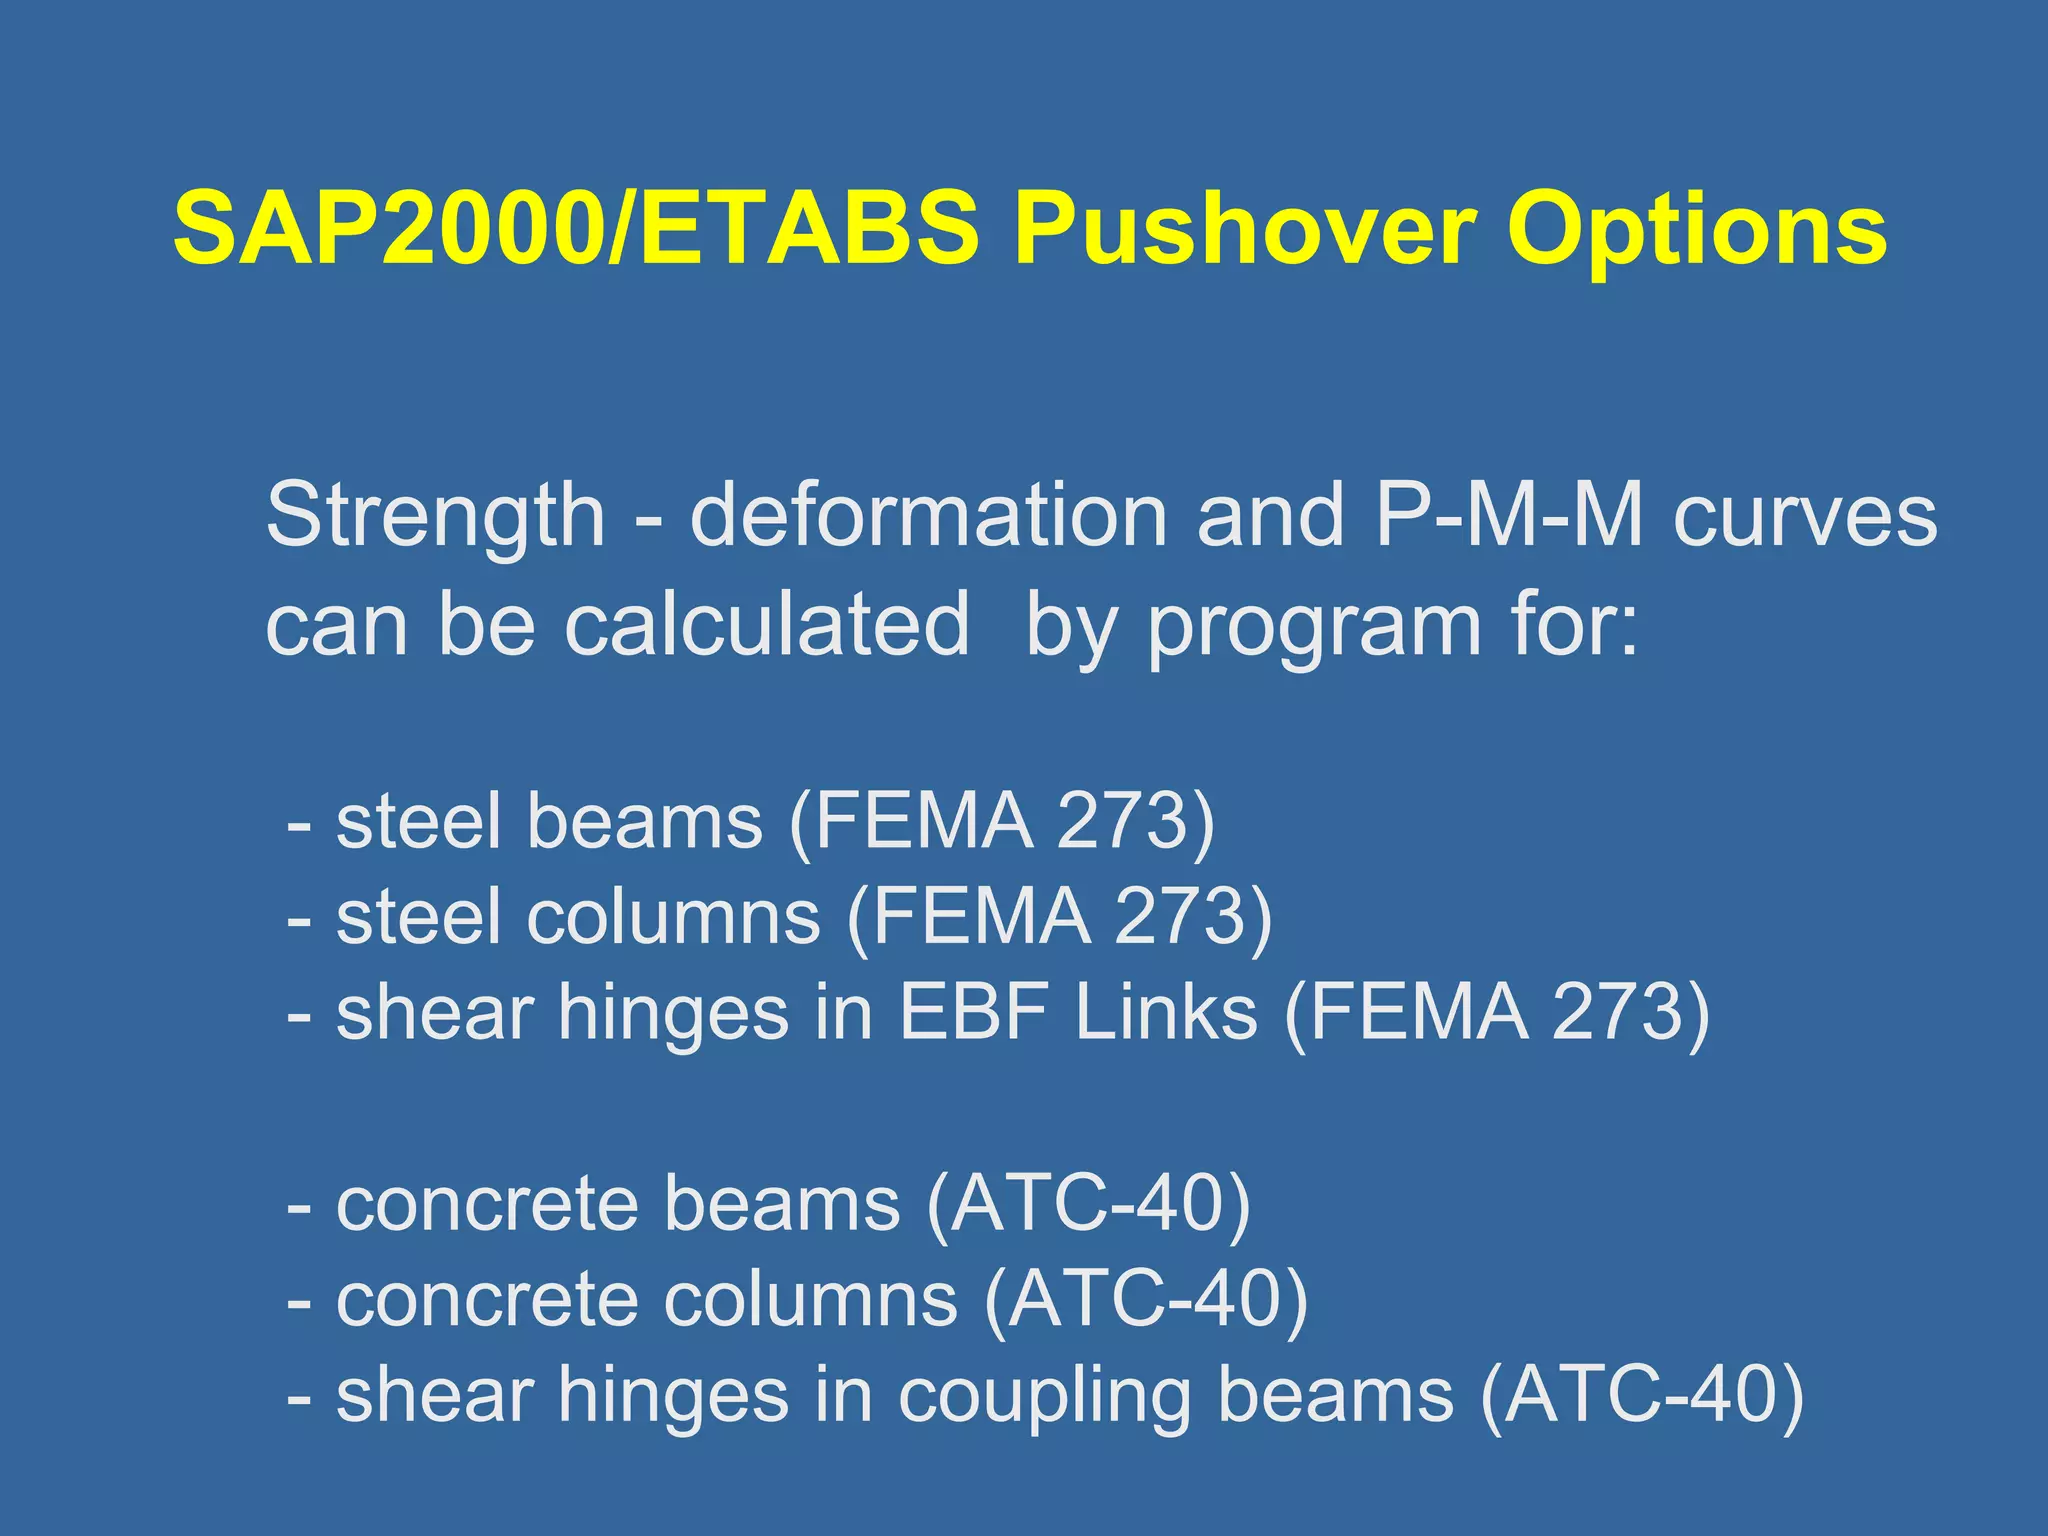
Strength - deformation properties
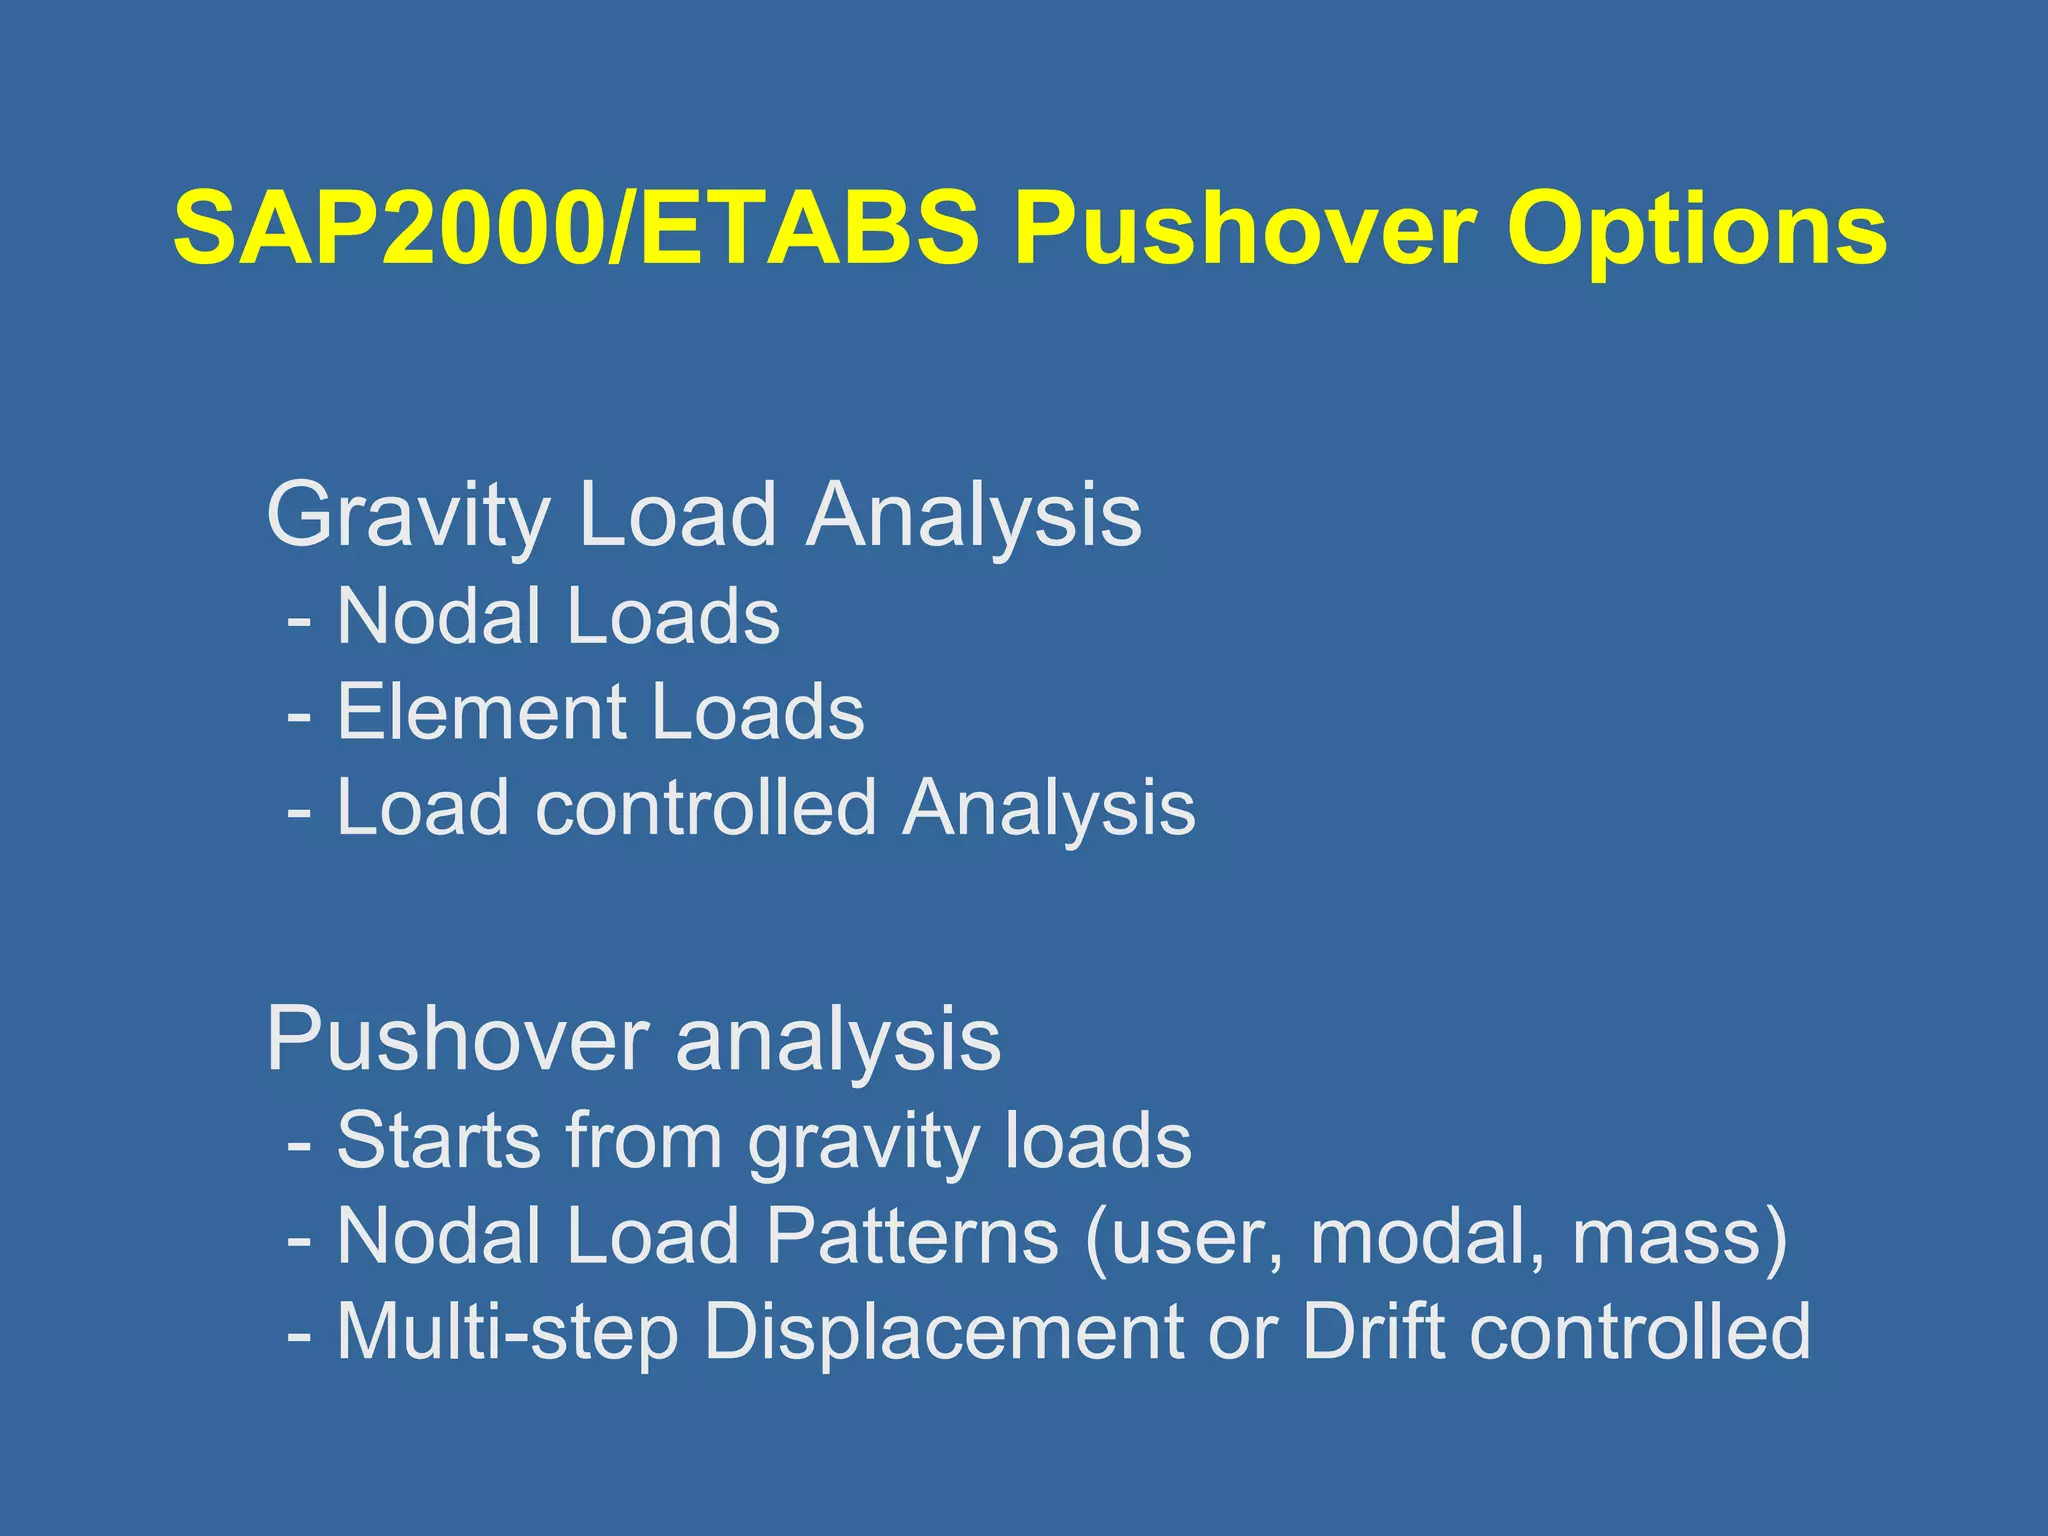
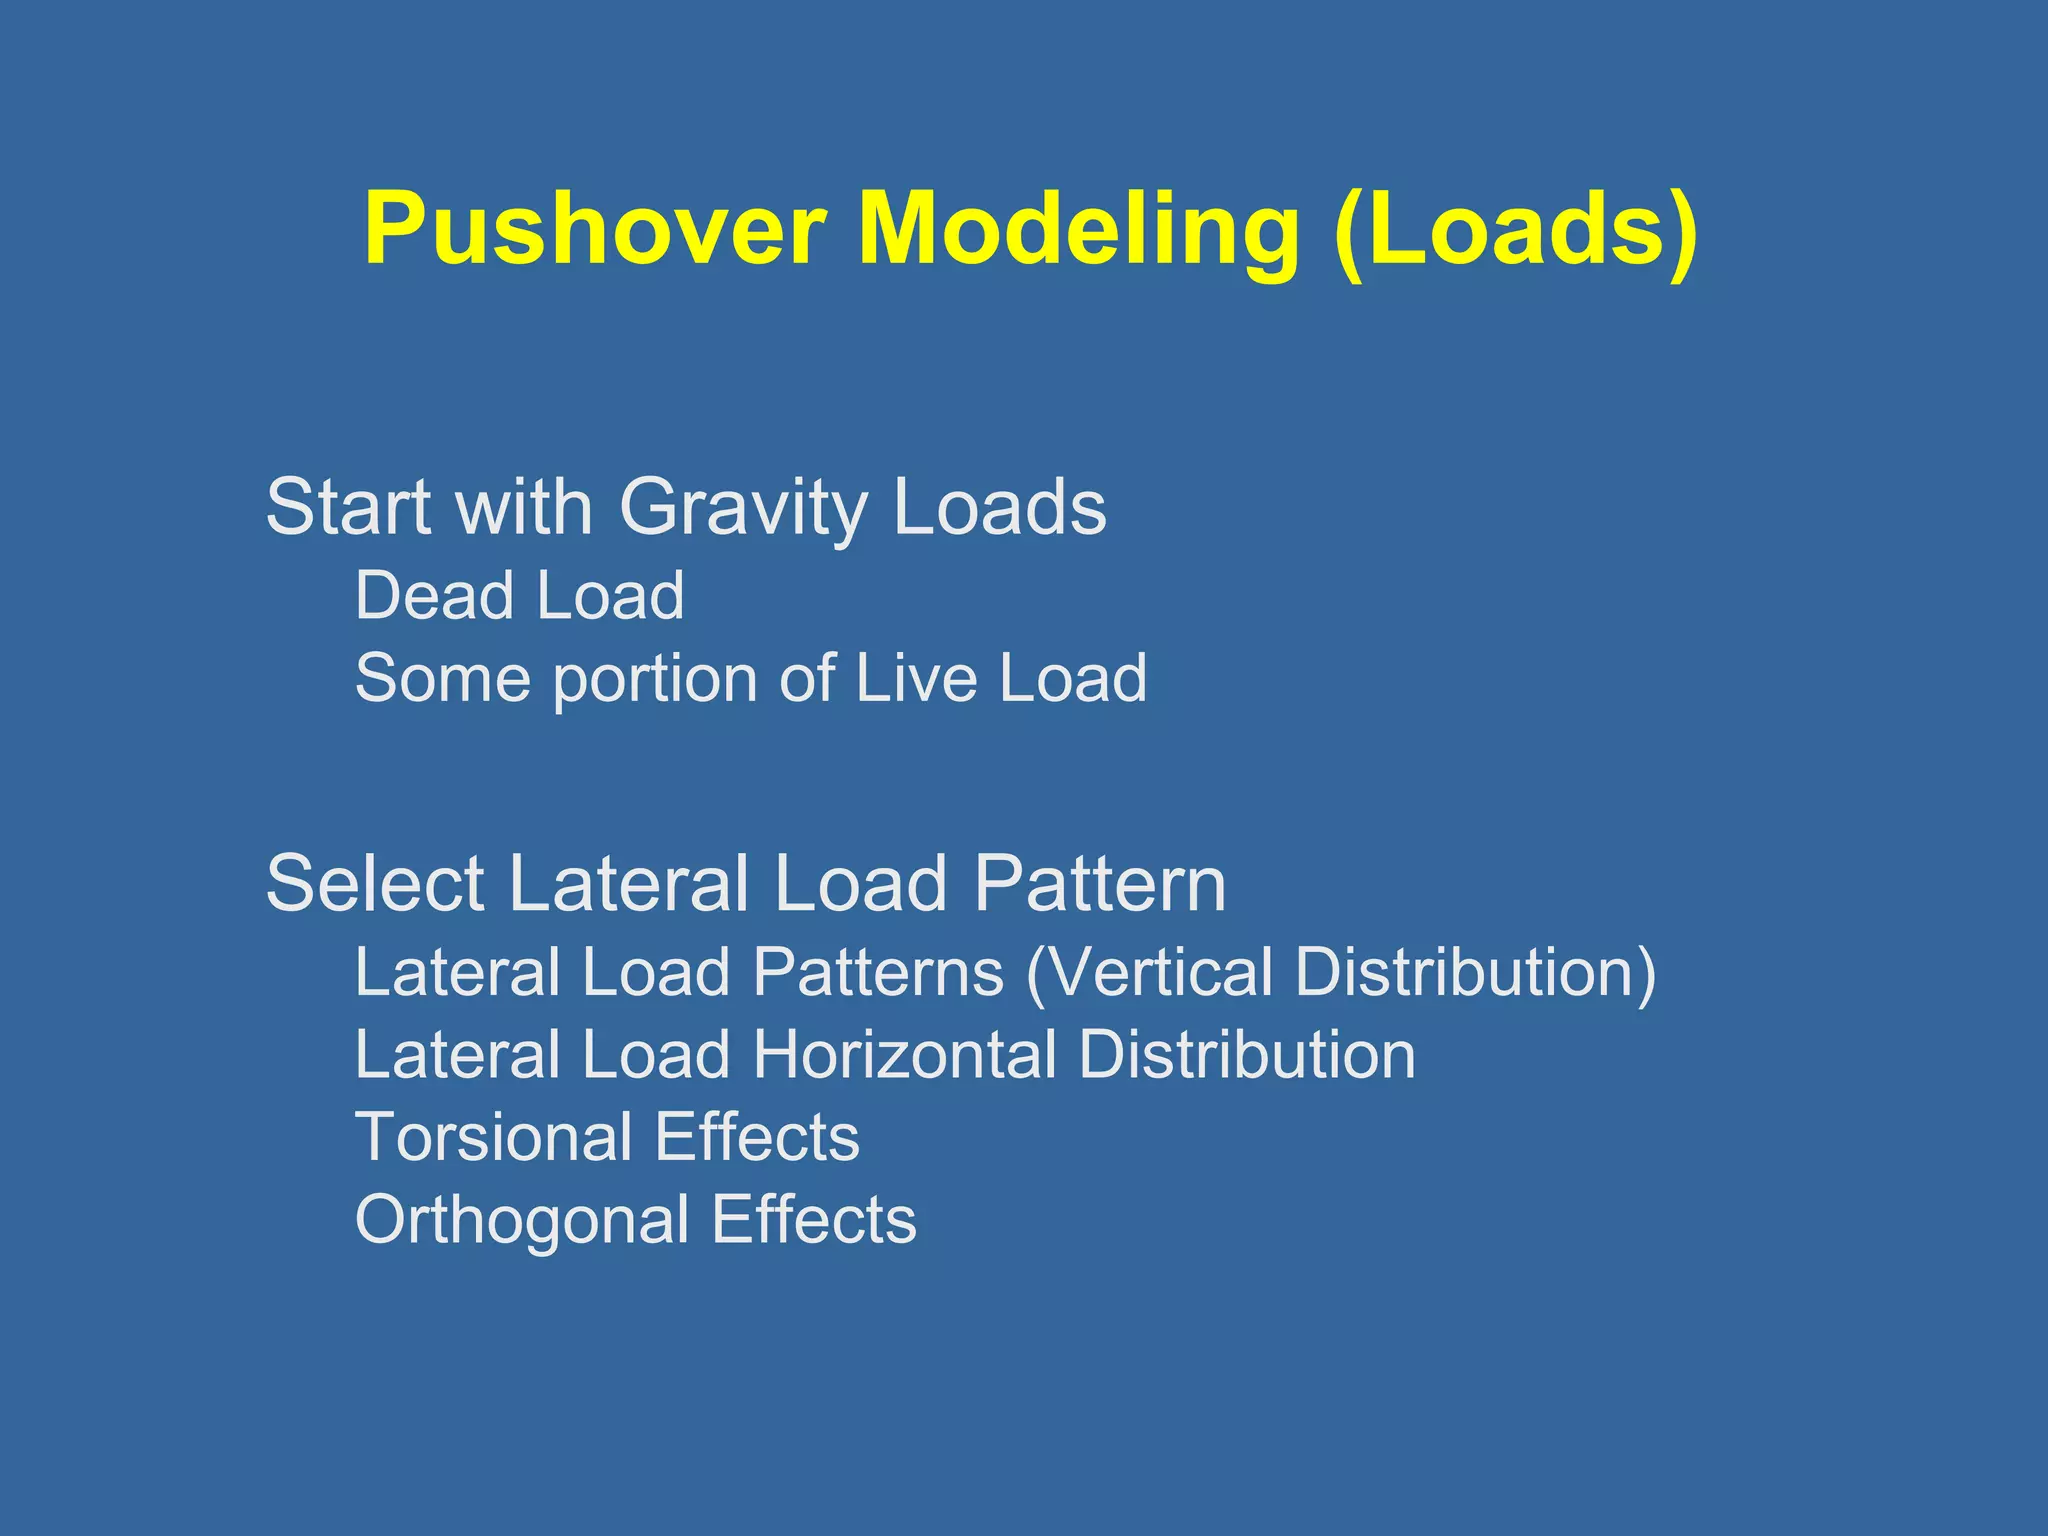
Define Loads
Gravity
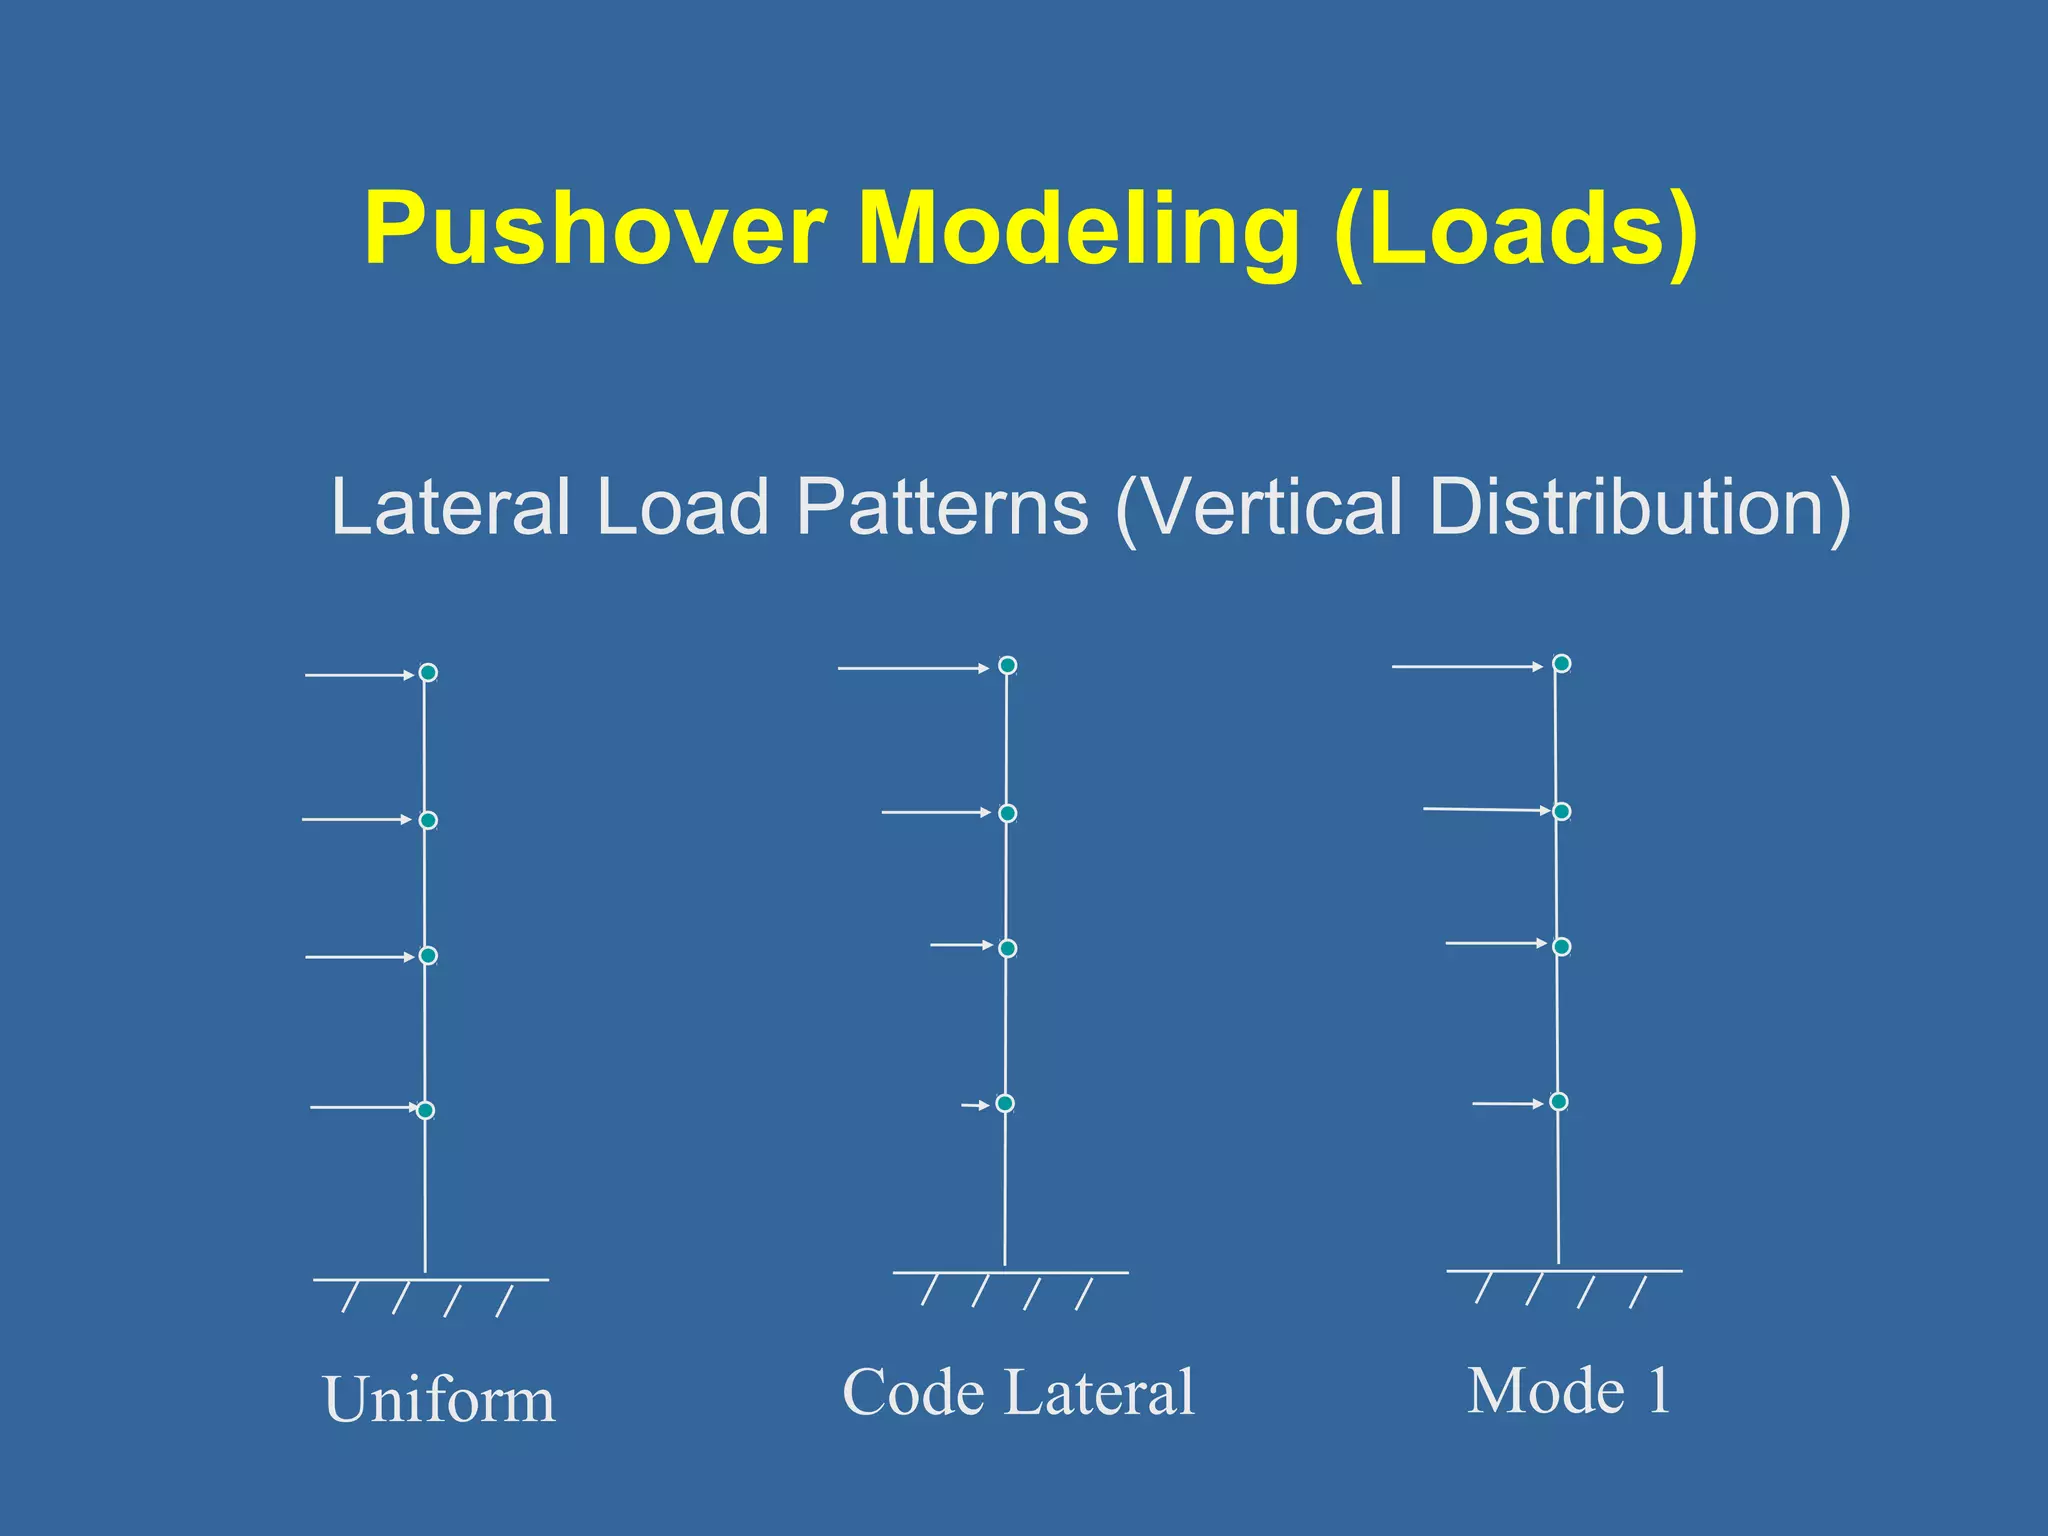
Lateral load pattern
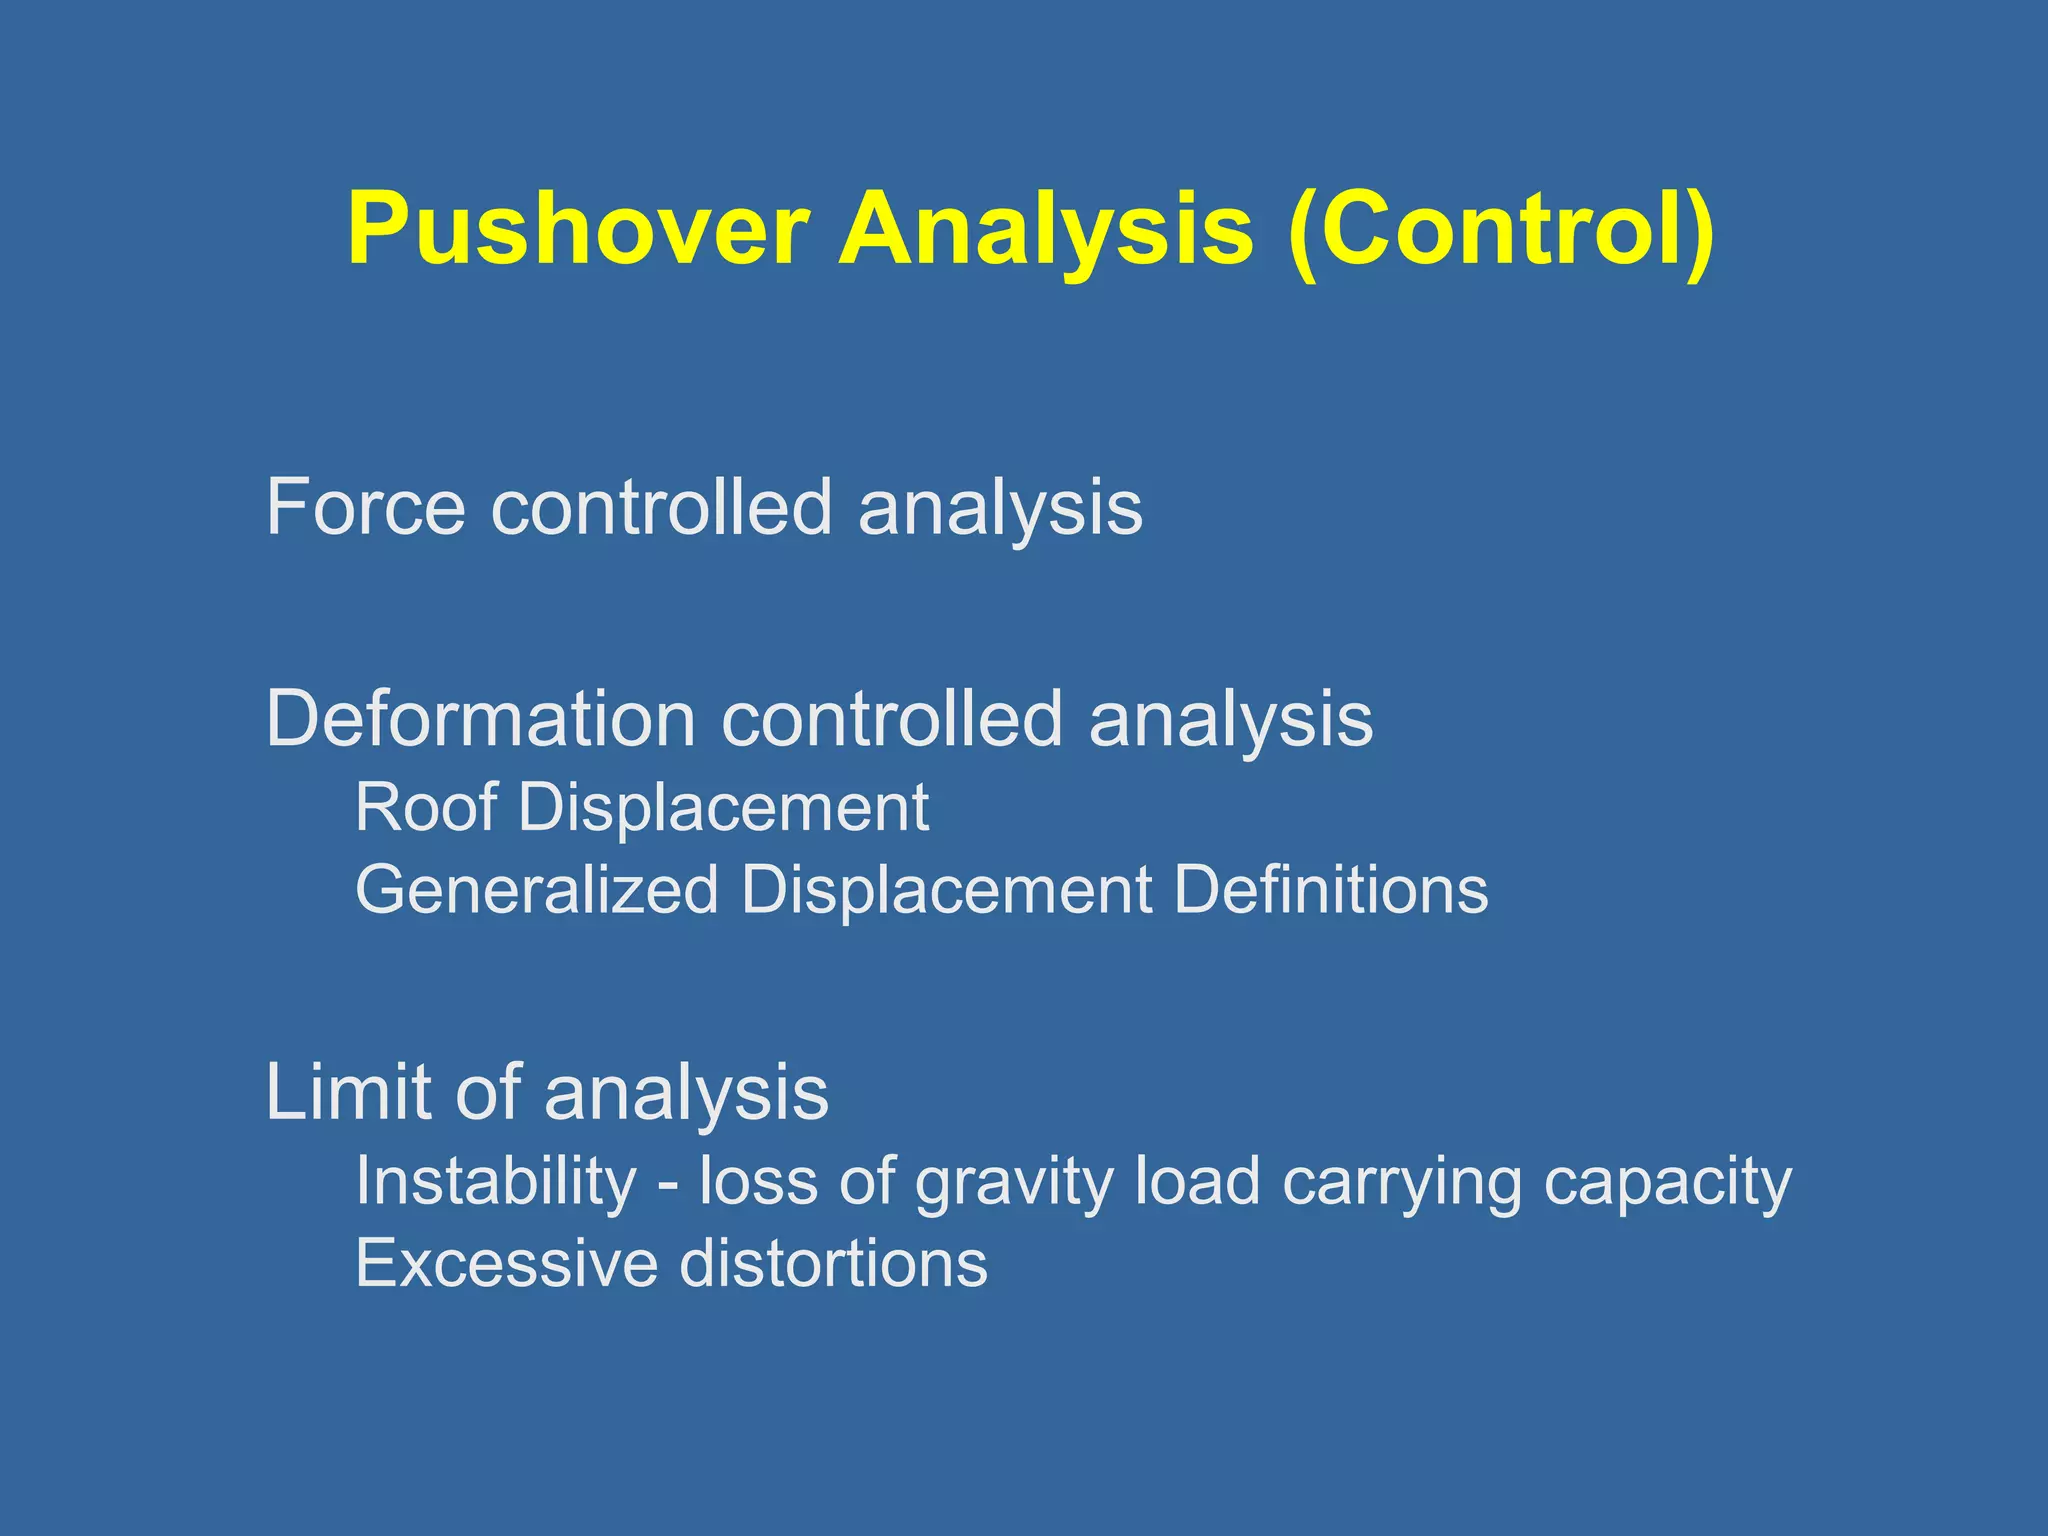
Select Control Displacements or Drifts
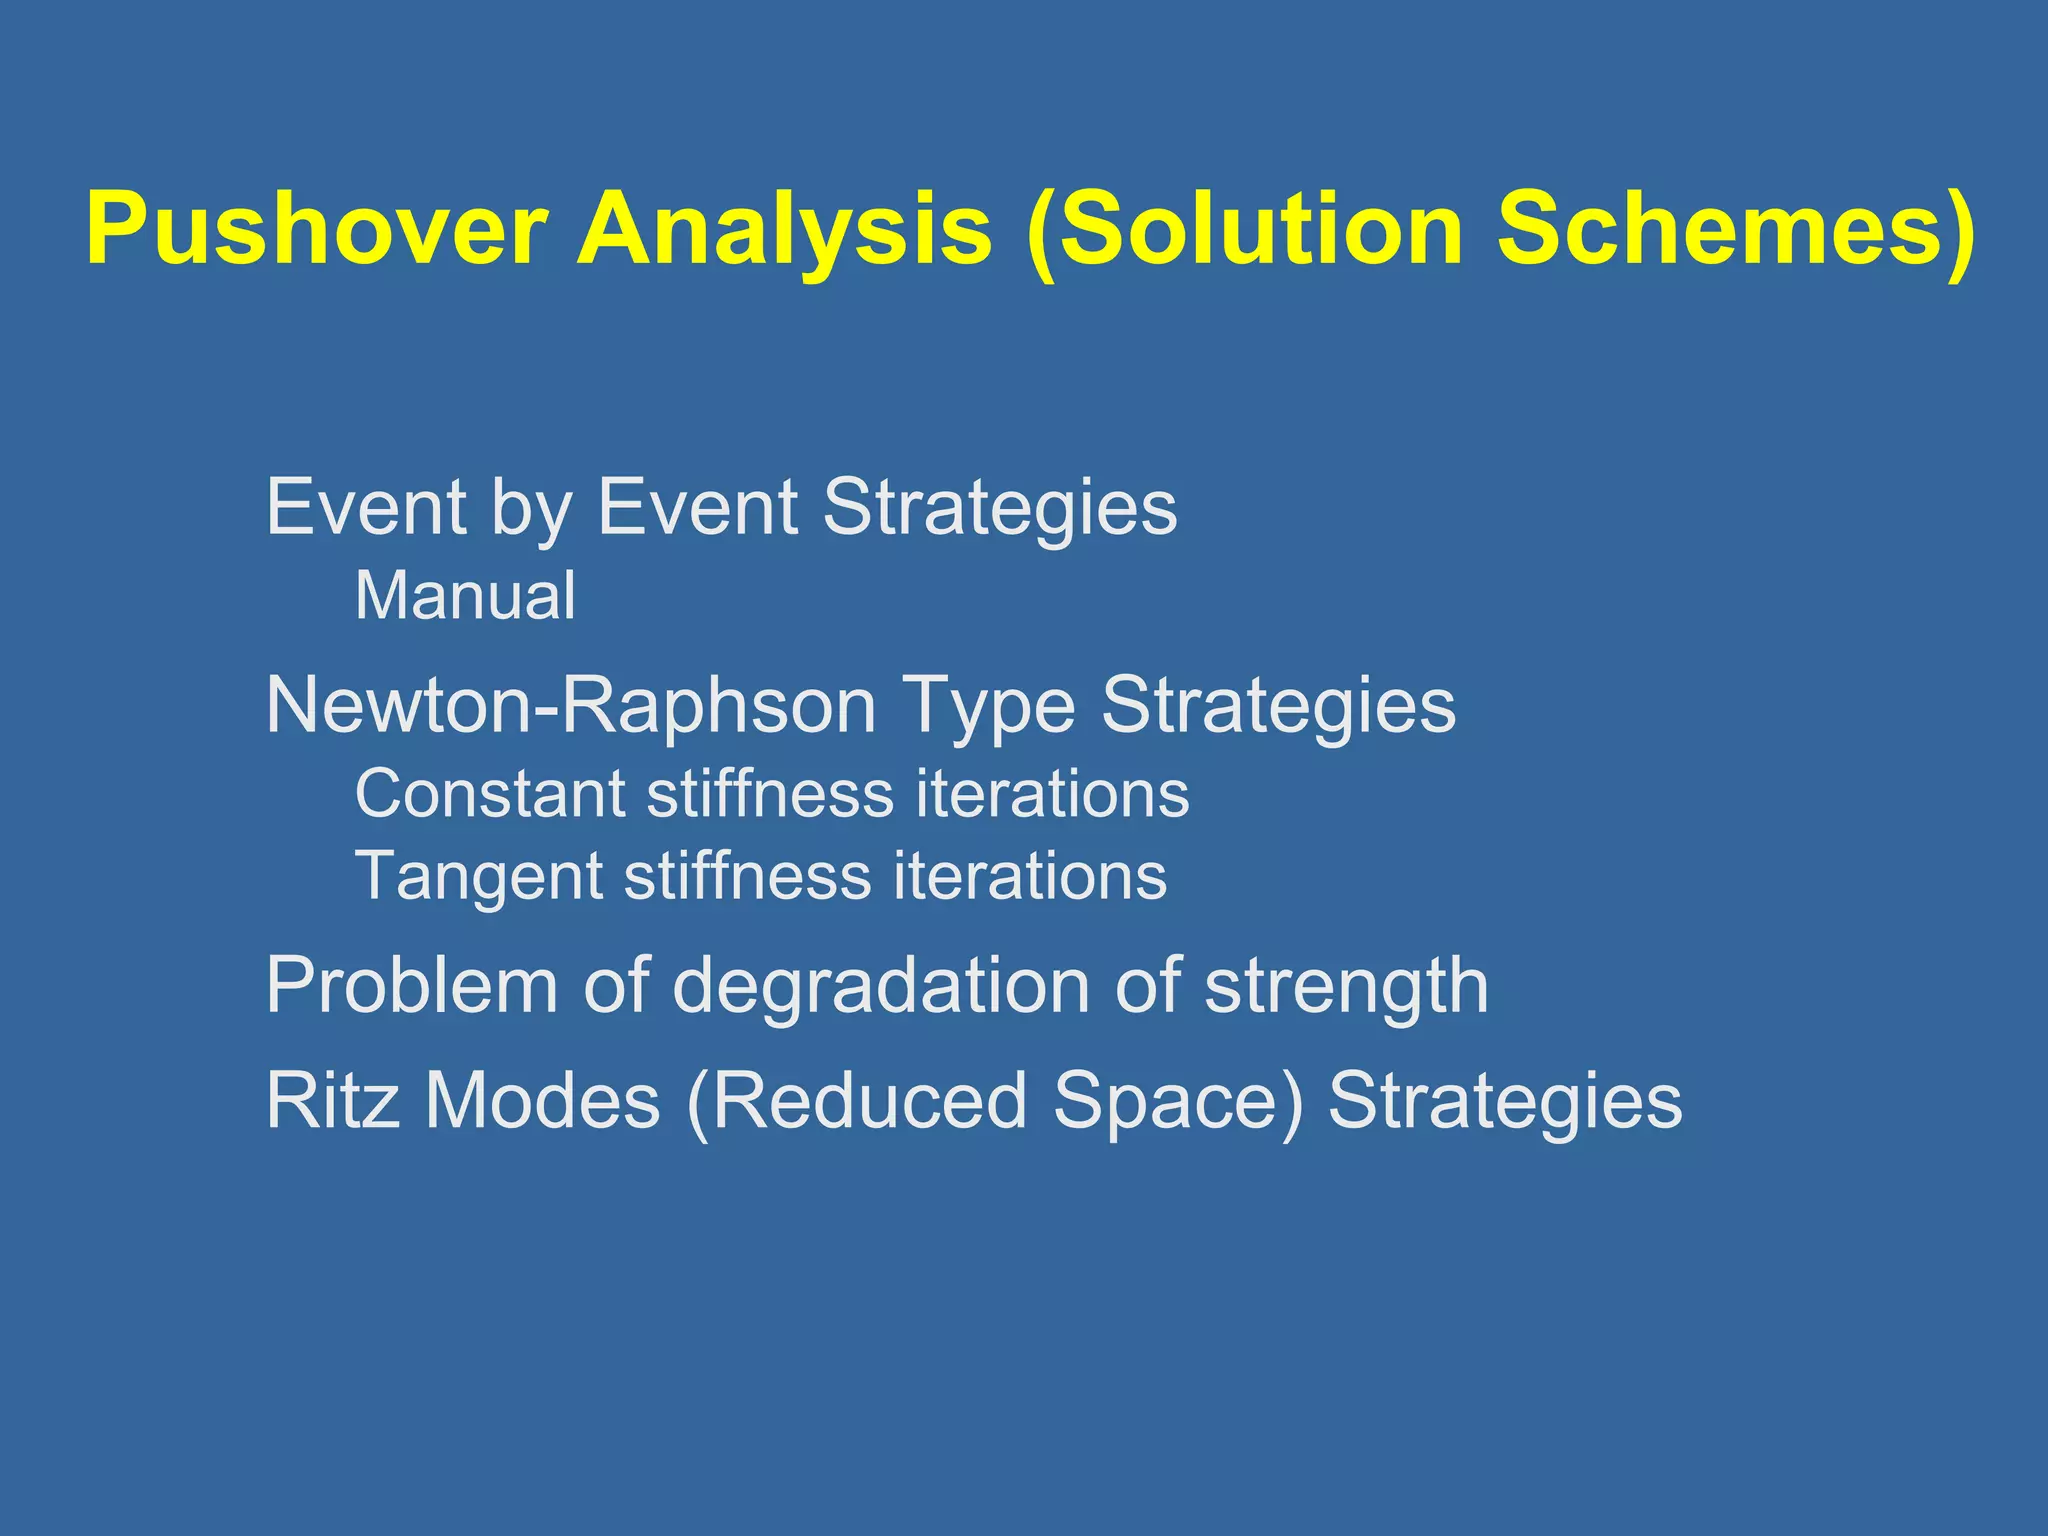
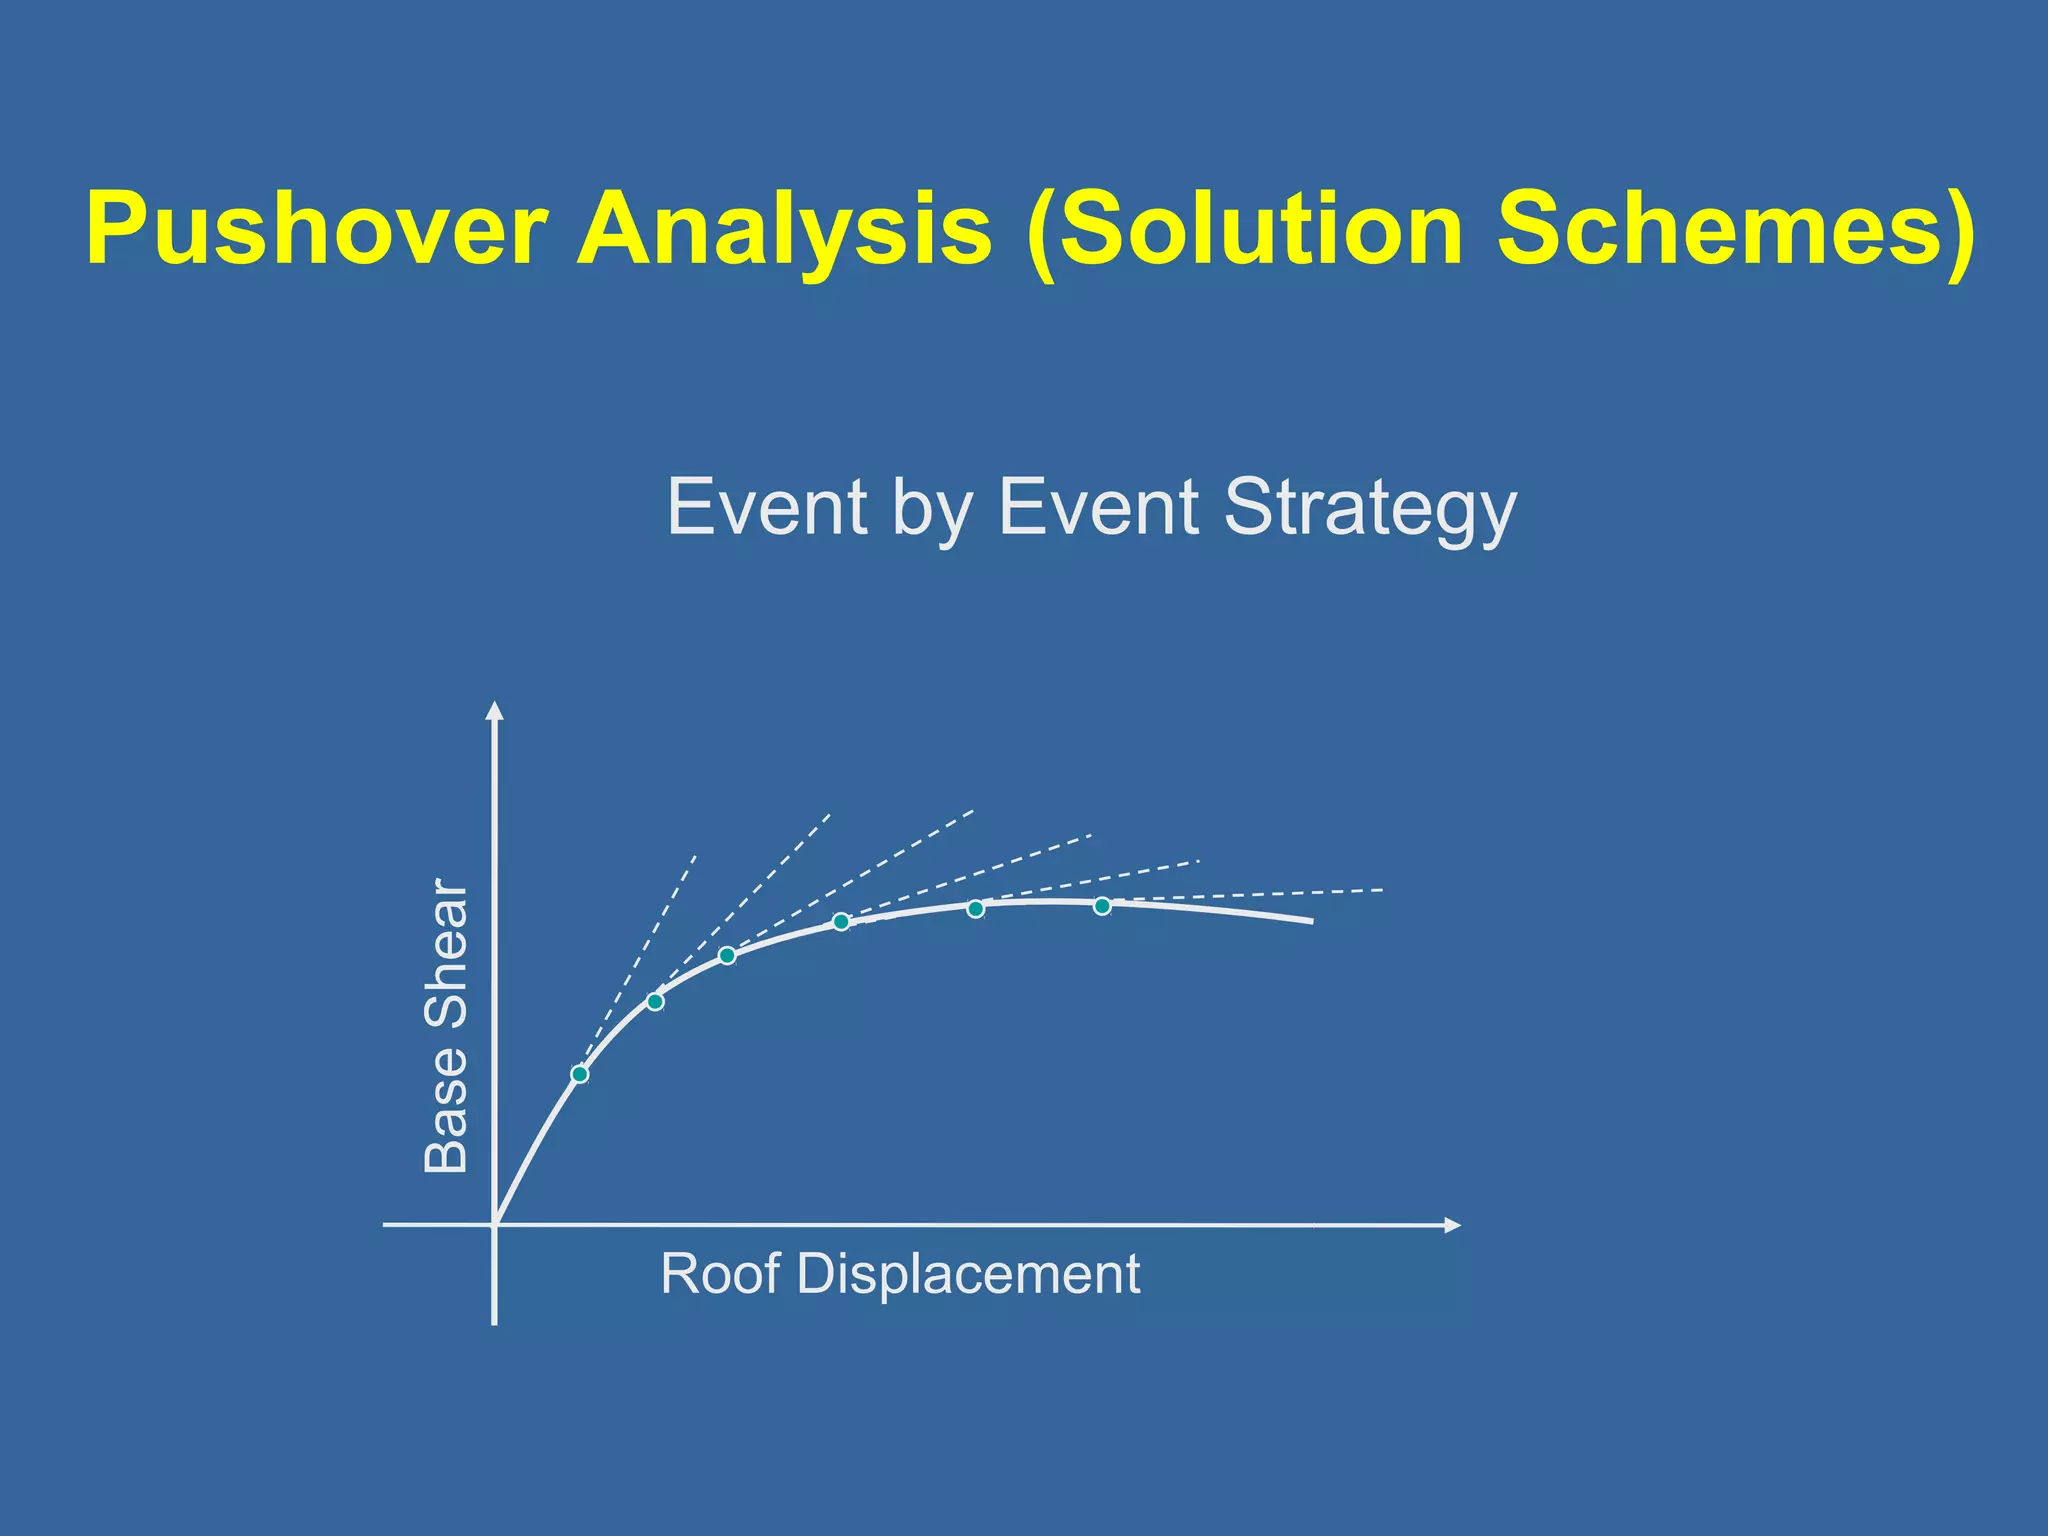
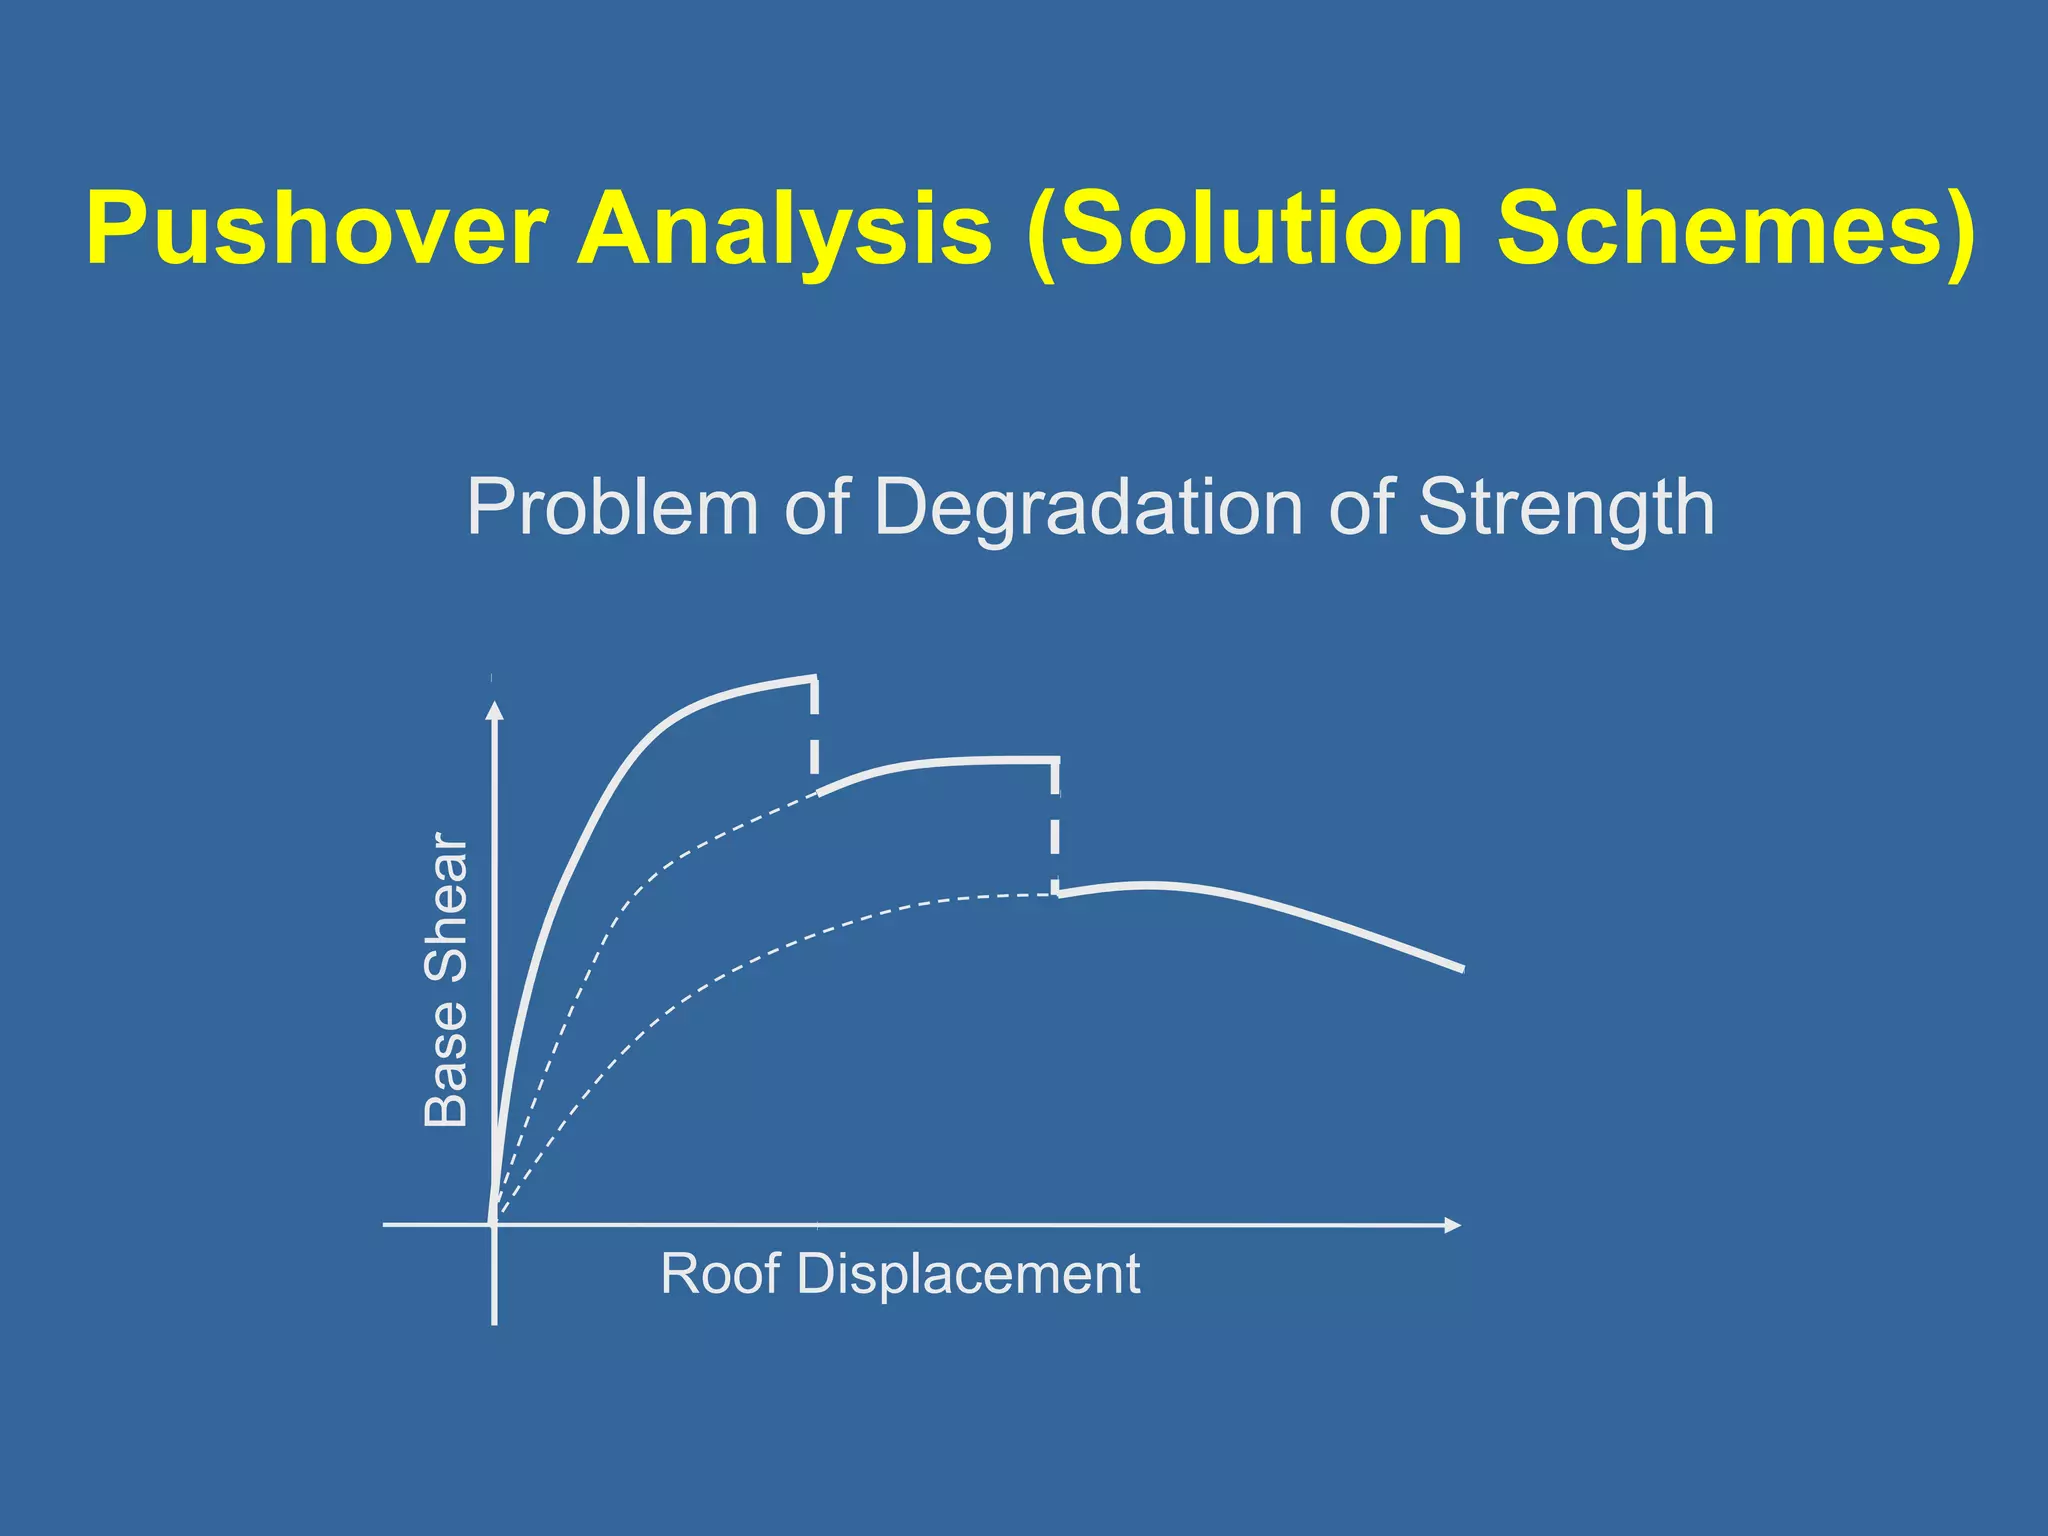
Perform Pushover Analysis
9.
Pushover Modeling
Definitionof Structural Model
3D or 2D
Primary and Secondary Elements (components)
Non structural Elements
Foundation flexibility
P-Delta effects
10.
Pushover Modeling (Elements)
Types
Truss - yielding and buckling
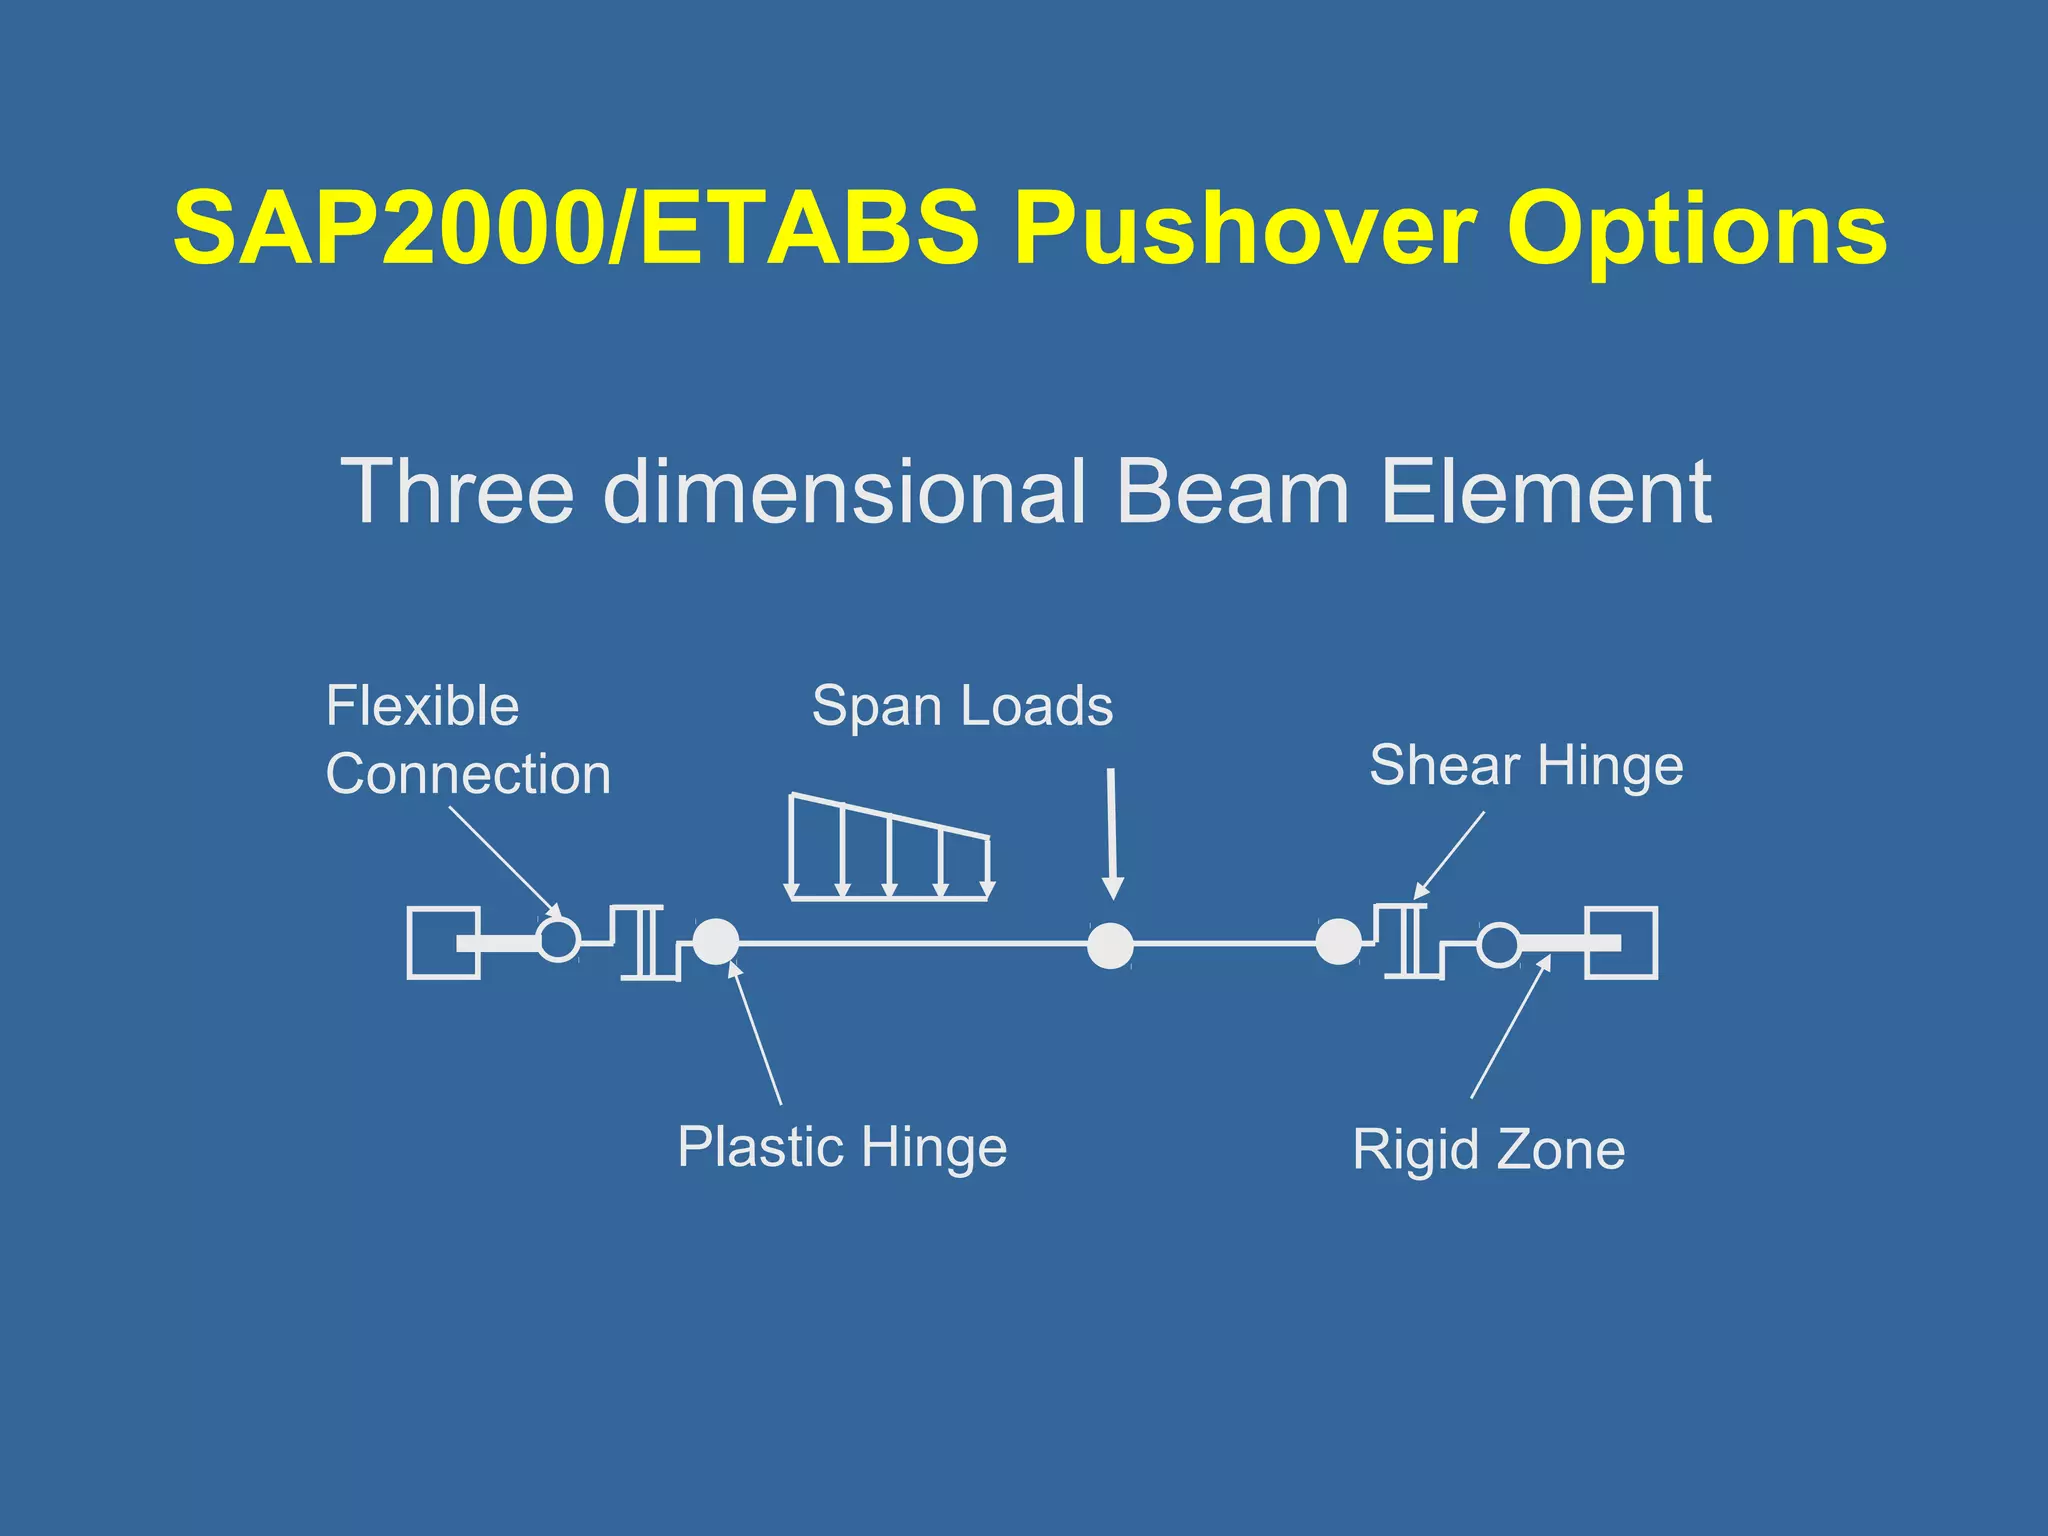
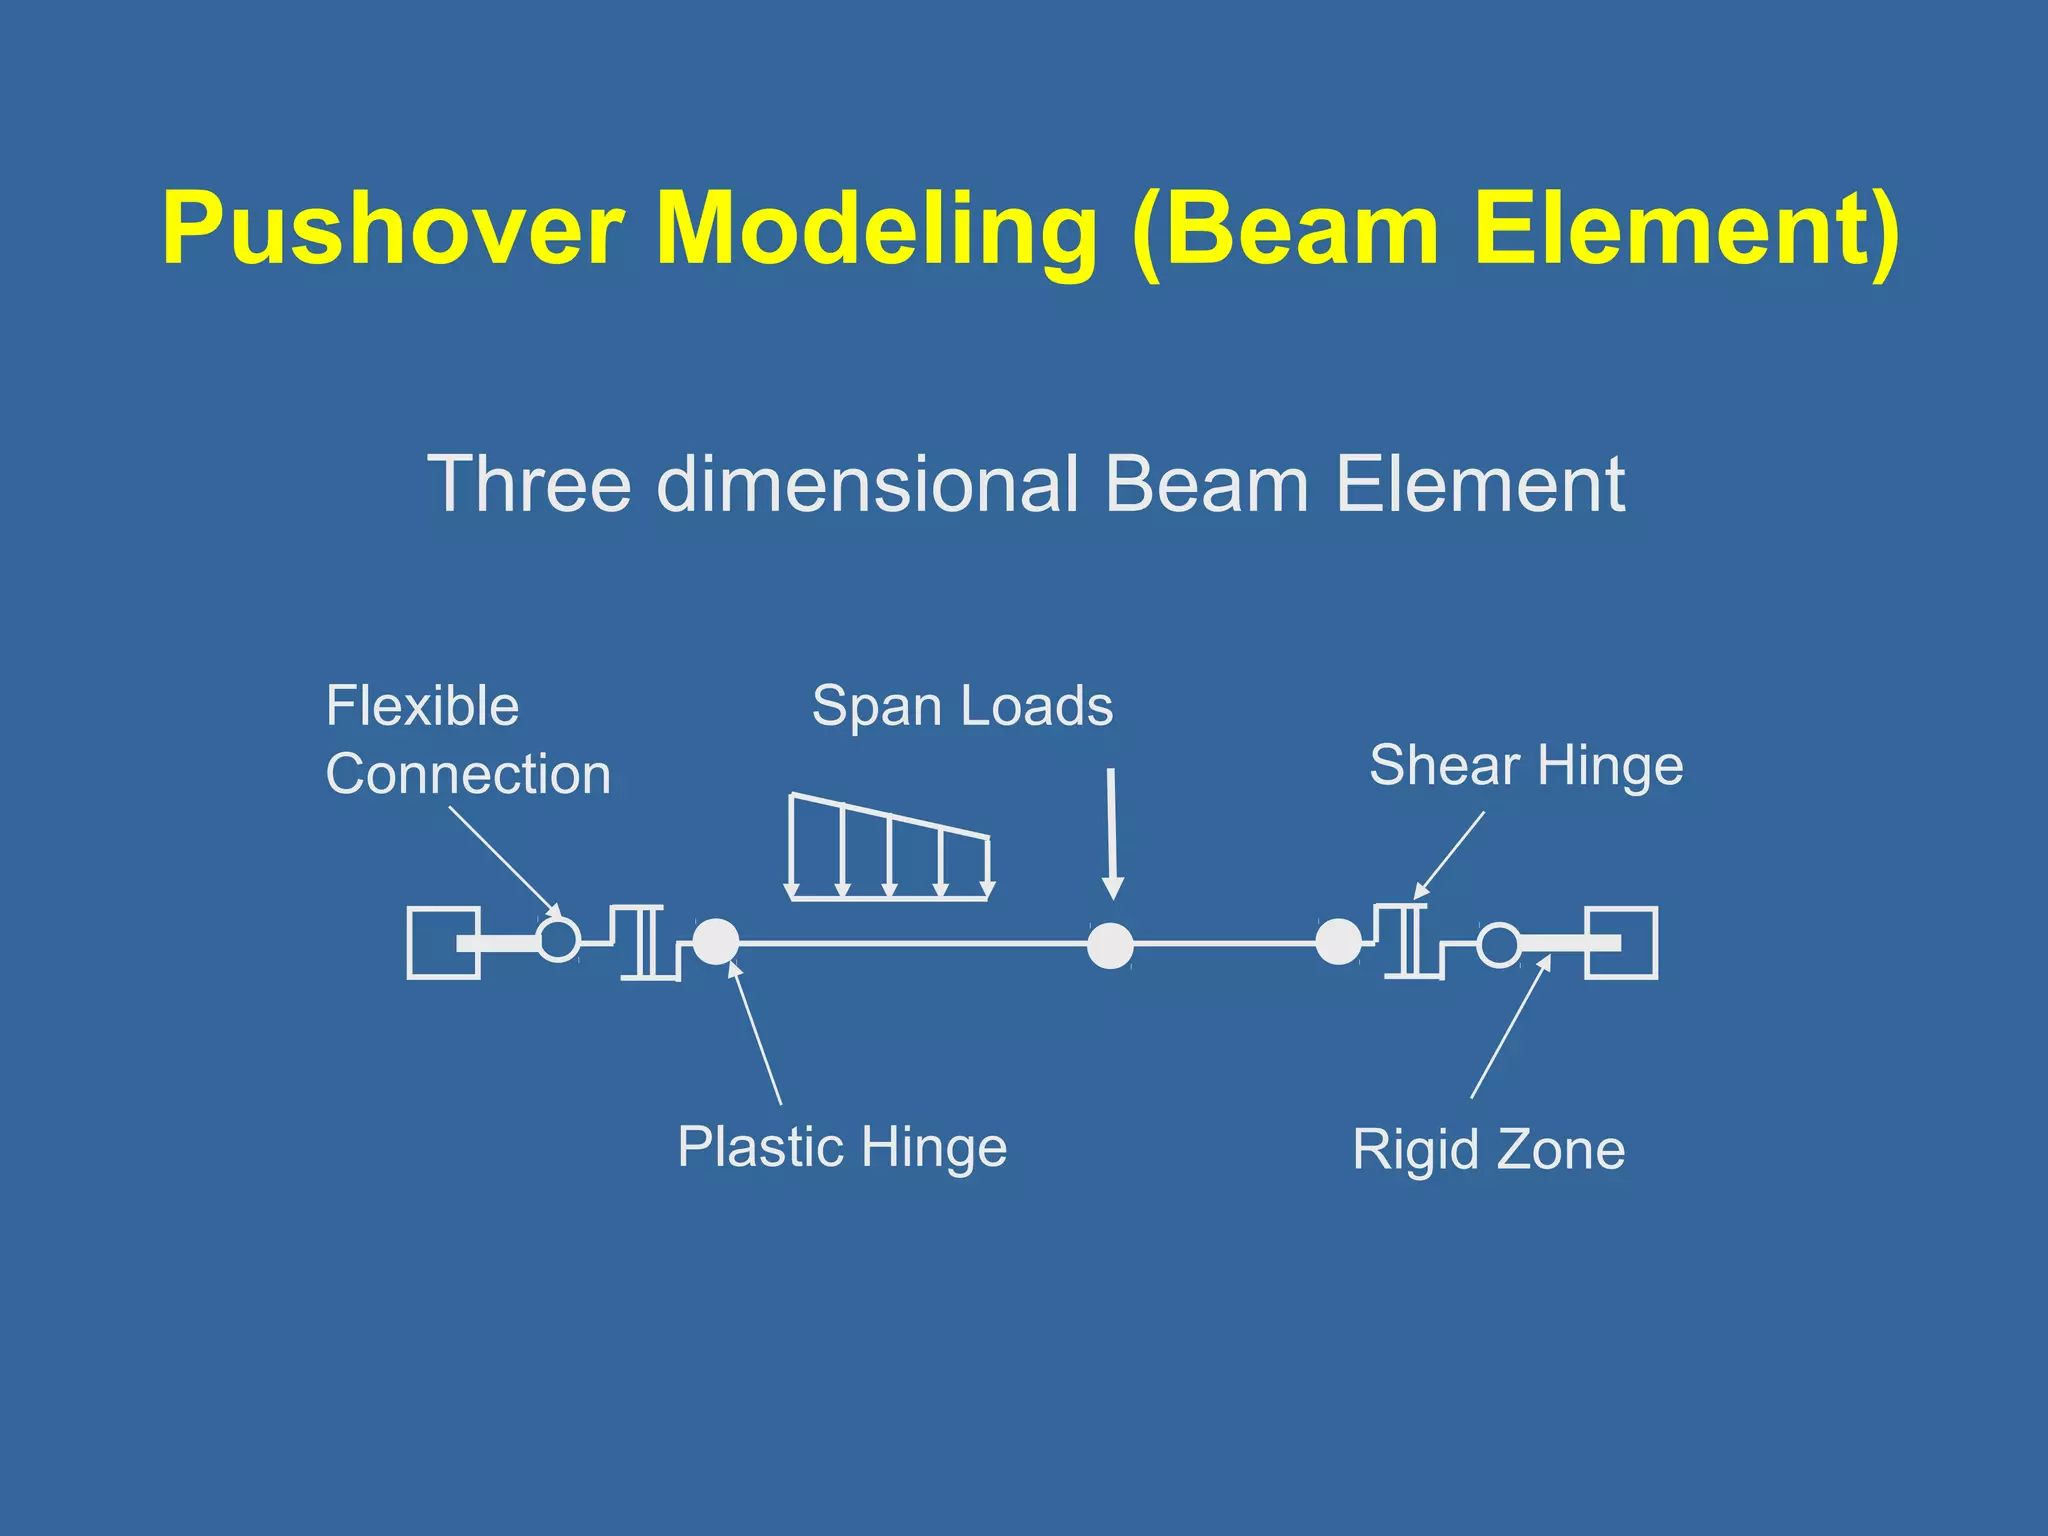
3D Beam - major direction flexural and shear hinging
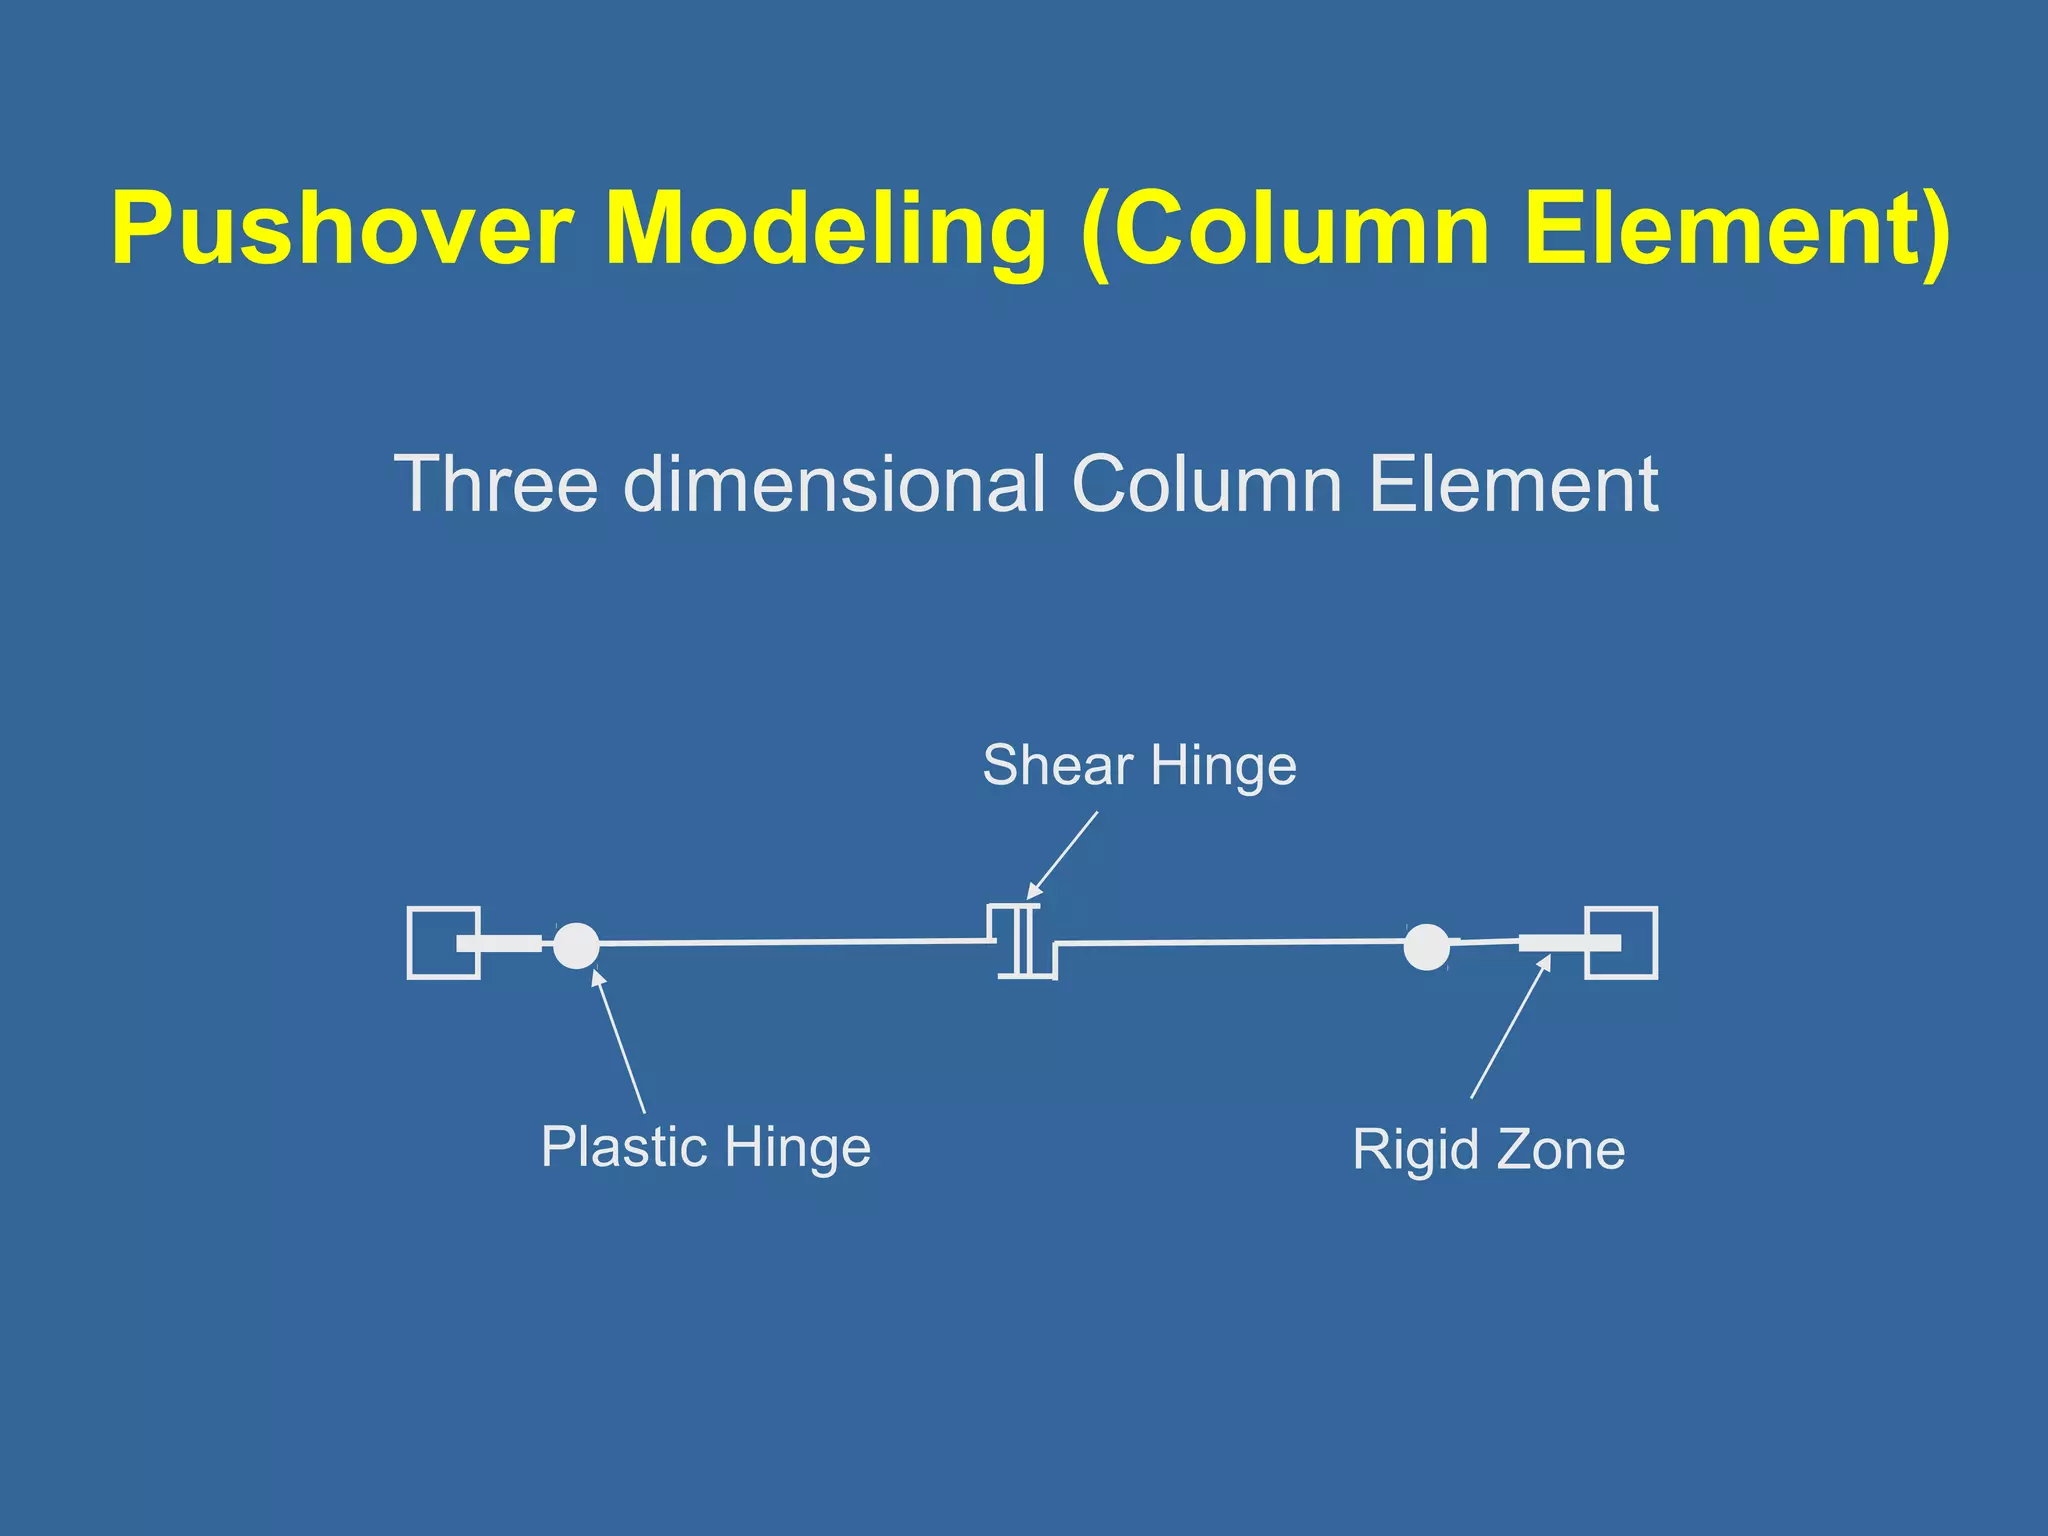
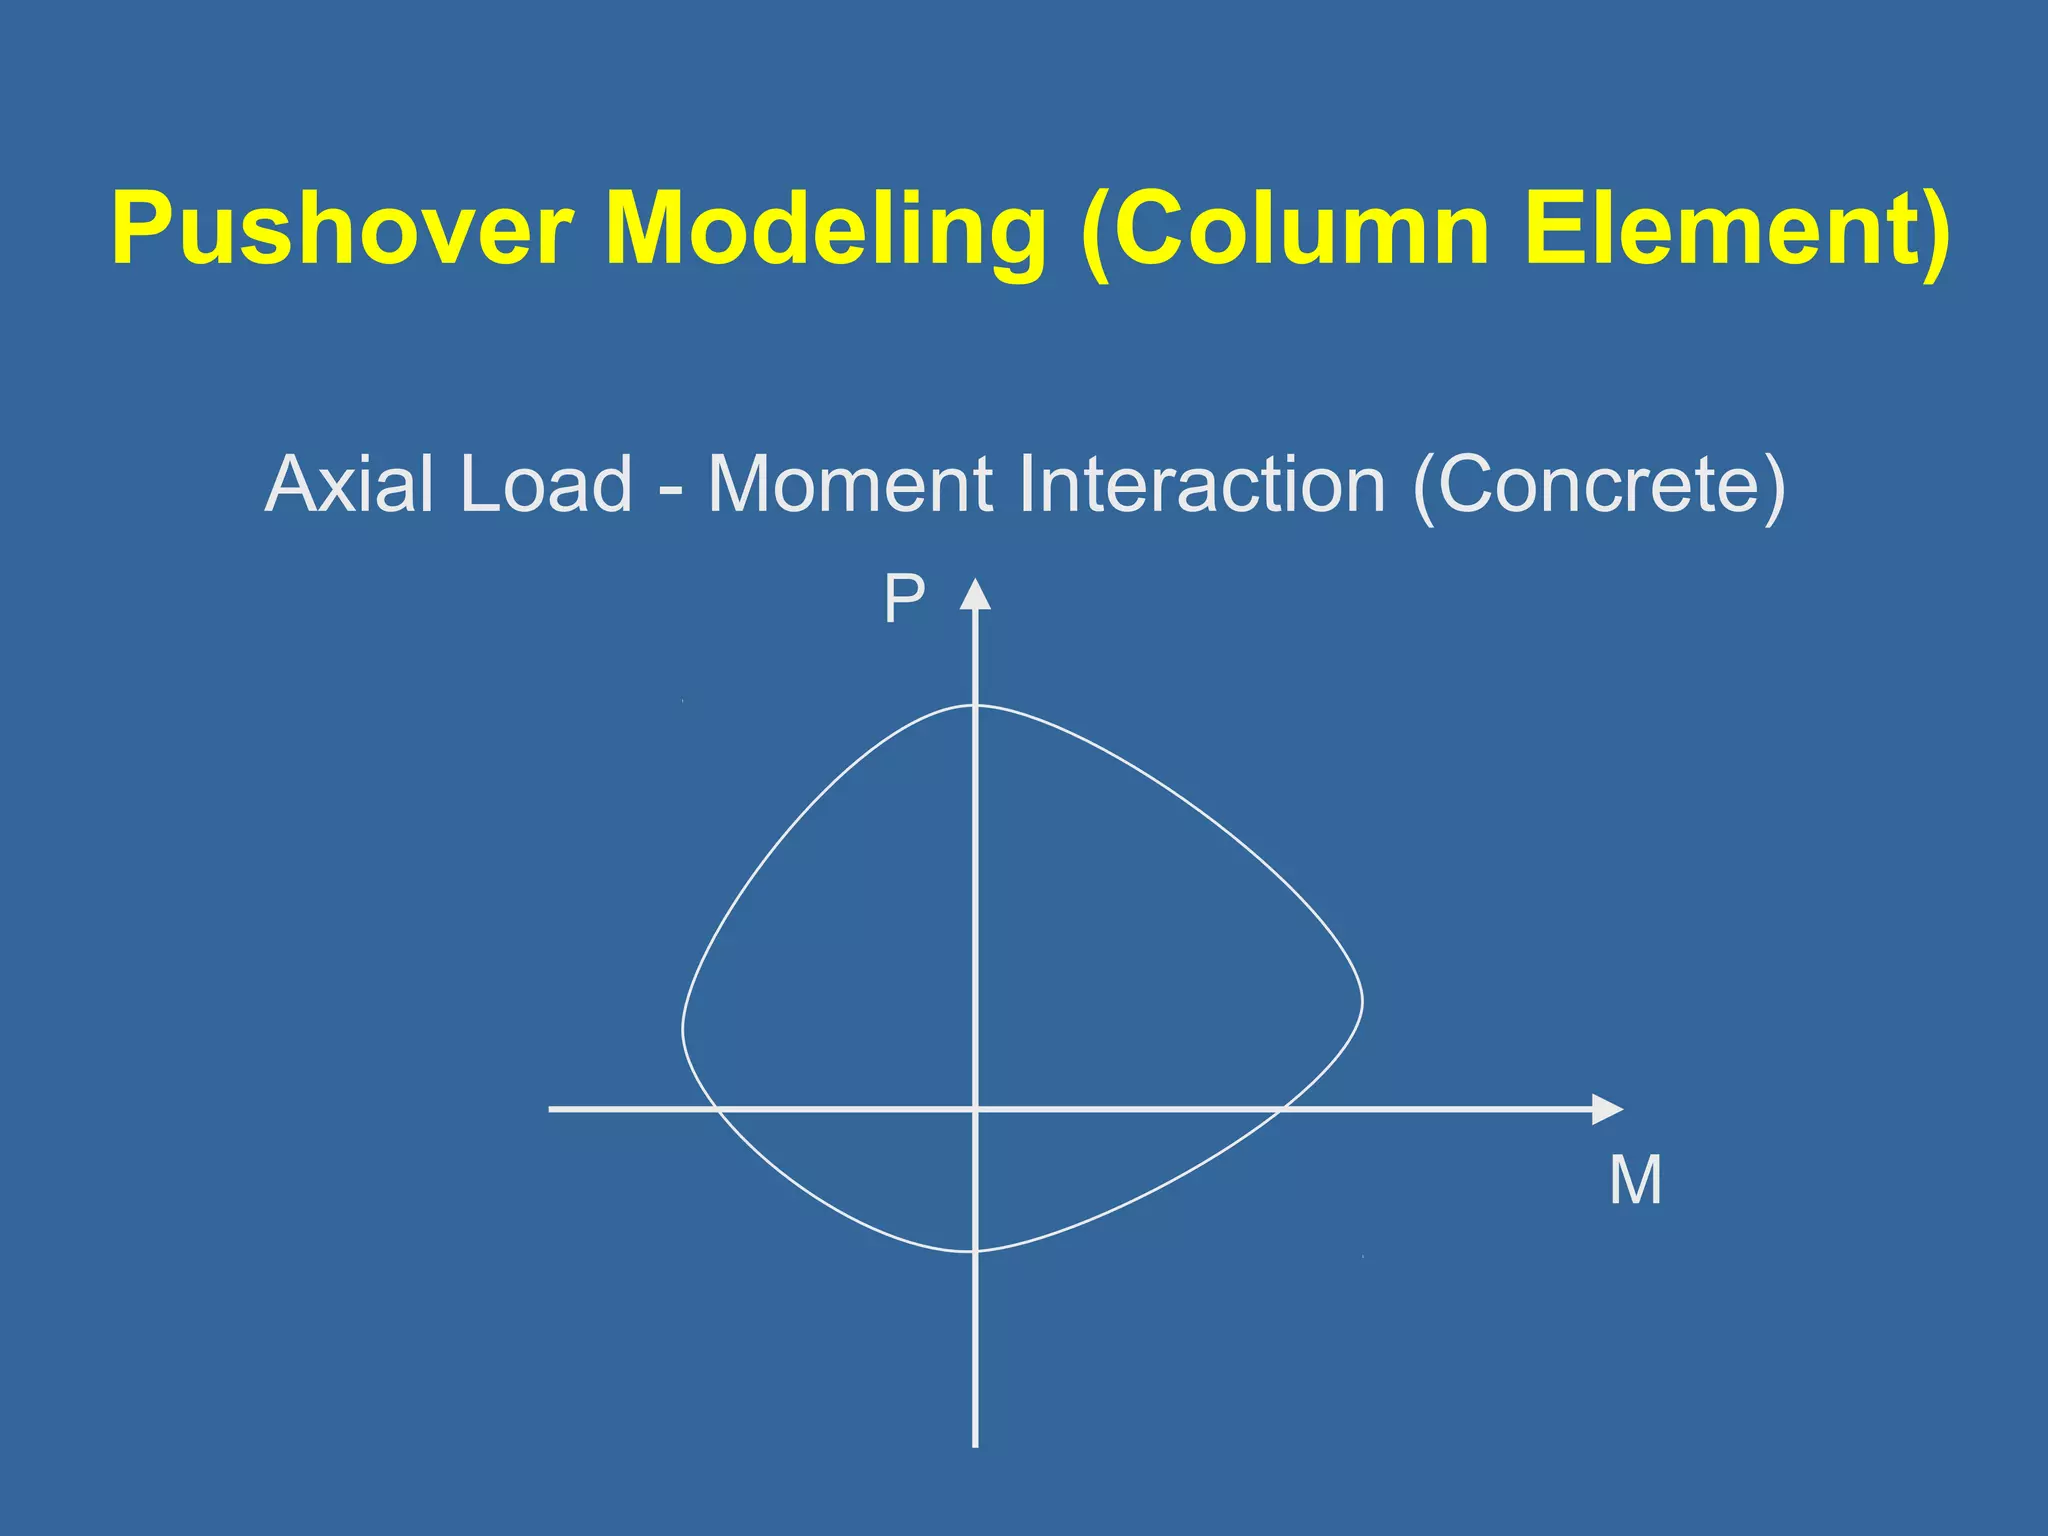
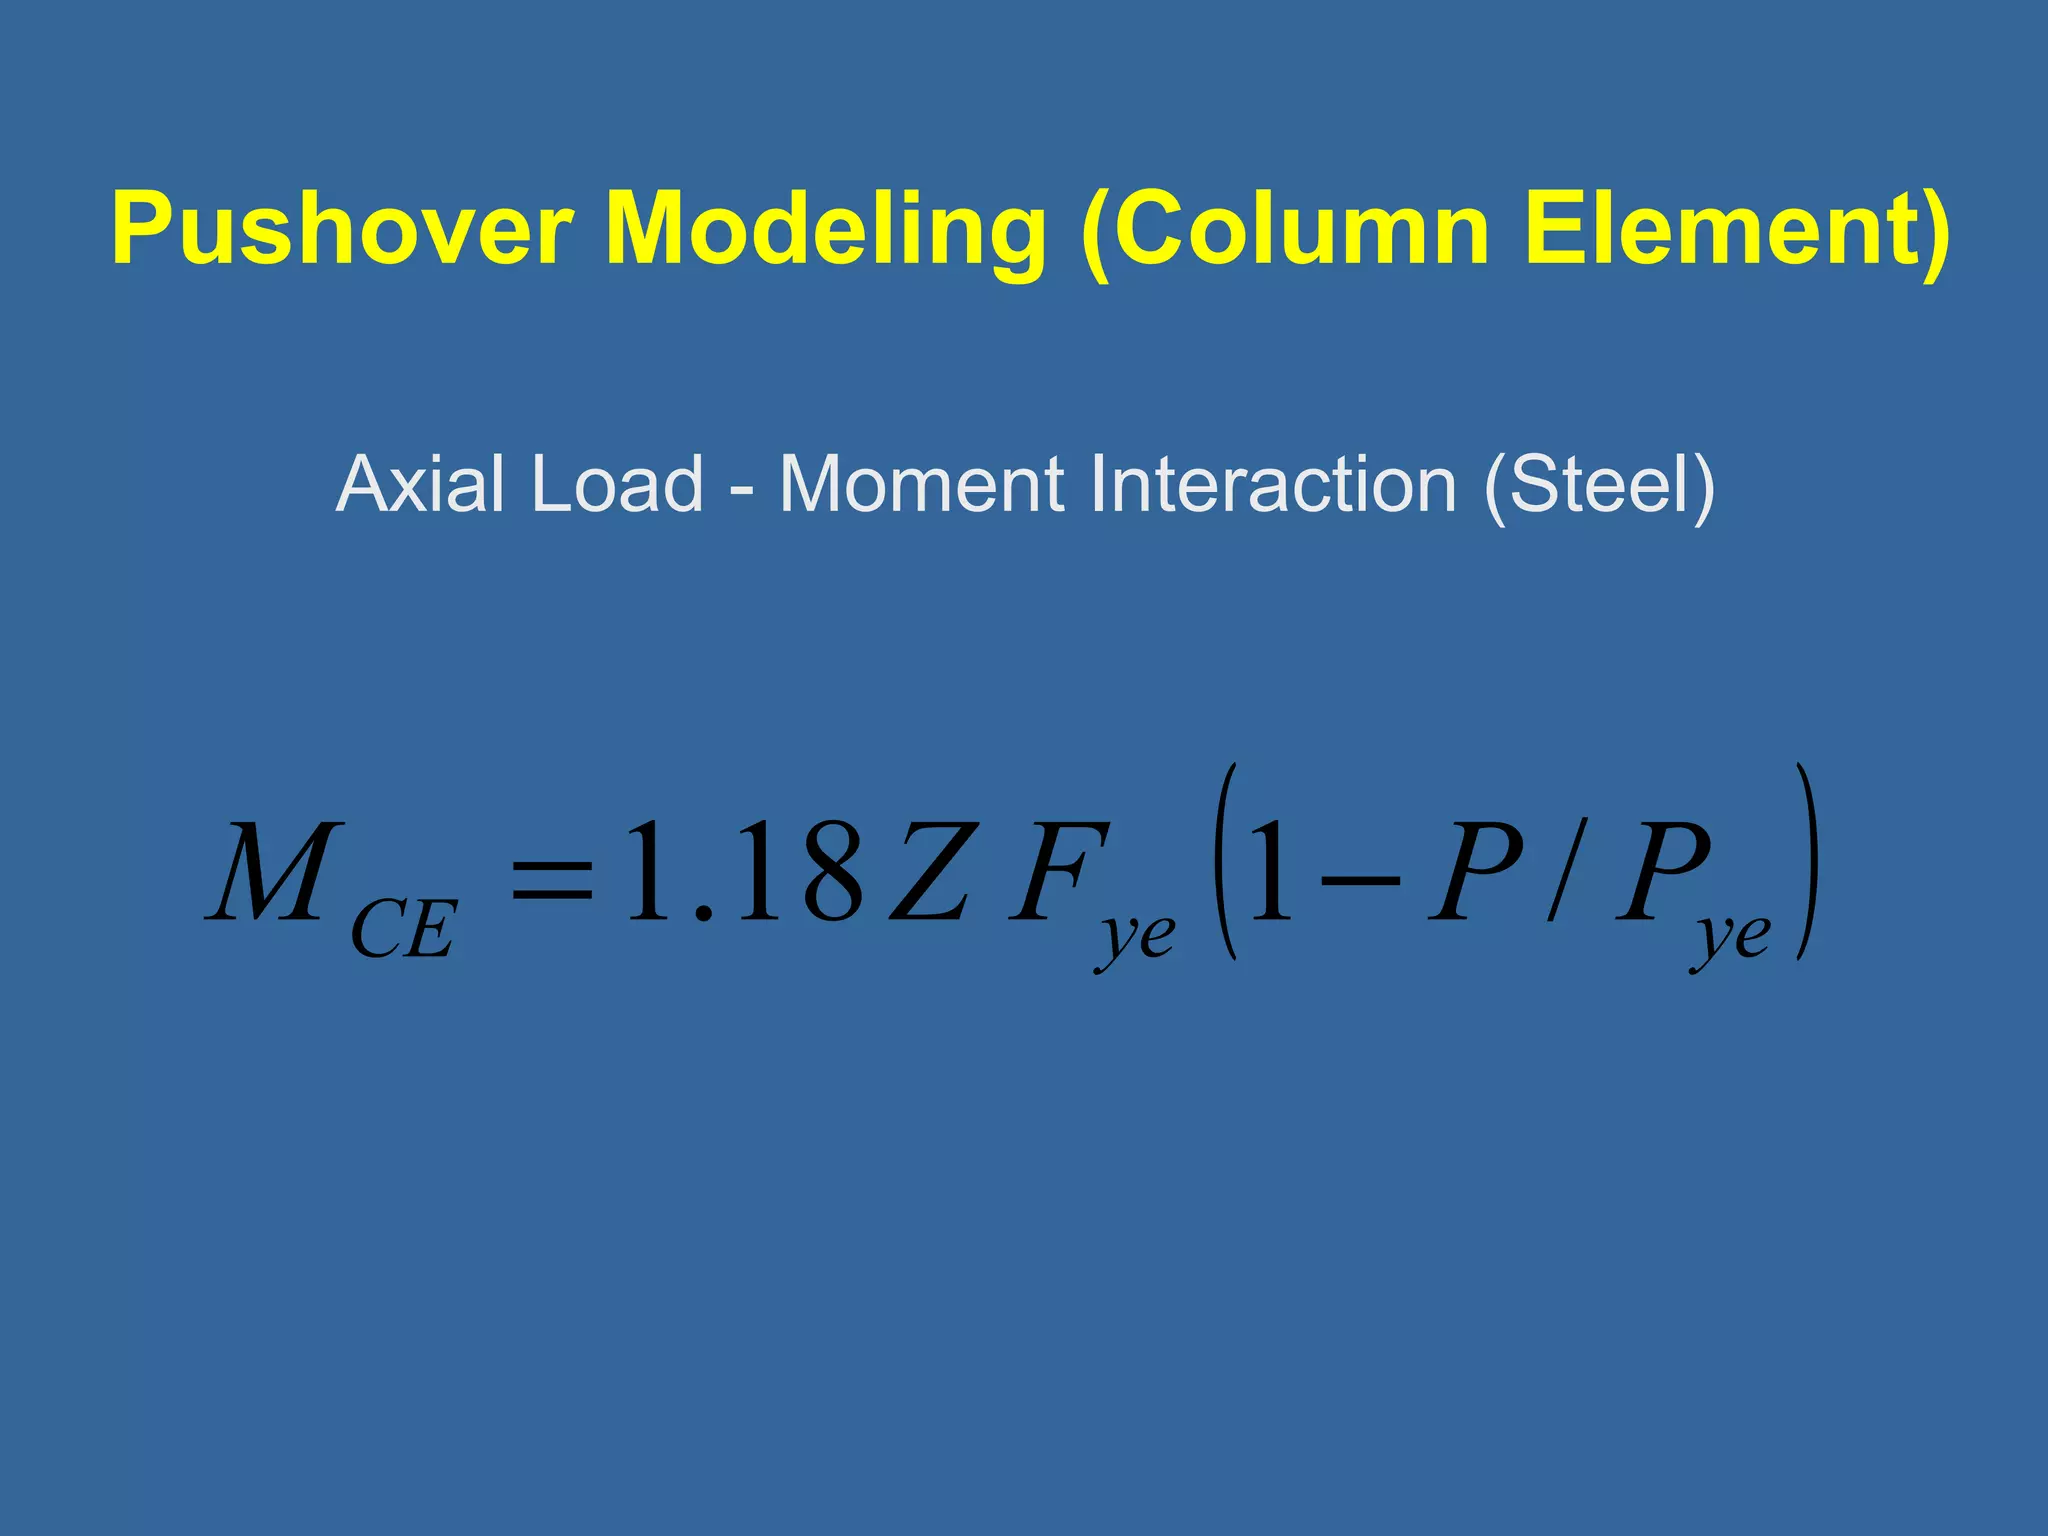
3D Column - P-M-M interaction and shear hinging
Panel zone - Shear yielding
In-fill panel - Shear failure
Shear wall - P-M-Shear interaction!
Spring - for foundation modeling
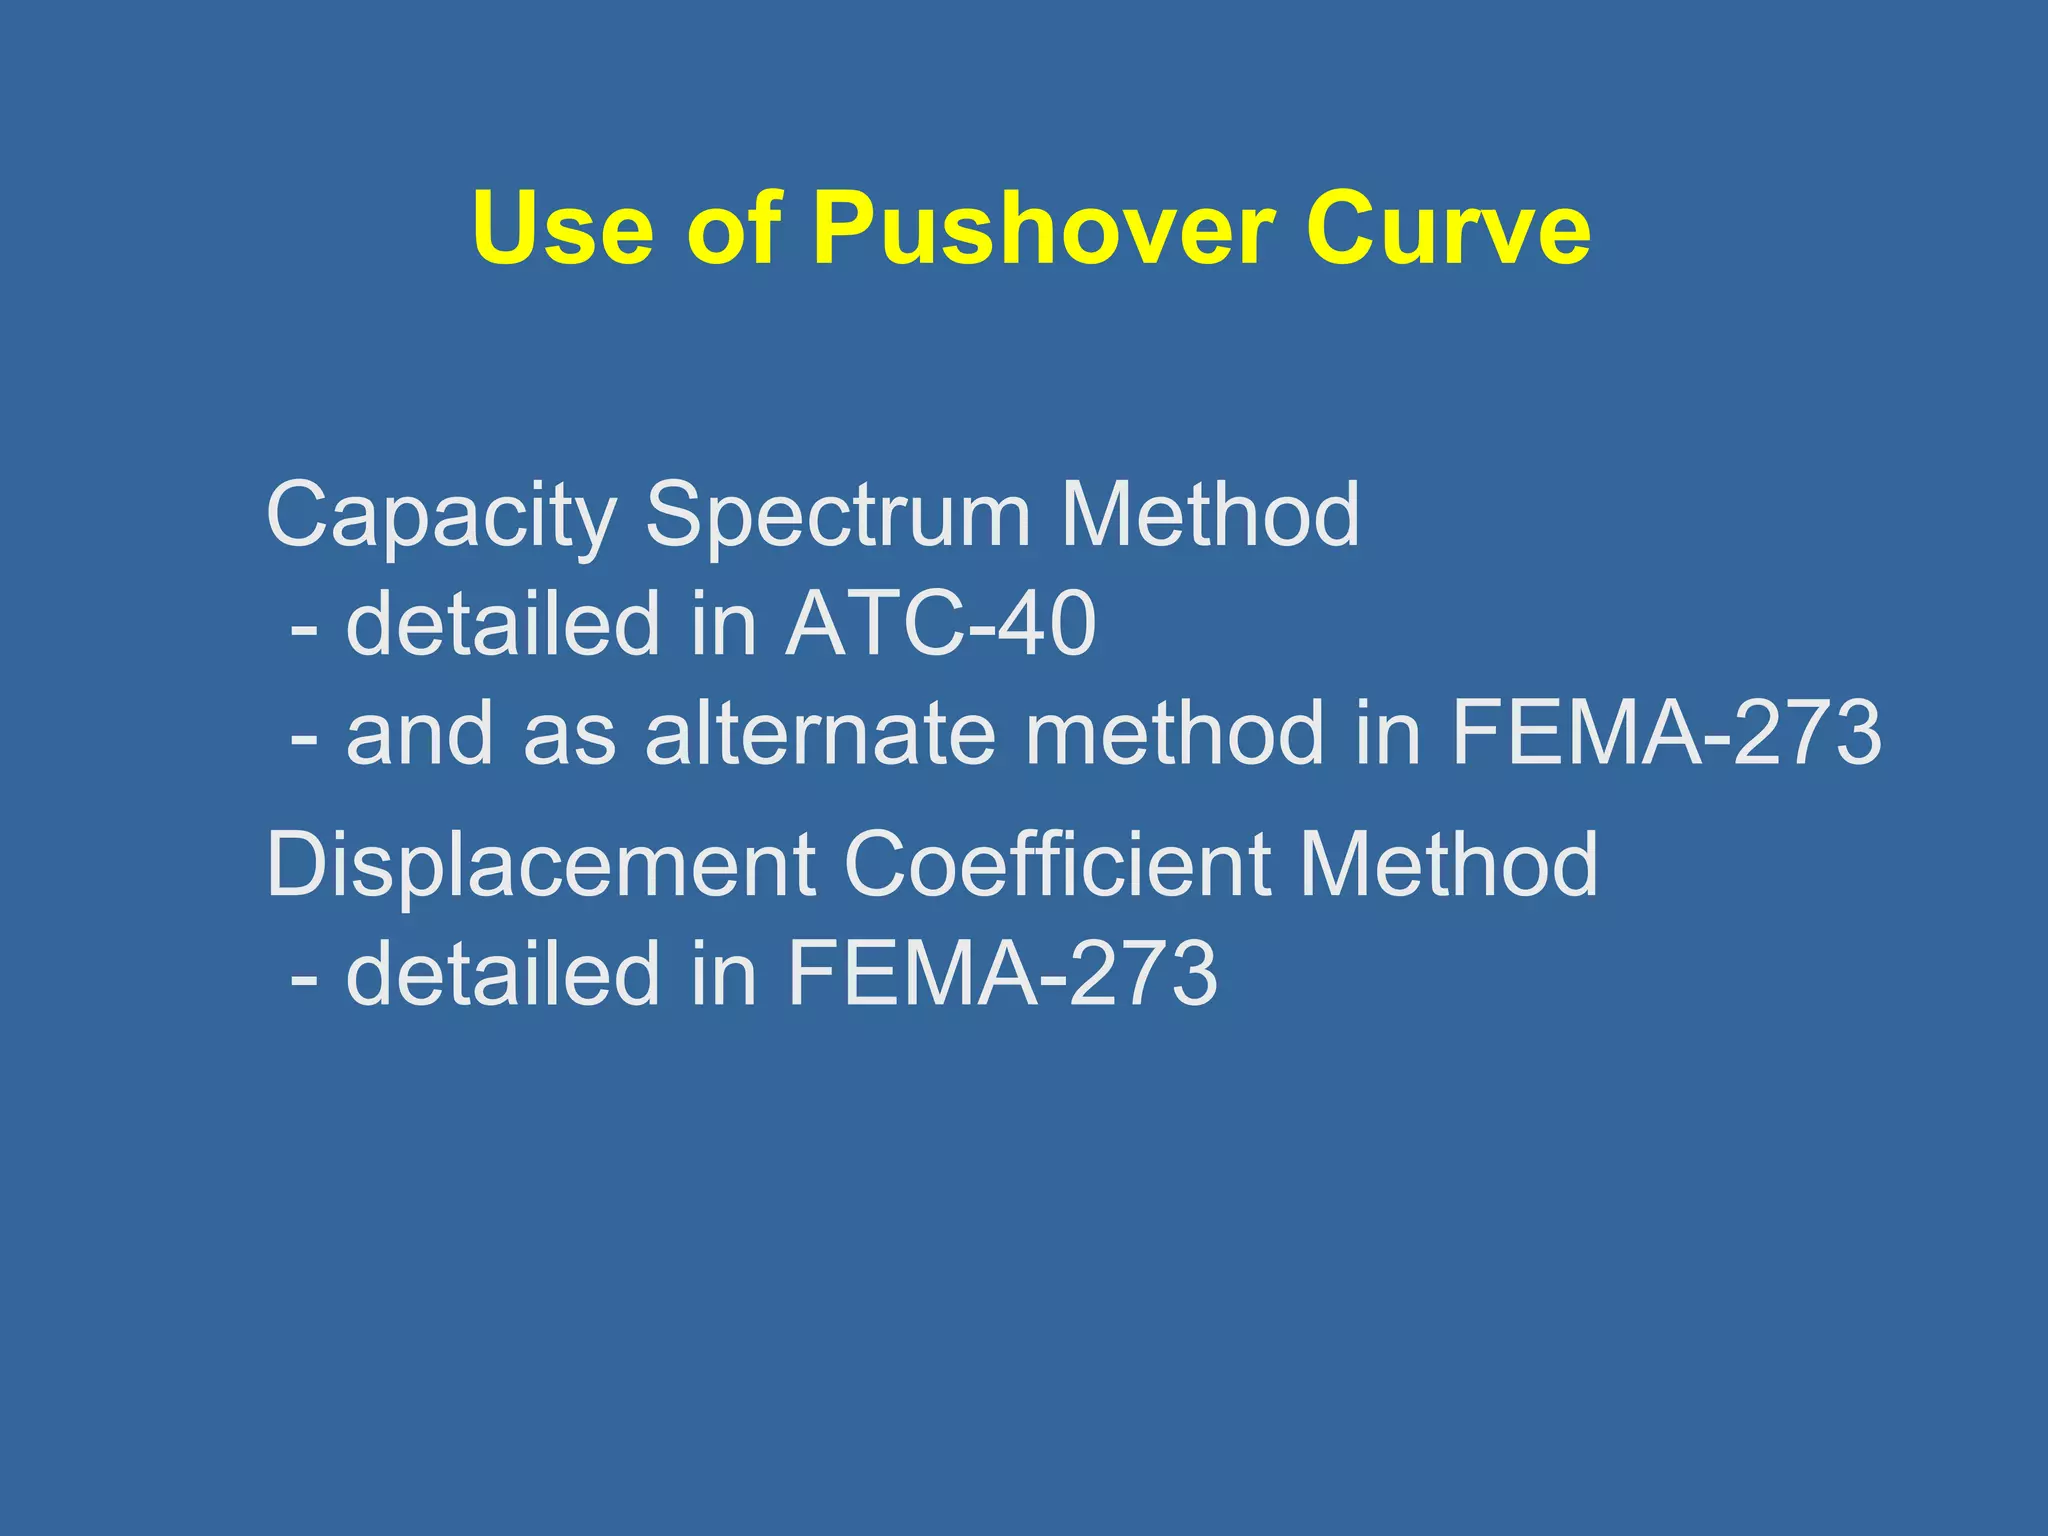
Use of PushoverCurve
Capacity Spectrum Method
- detailed in ATC-40
- and as alternate method in FEMA-273
Displacement Coefficient Method
- detailed in FEMA-273
26.
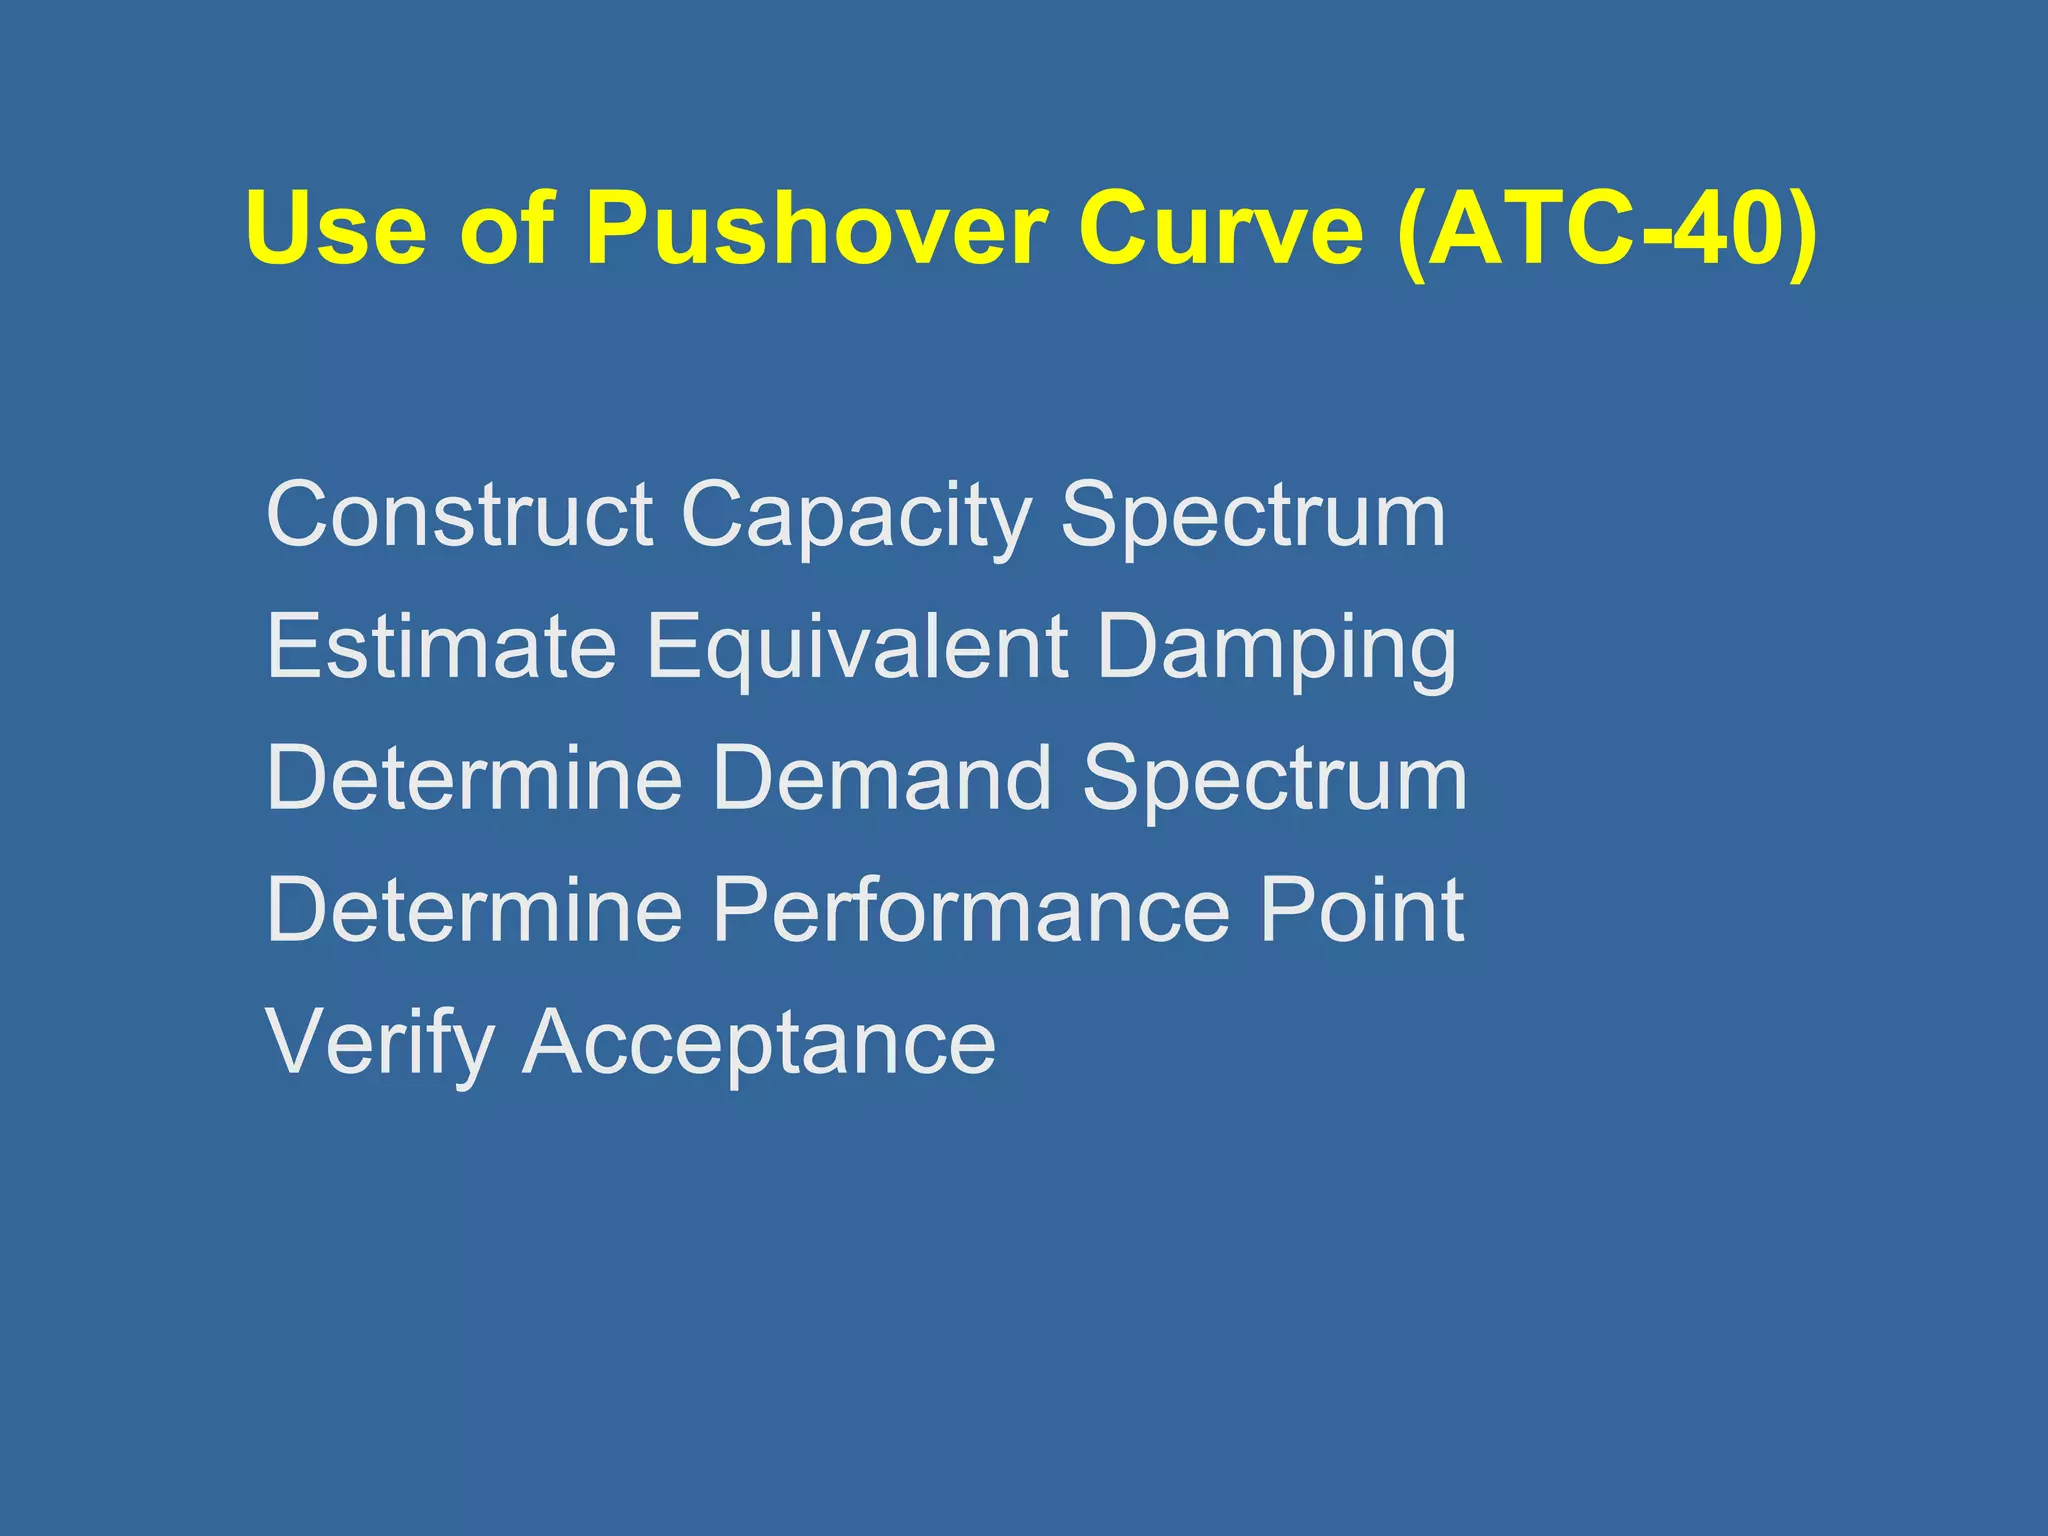
Use of PushoverCurve (ATC-40)
Construct Capacity Spectrum
Estimate Equivalent Damping
Determine Demand Spectrum
Determine Performance Point
Verify Acceptance
27.
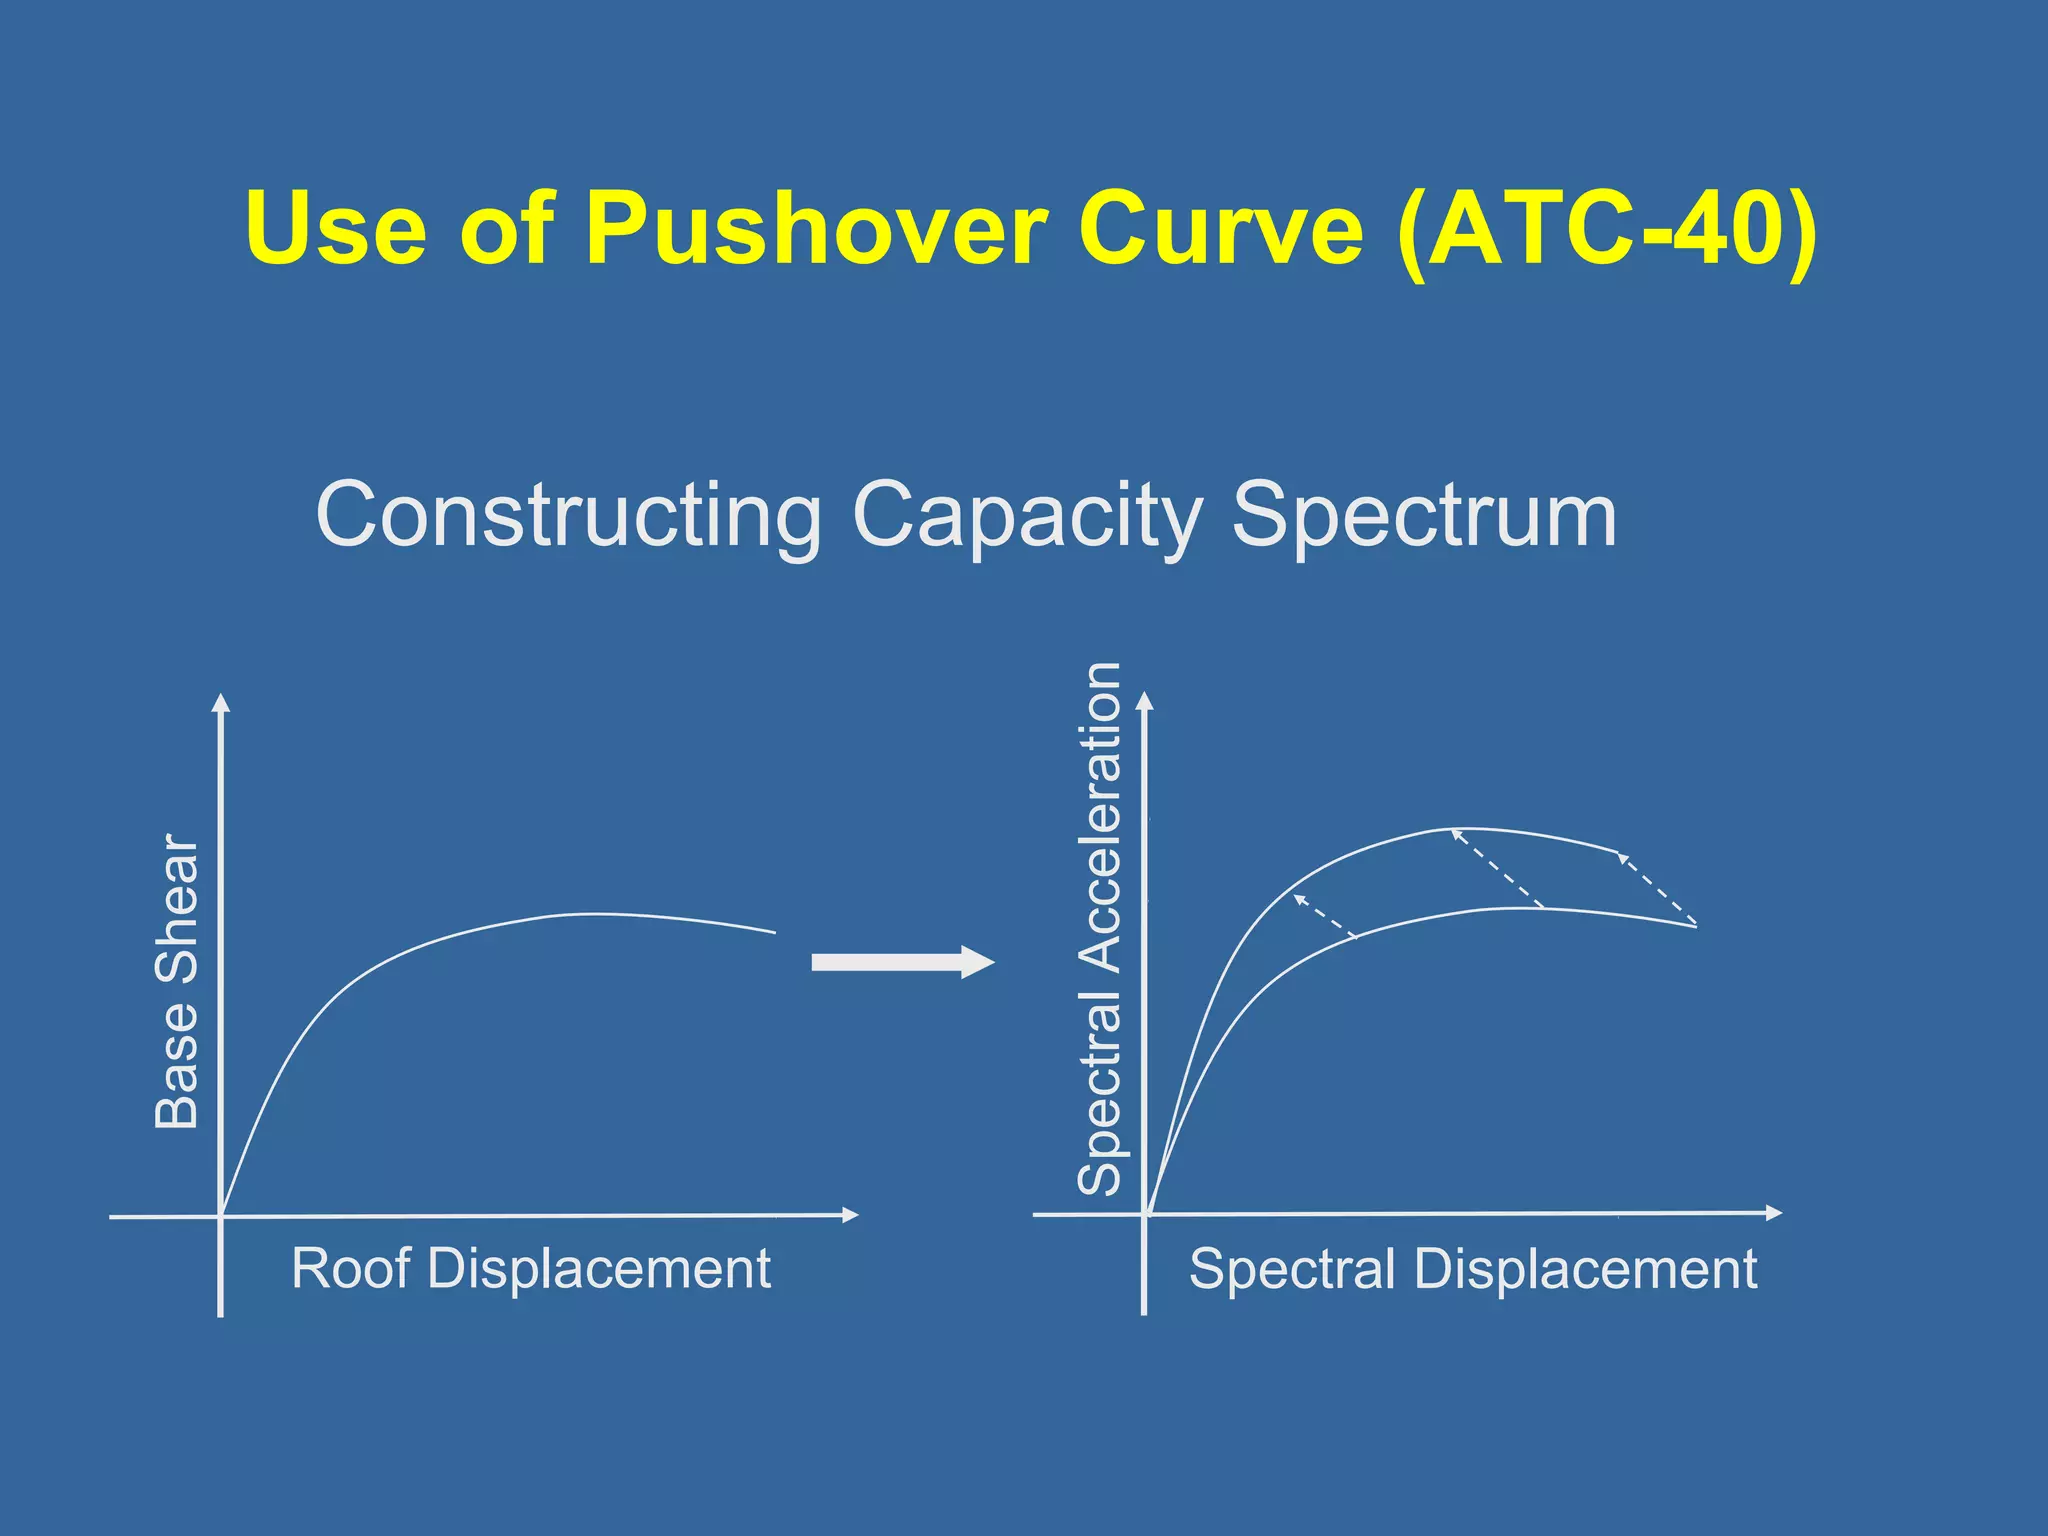
Use of PushoverCurve (ATC-40)
Constructing Capacity Spectrum
Roof Displacement
Base Shear
Spectral Displacement
Spectral Acceleration
28.
Use of PushoverCurve (ATC-40)
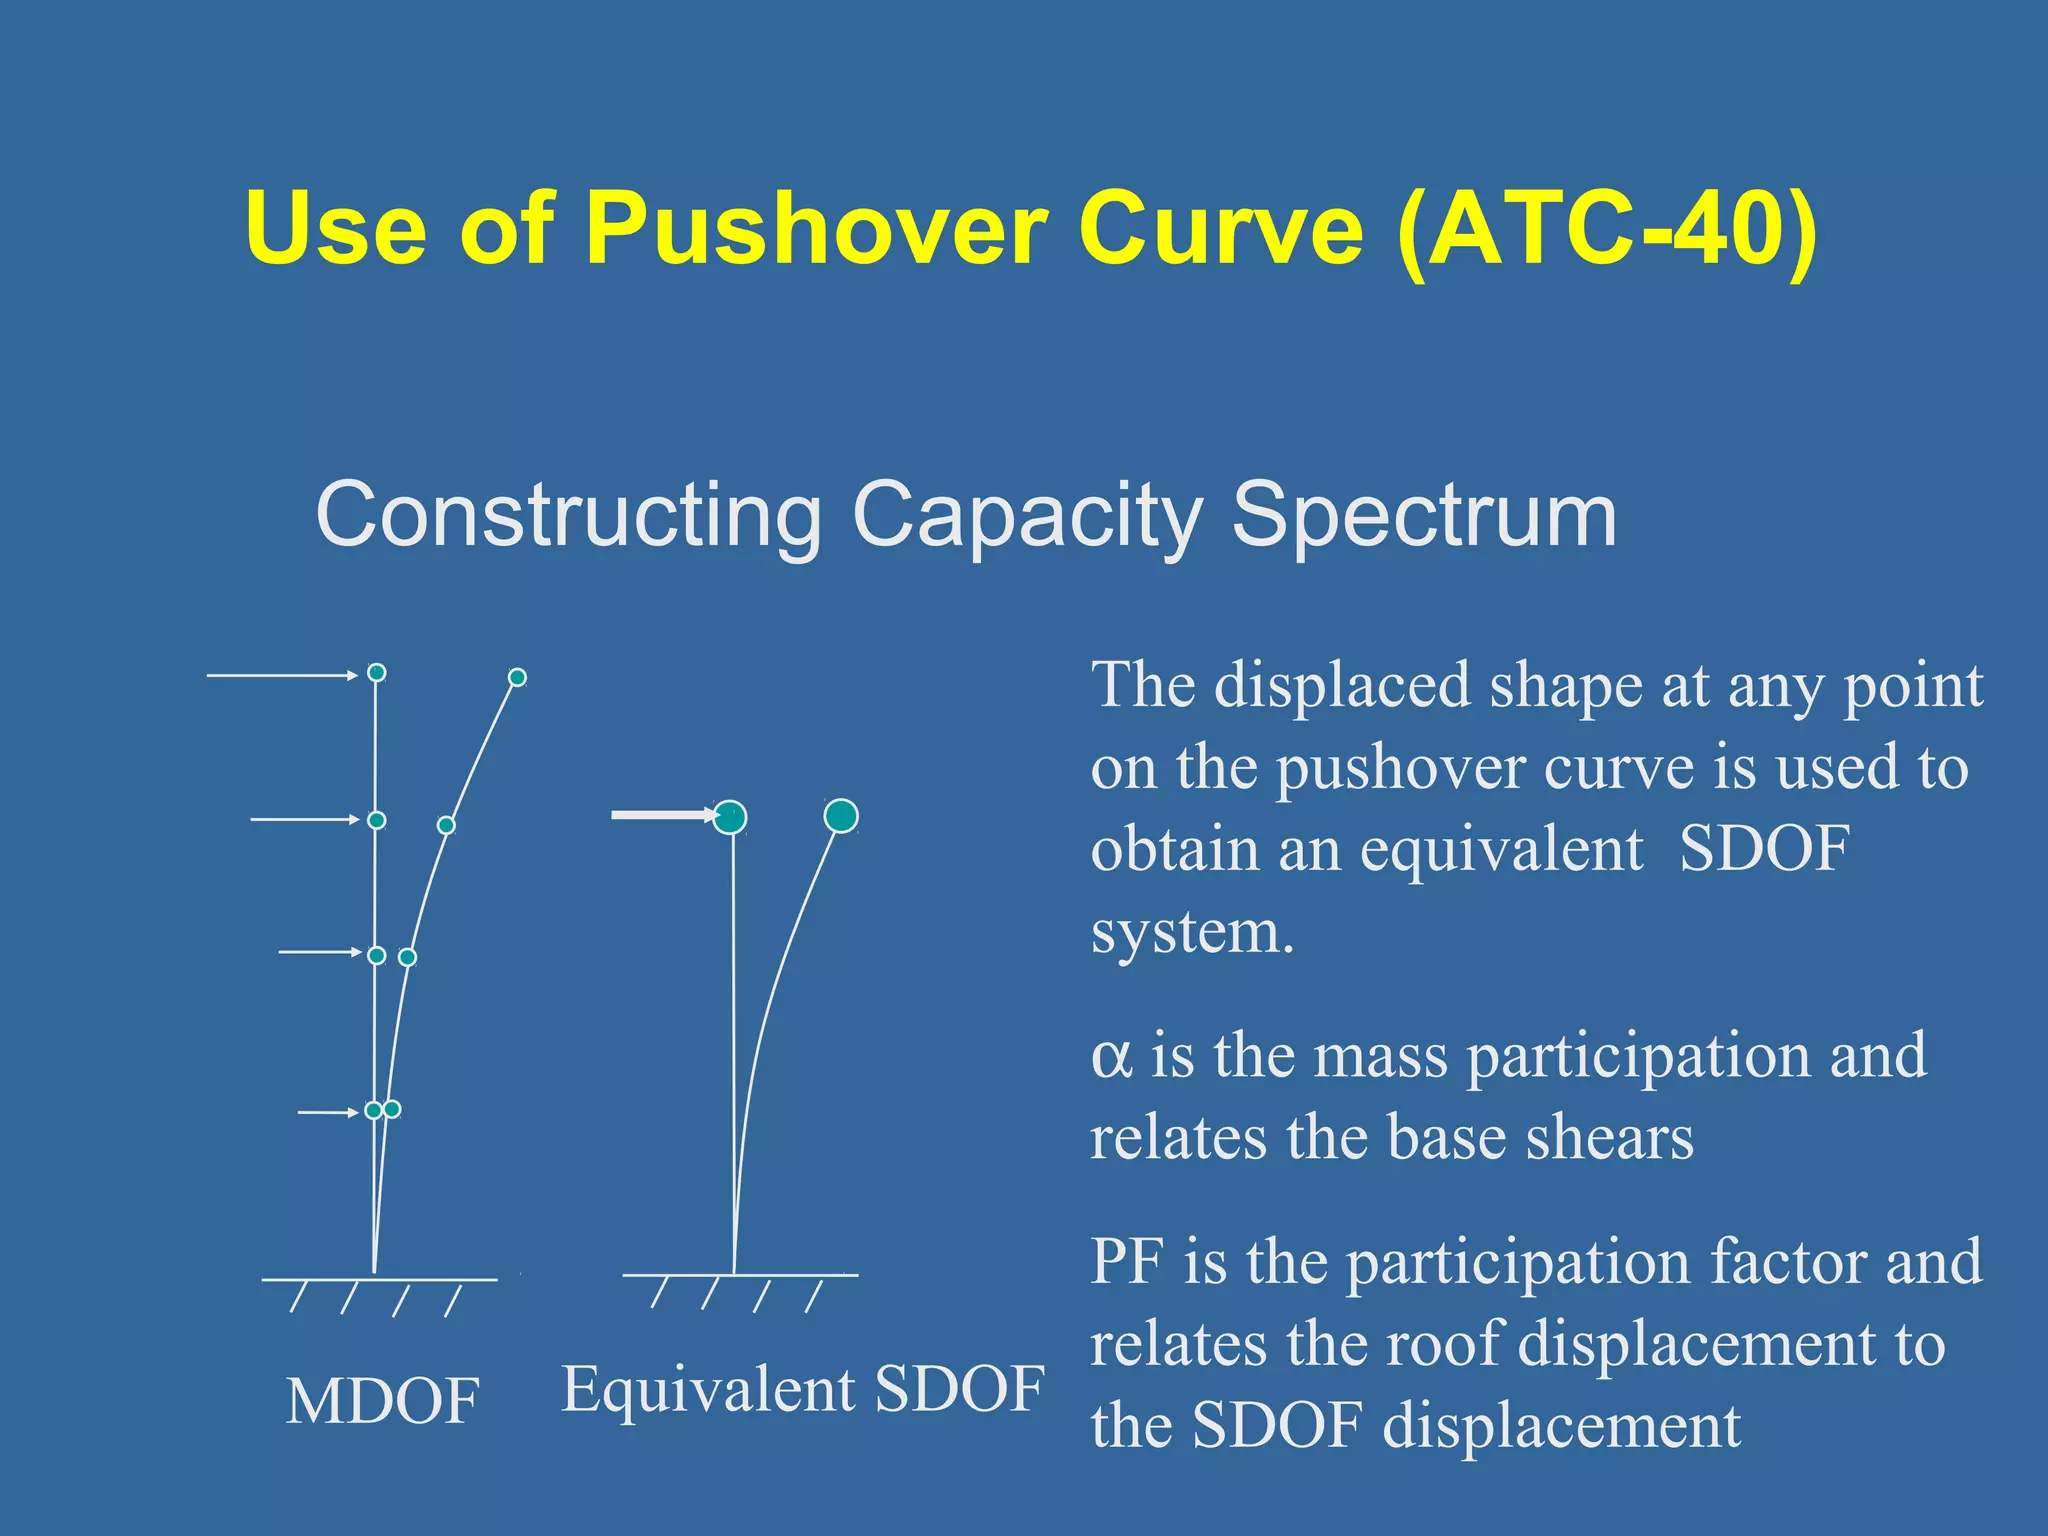
Constructing Capacity Spectrum
MDOF Equivalent SDOF
The displaced shape at any point
on the pushover curve is used to
obtain an equivalent SDOF
system.
a is the mass participation and
relates the base shears
PF is the participation factor and
relates the roof displacement to
the SDOF displacement
29.
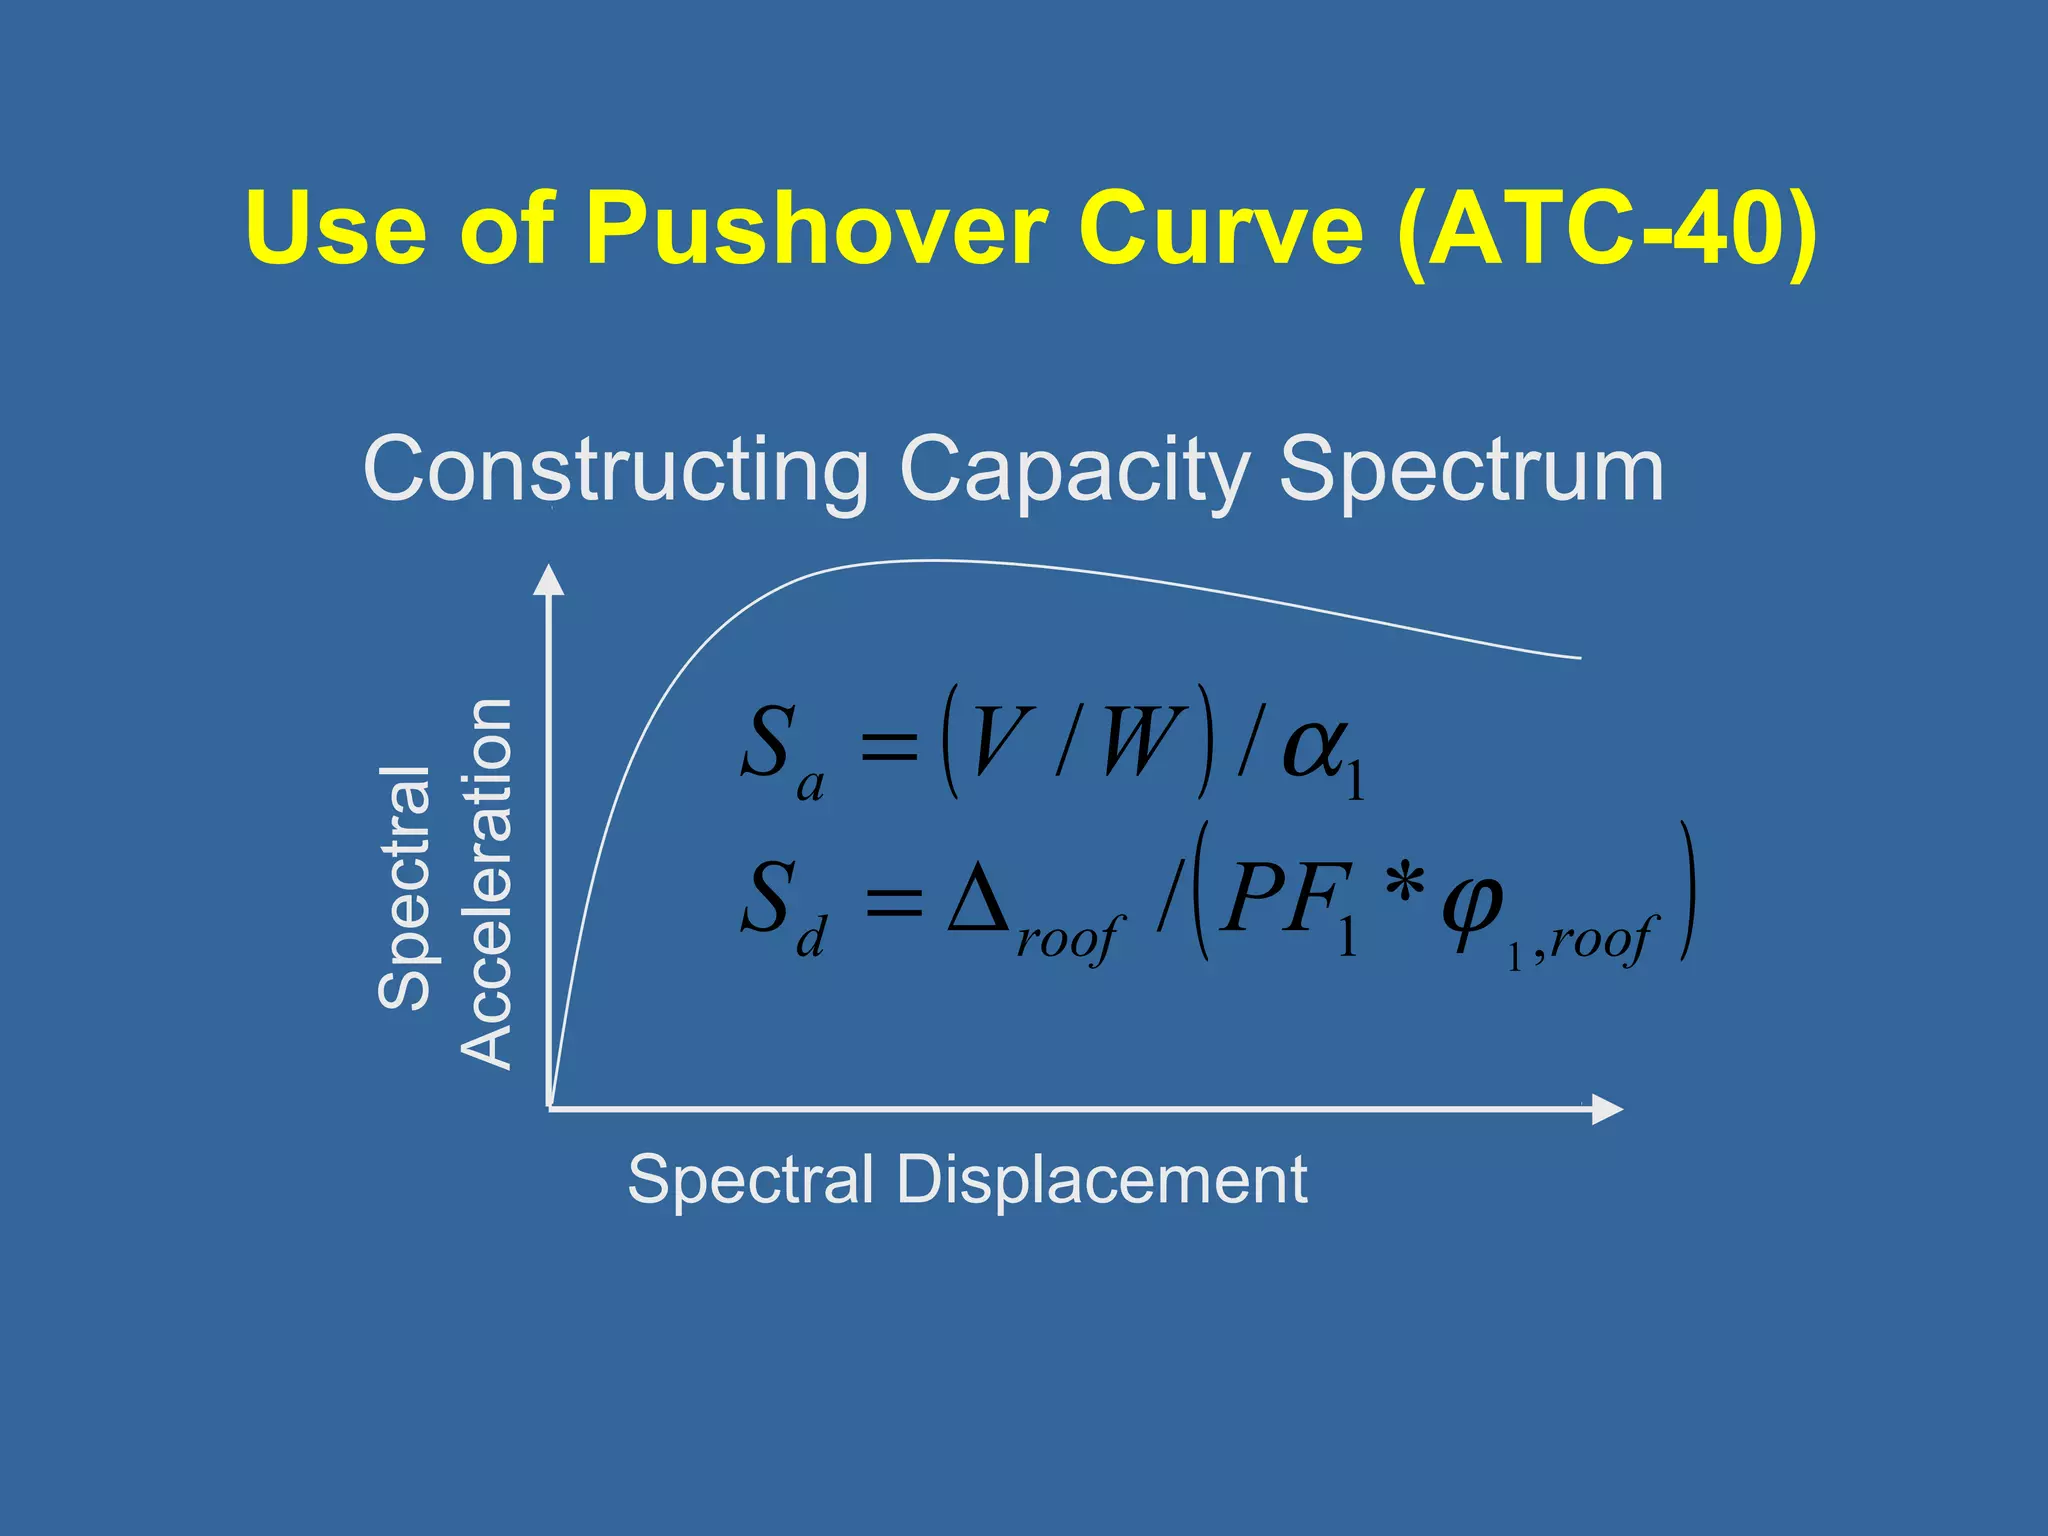
Use of PushoverCurve (ATC-40)
Constructing Capacity Spectrum
Spectral
Acceleration
( )
S =
V W
a
S PF
1
d roof ( roof )
1 / *
Spectral Displacement
1 ,
/ /
j
a
= D
30.
Use of PushoverCurve (ATC-40)
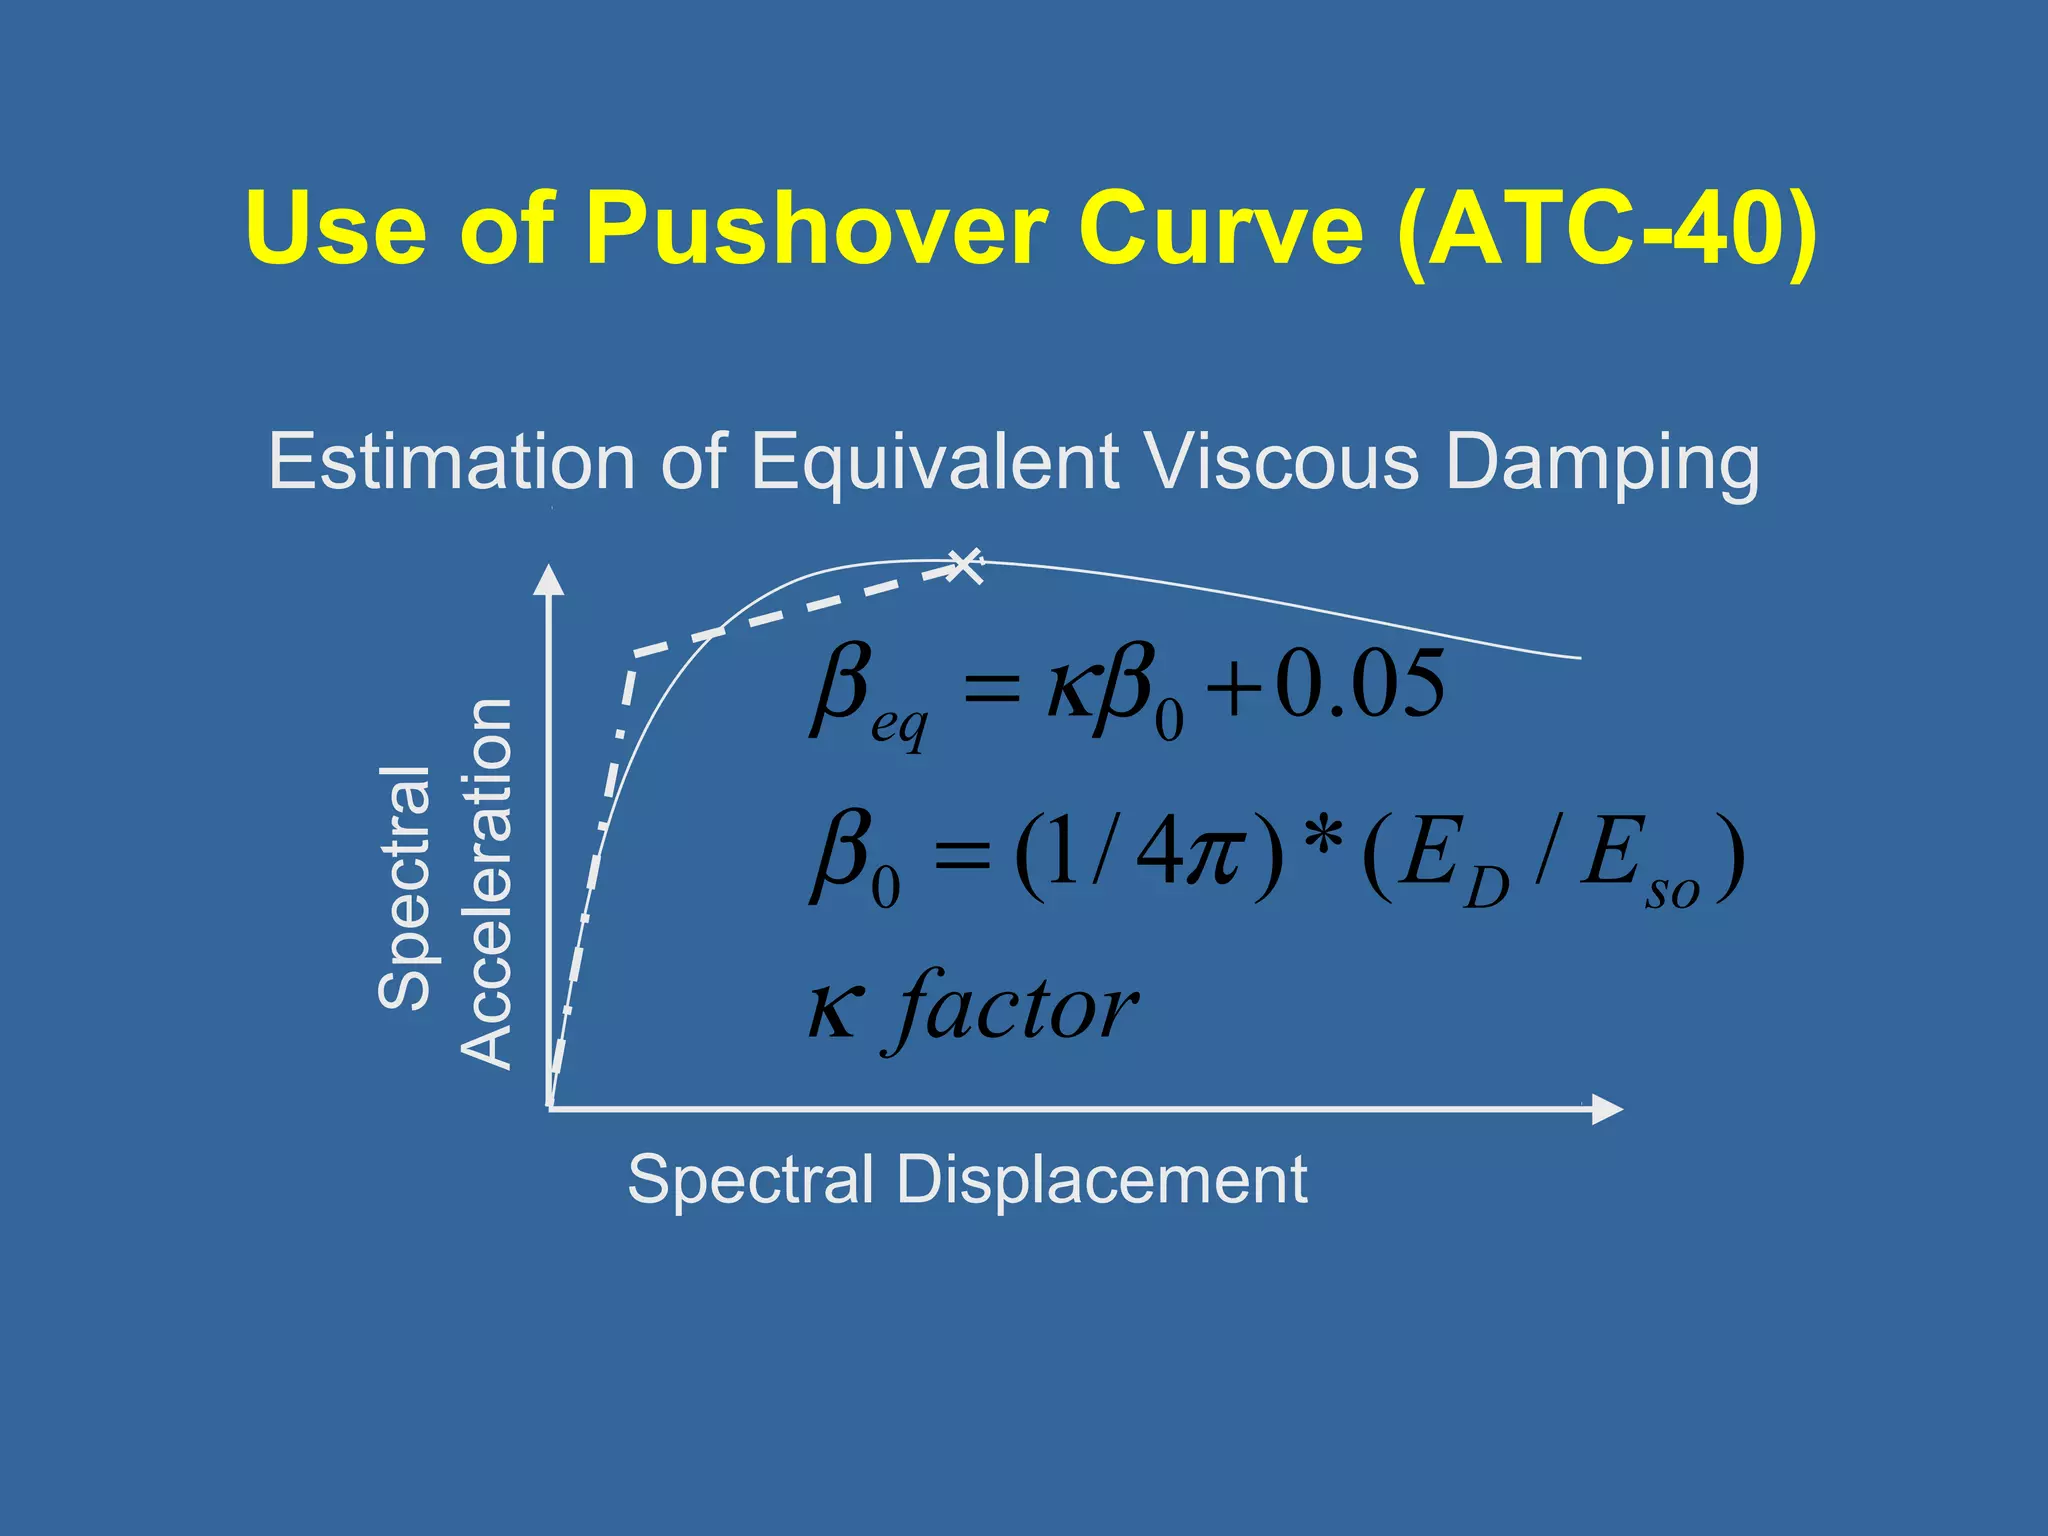
Estimation of Equivalent Viscous Damping
Spectral
Acceleration
b kb
= +
b p
factor
0.05
Spectral Displacement
ED Eso
eq
k
(1/ 4 )*( / )
0
0
=
31.
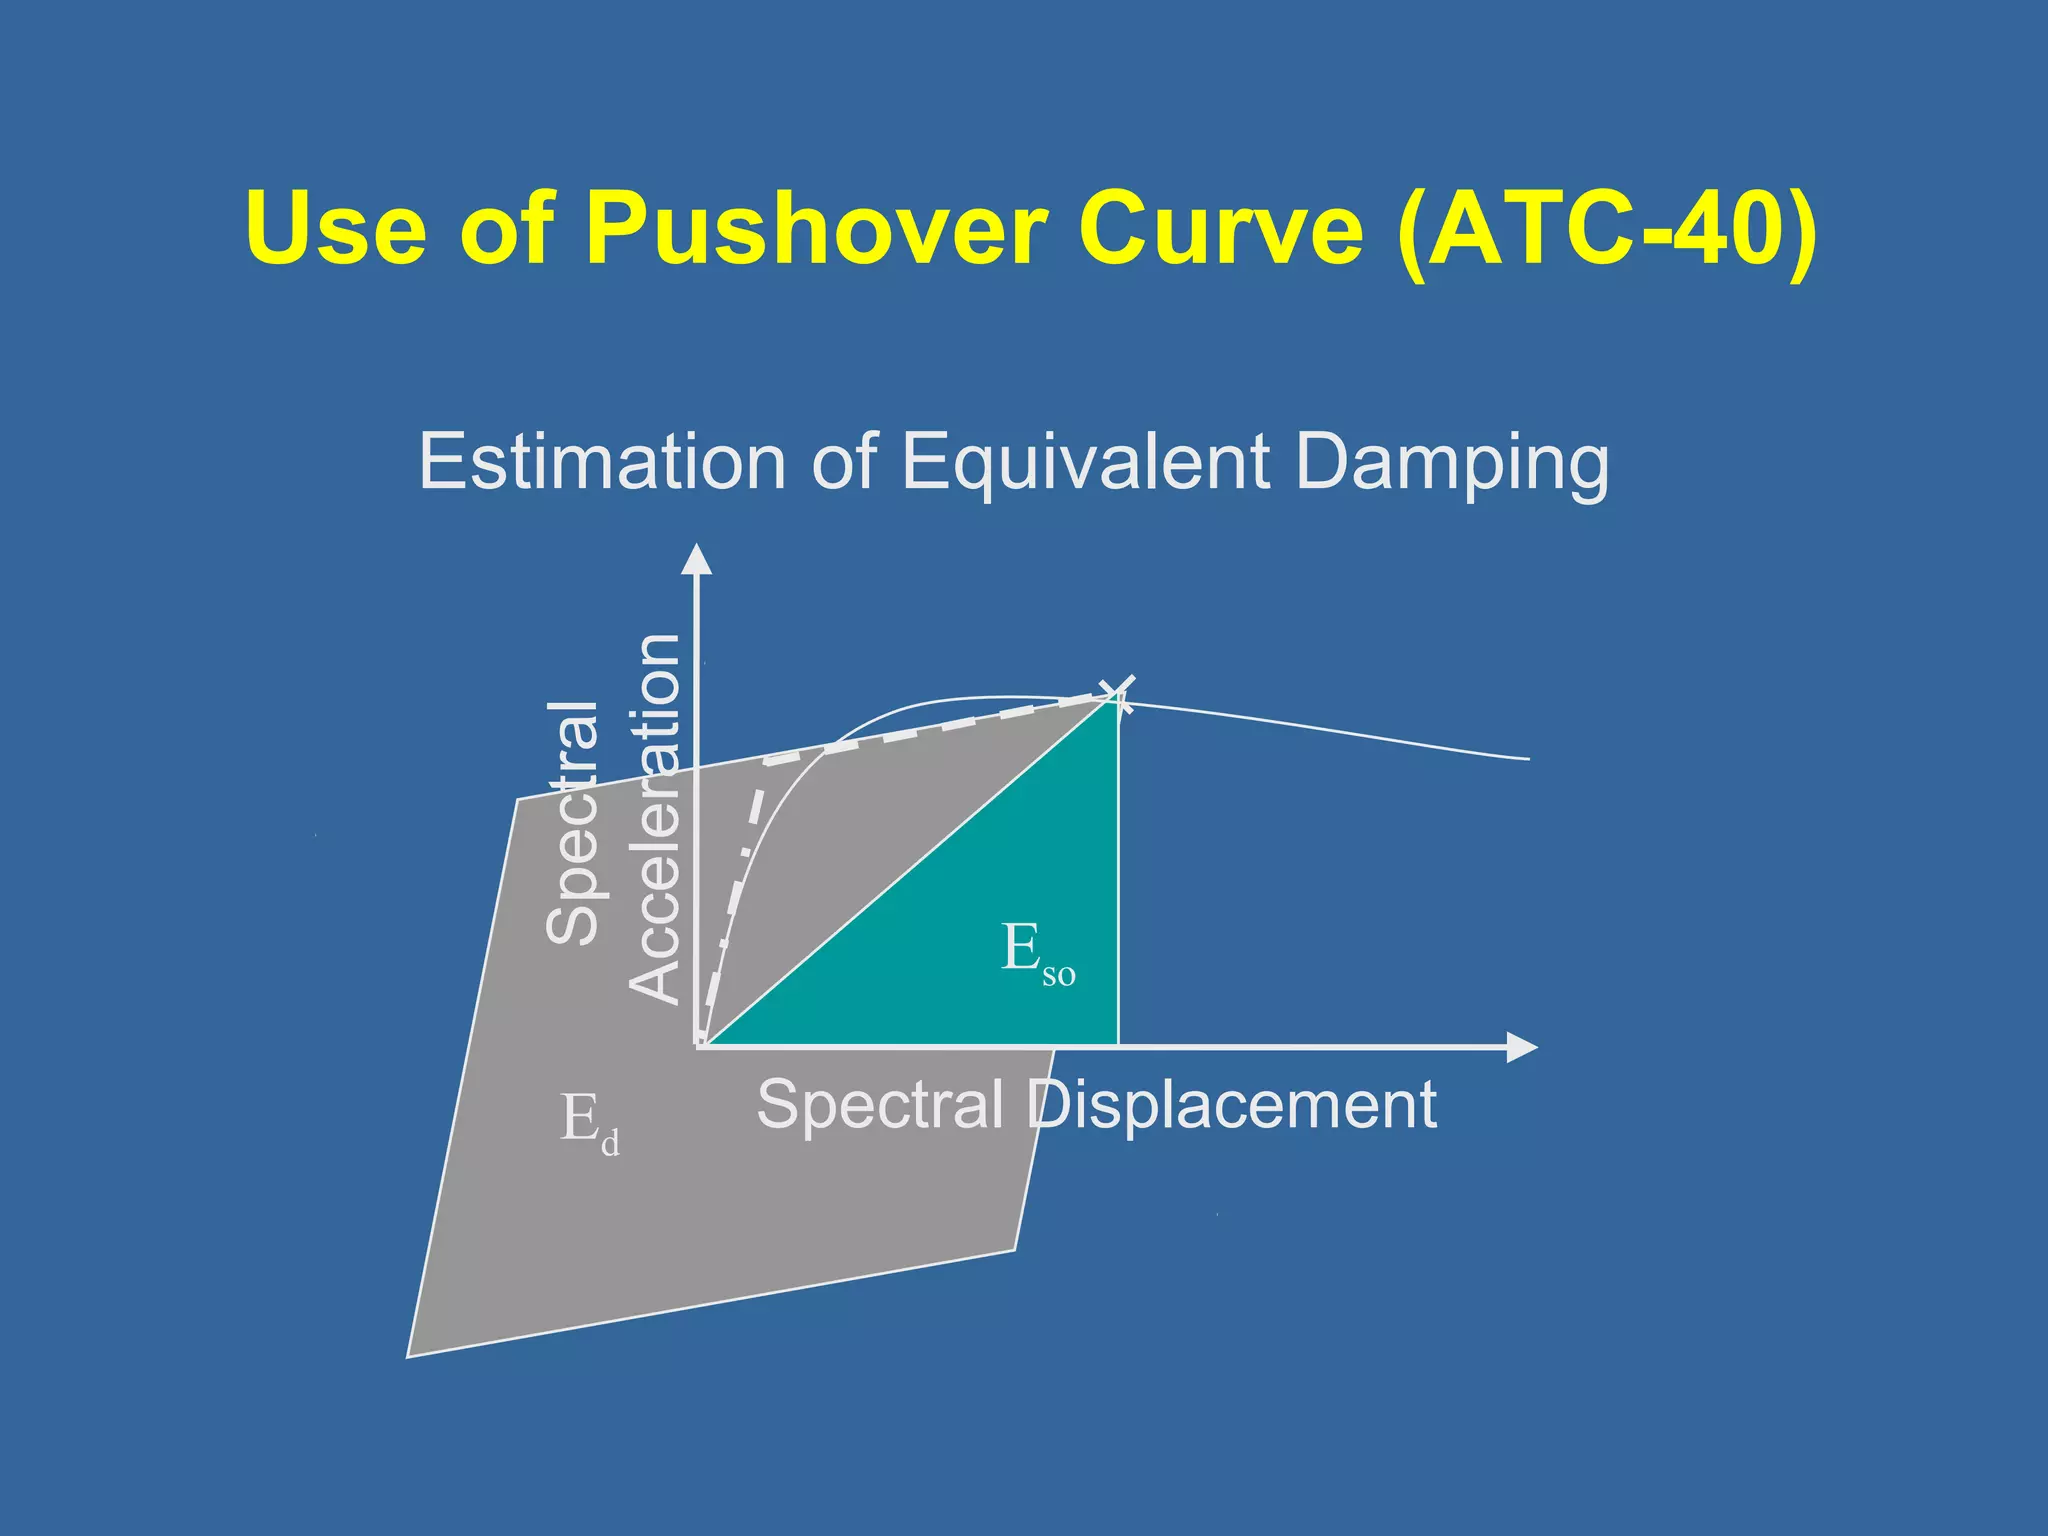
Use of PushoverCurve (ATC-40)
Estimation of Equivalent Damping
Ed
Eso
Spectral Displacement
Spectral
Acceleration
32.
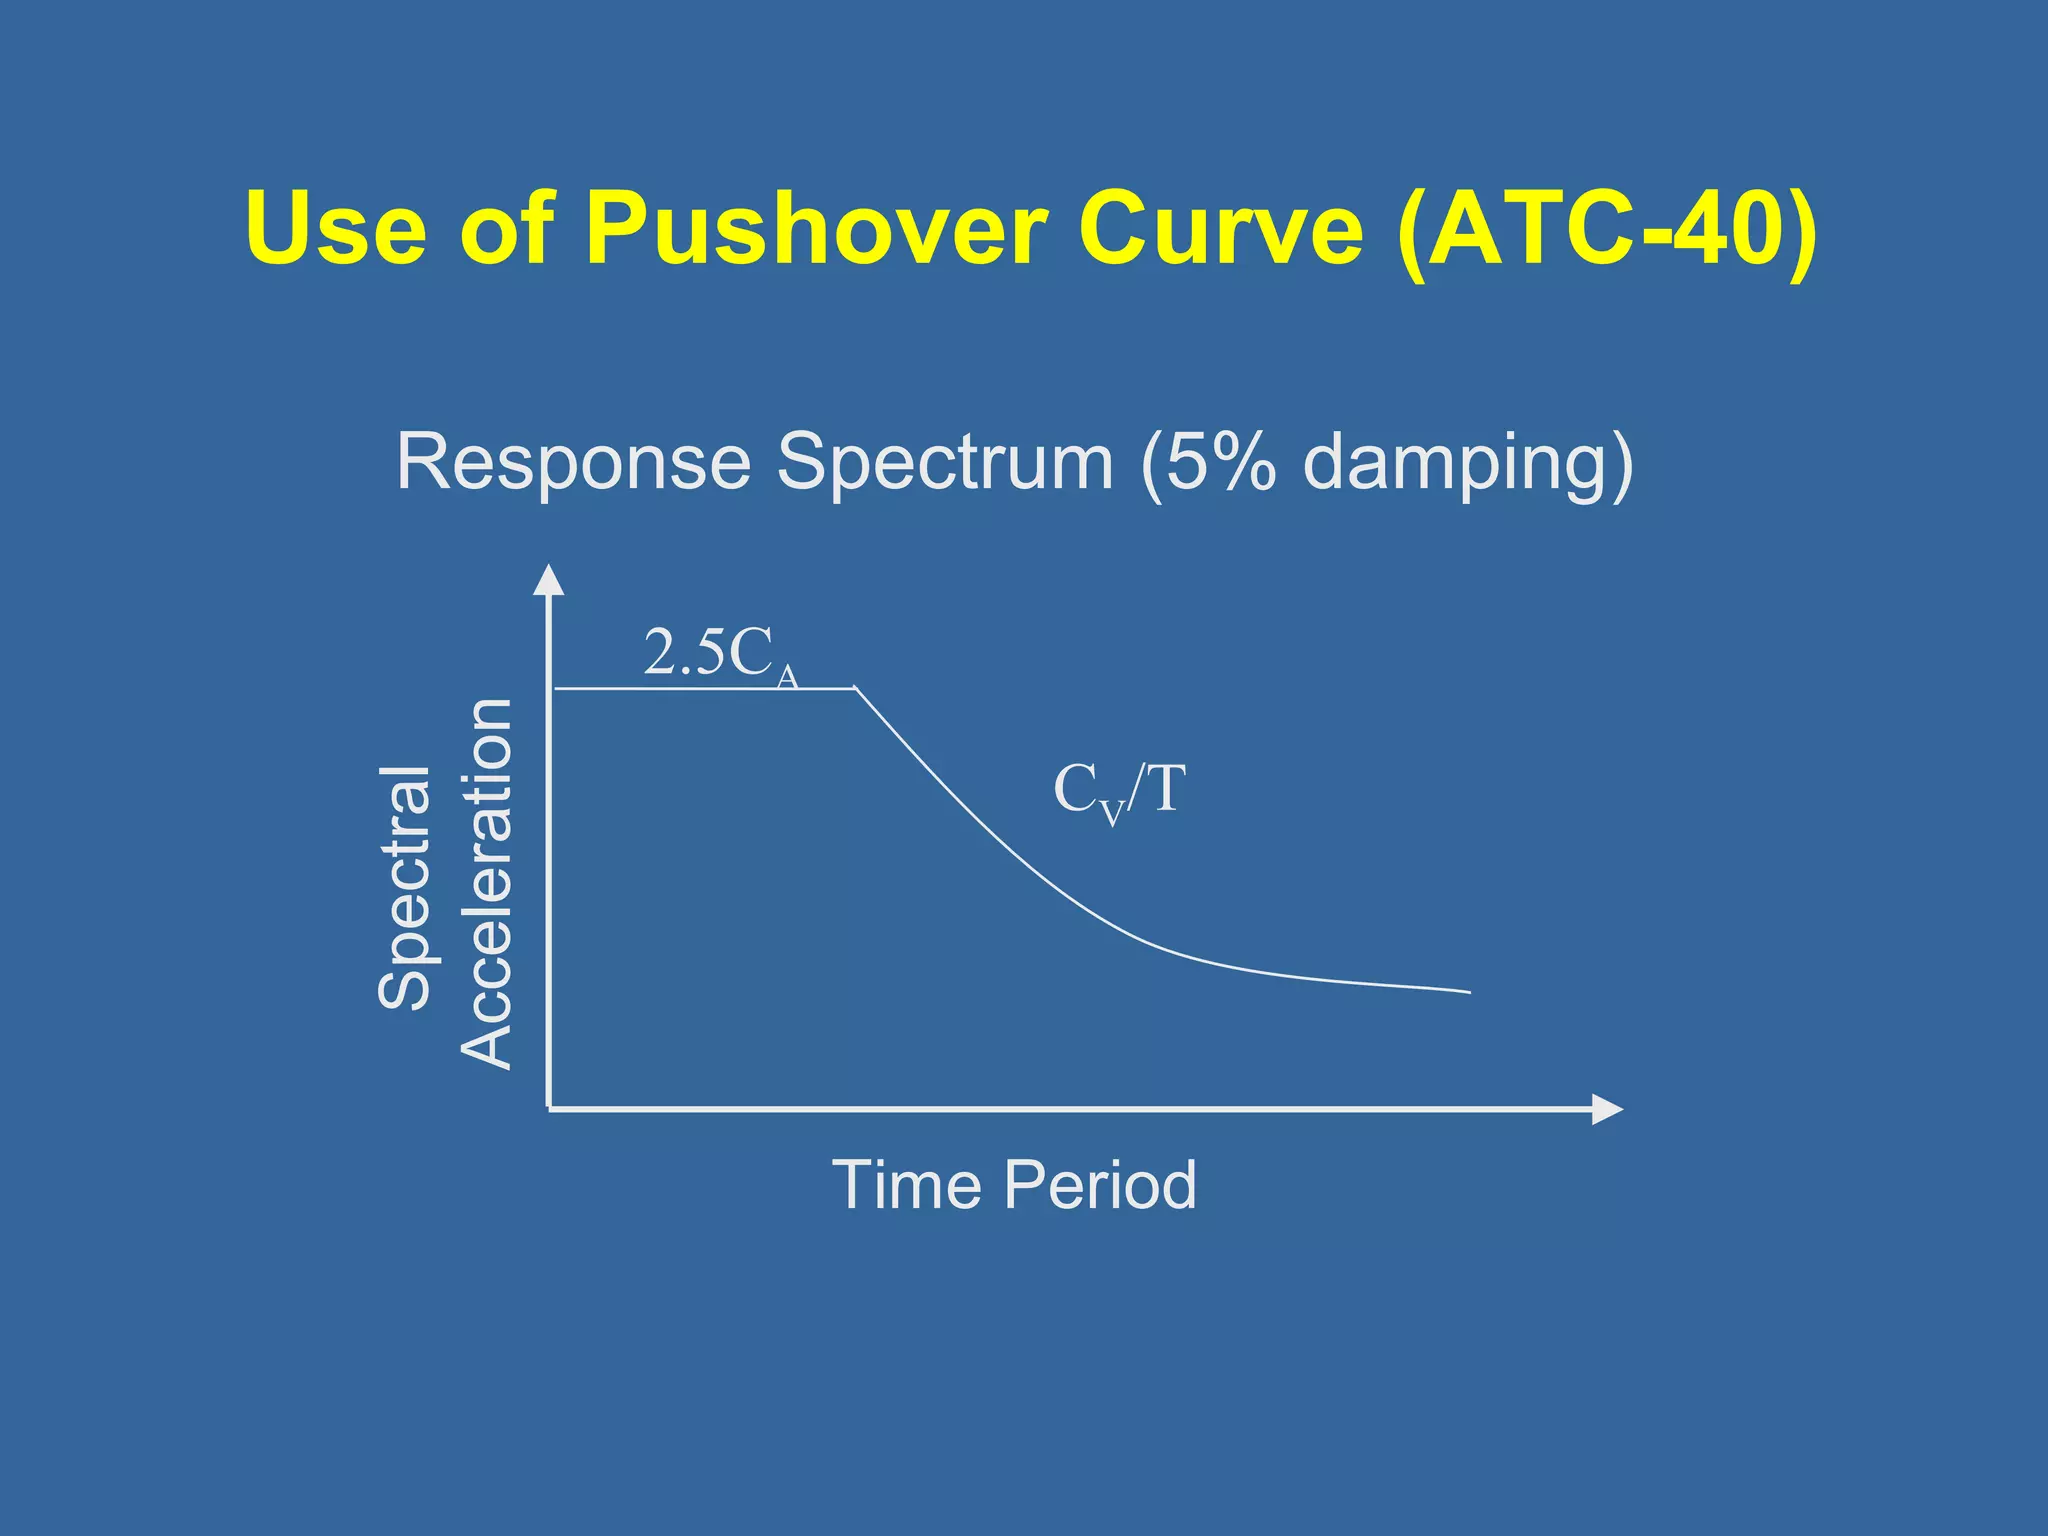
Use of PushoverCurve (ATC-40)
Response Spectrum (5% damping)
Spectral
Acceleration
Time Period
2.5CA
CV/T
33.
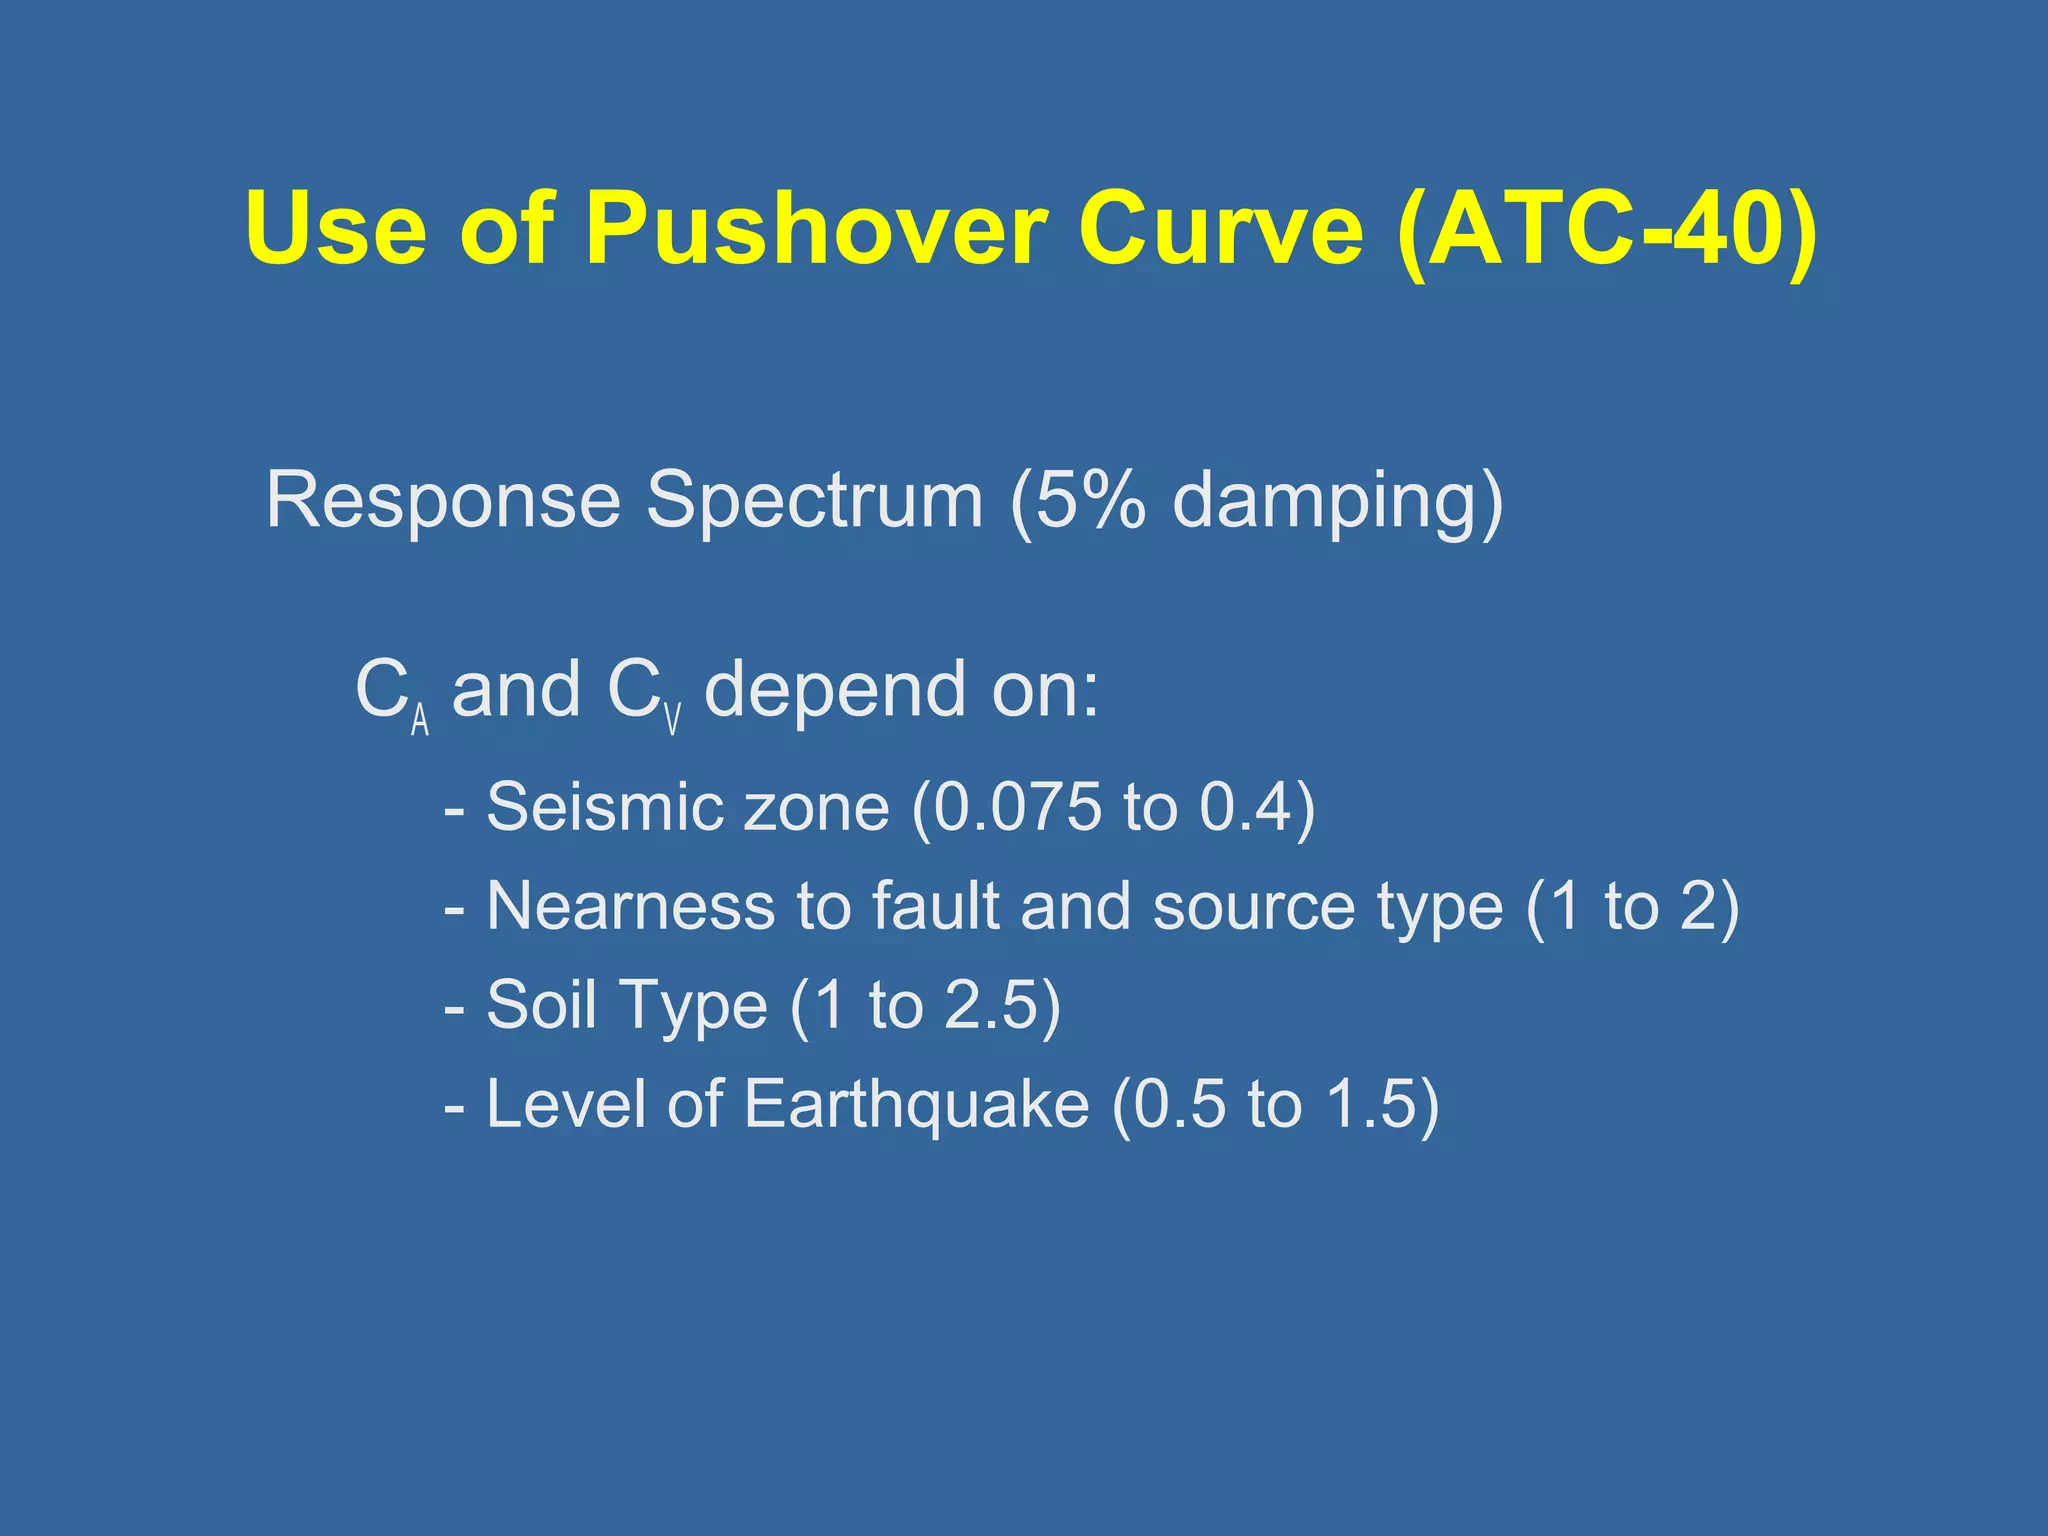
Use of PushoverCurve (ATC-40)
Response Spectrum (5% damping)
CA and CV depend on:
- Seismic zone (0.075 to 0.4)
- Nearness to fault and source type (1 to 2)
- Soil Type (1 to 2.5)
- Level of Earthquake (0.5 to 1.5)
34.
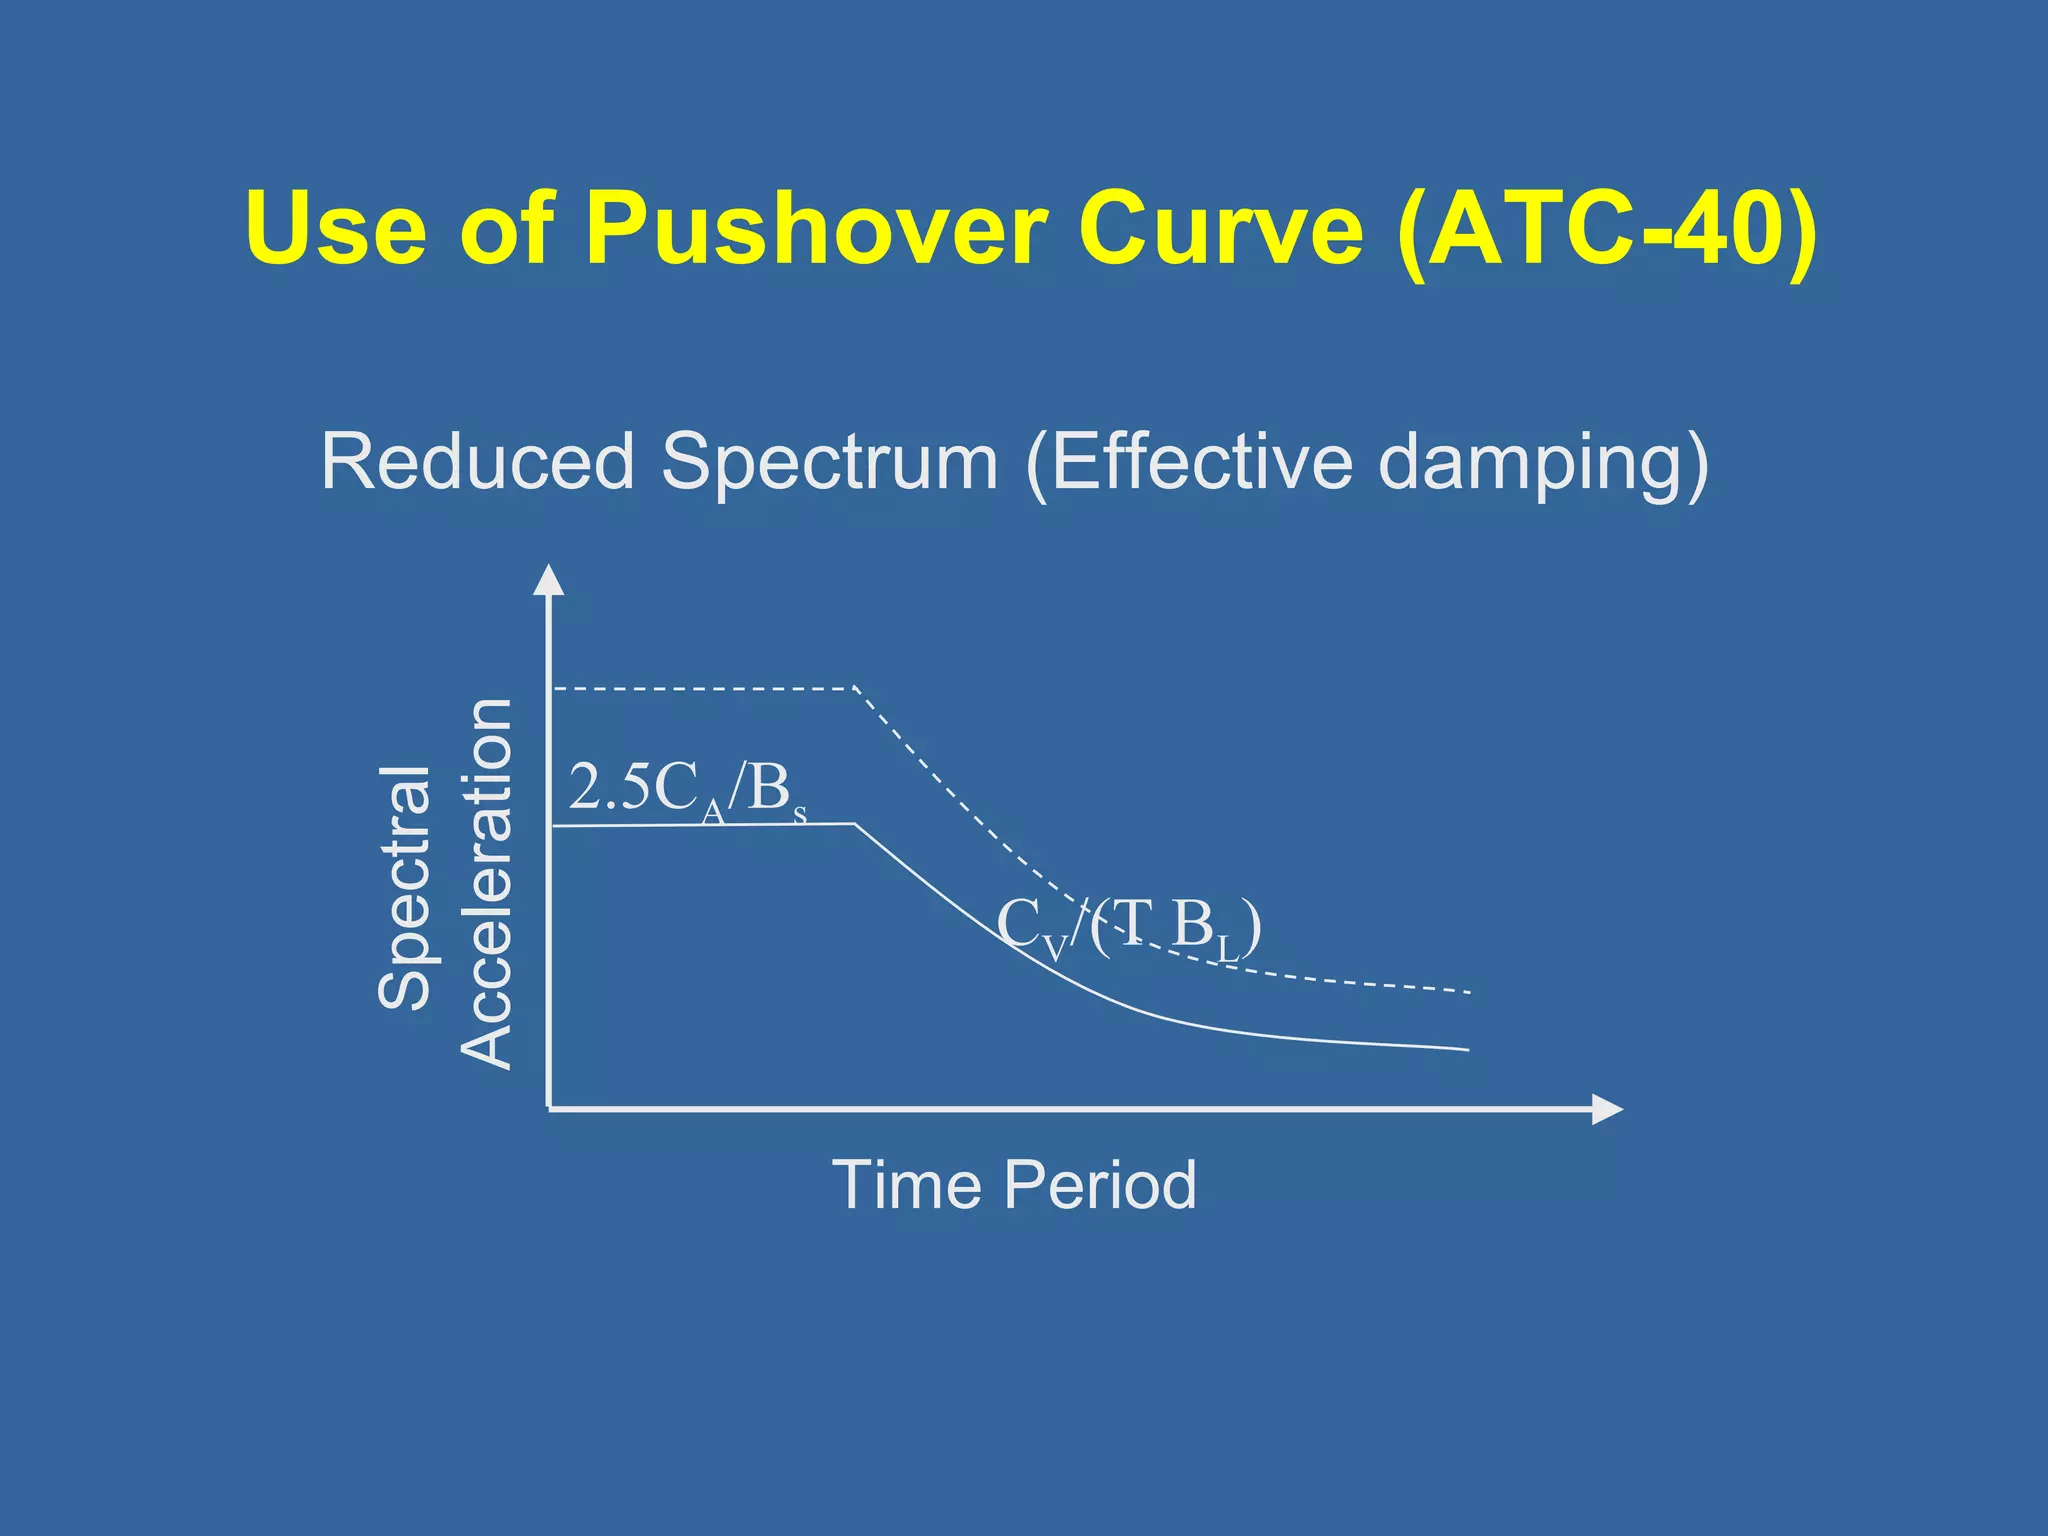
Use of PushoverCurve (ATC-40)
Reduced Spectrum (Effective damping)
Spectral
Acceleration
Time Period
2.5CA/Bs
CV/(T BL)
35.
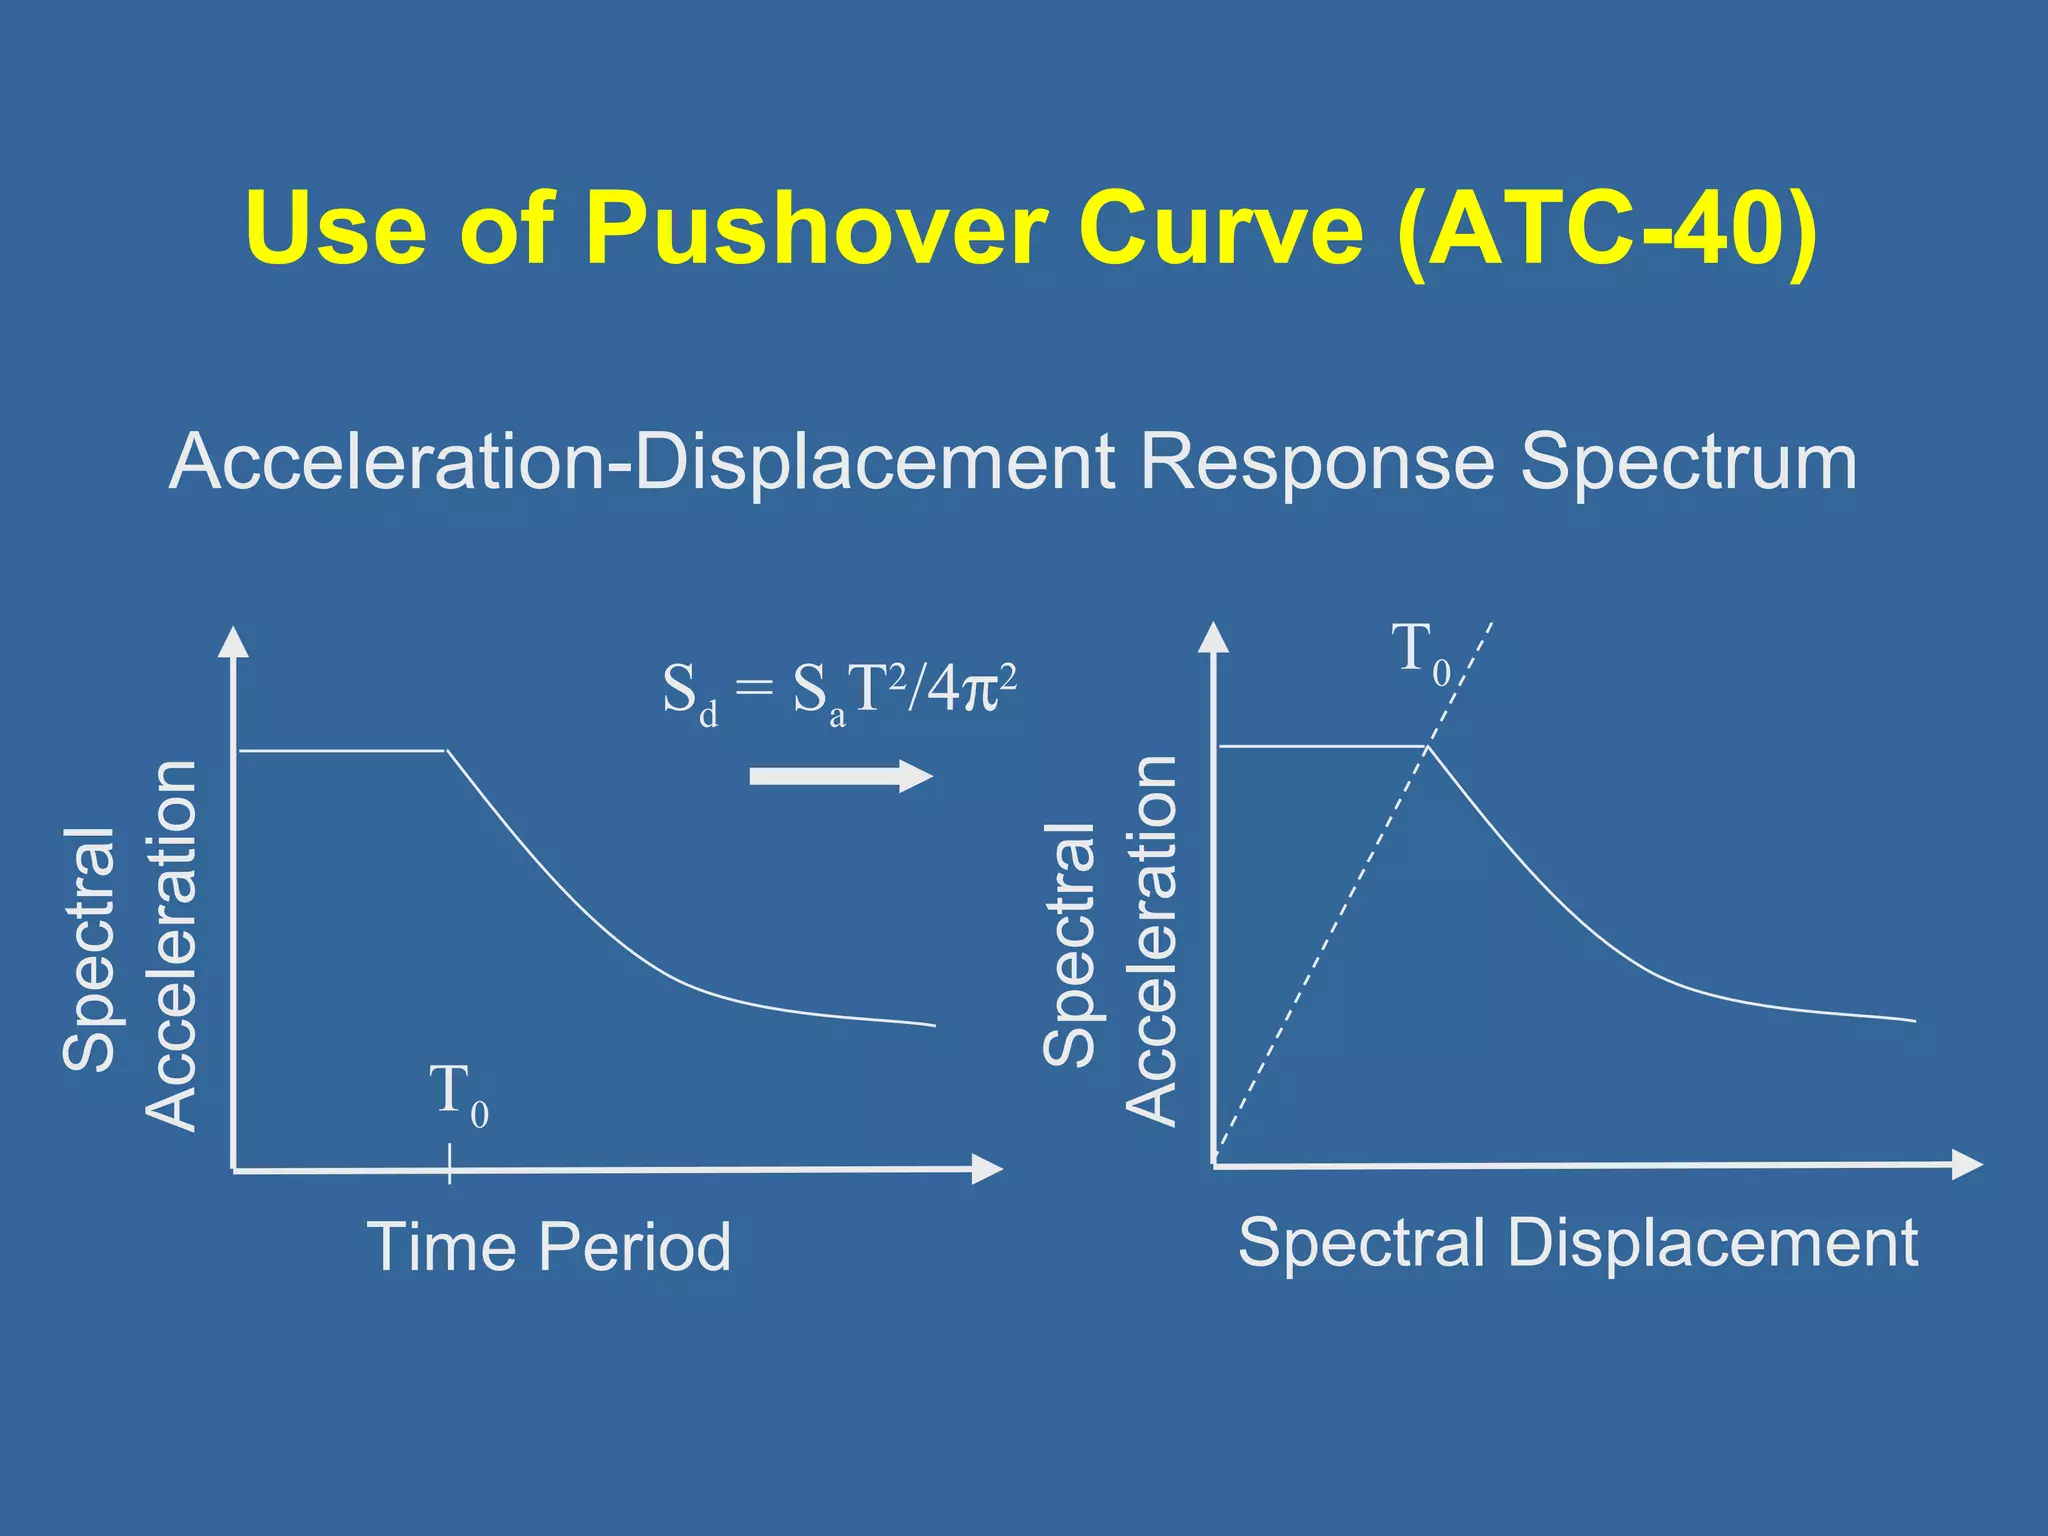
Use of PushoverCurve (ATC-40)
Acceleration-Displacement Response Spectrum
Spectral
Acceleration
T0
S T0 d = SaT2/4p2
Time Period
Spectral
Acceleration
Spectral Displacement
36.
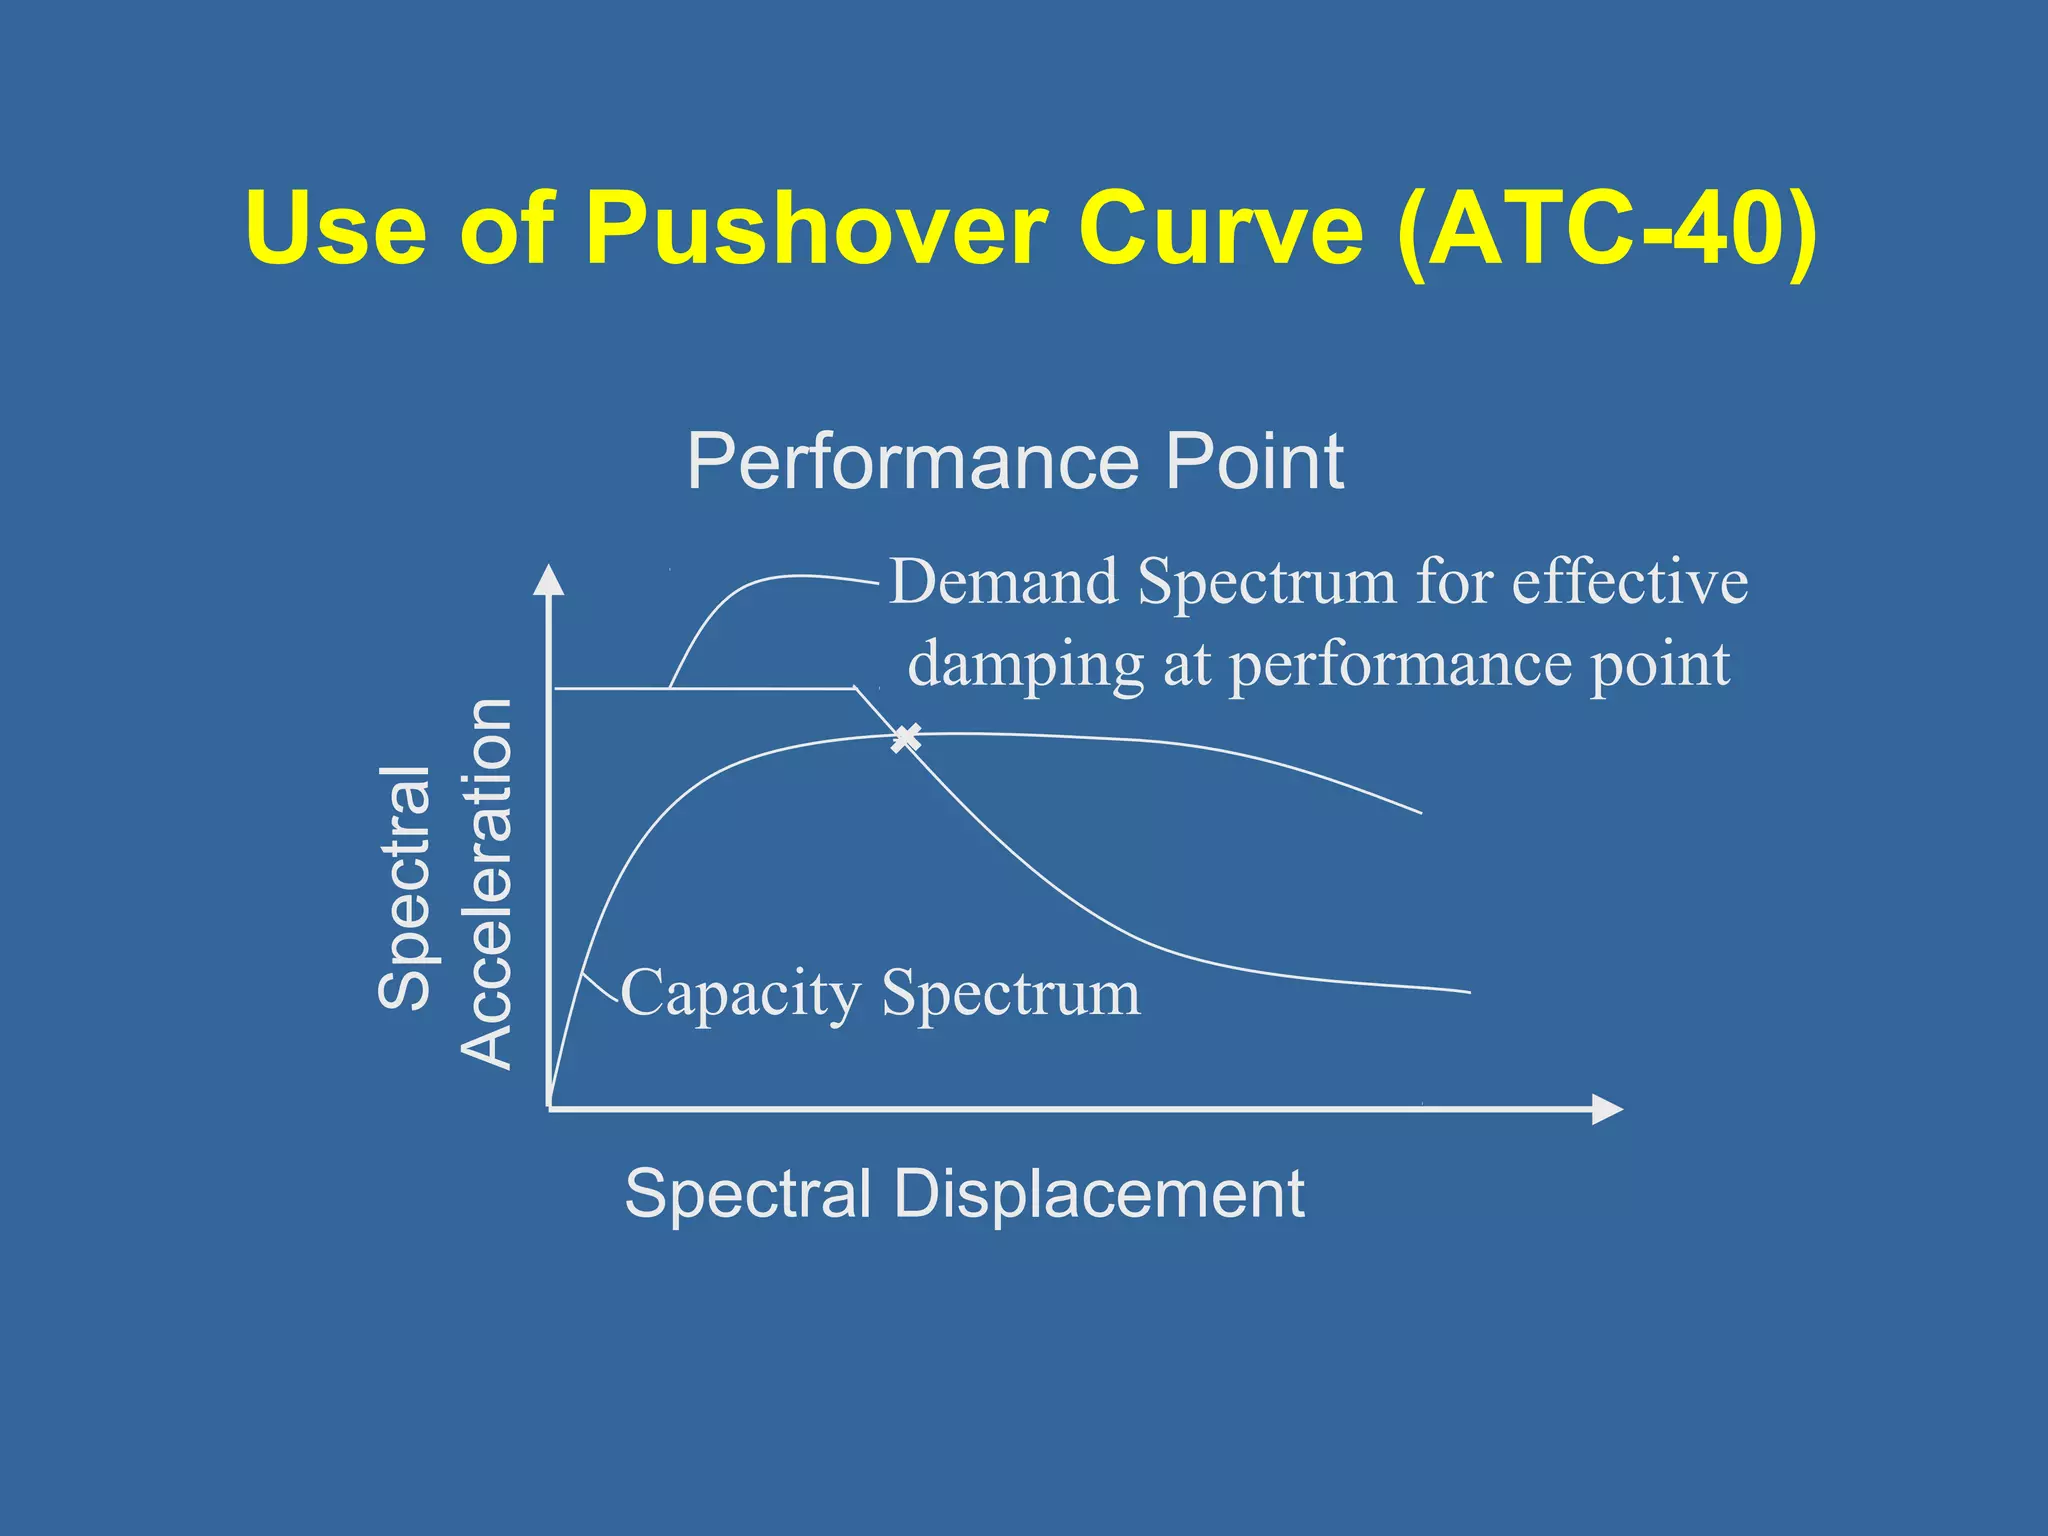
Use of PushoverCurve (ATC-40)
Performance Point
Spectral
Acceleration
Demand Spectrum for effective
damping at performance point
Capacity Spectrum
Spectral Displacement
37.
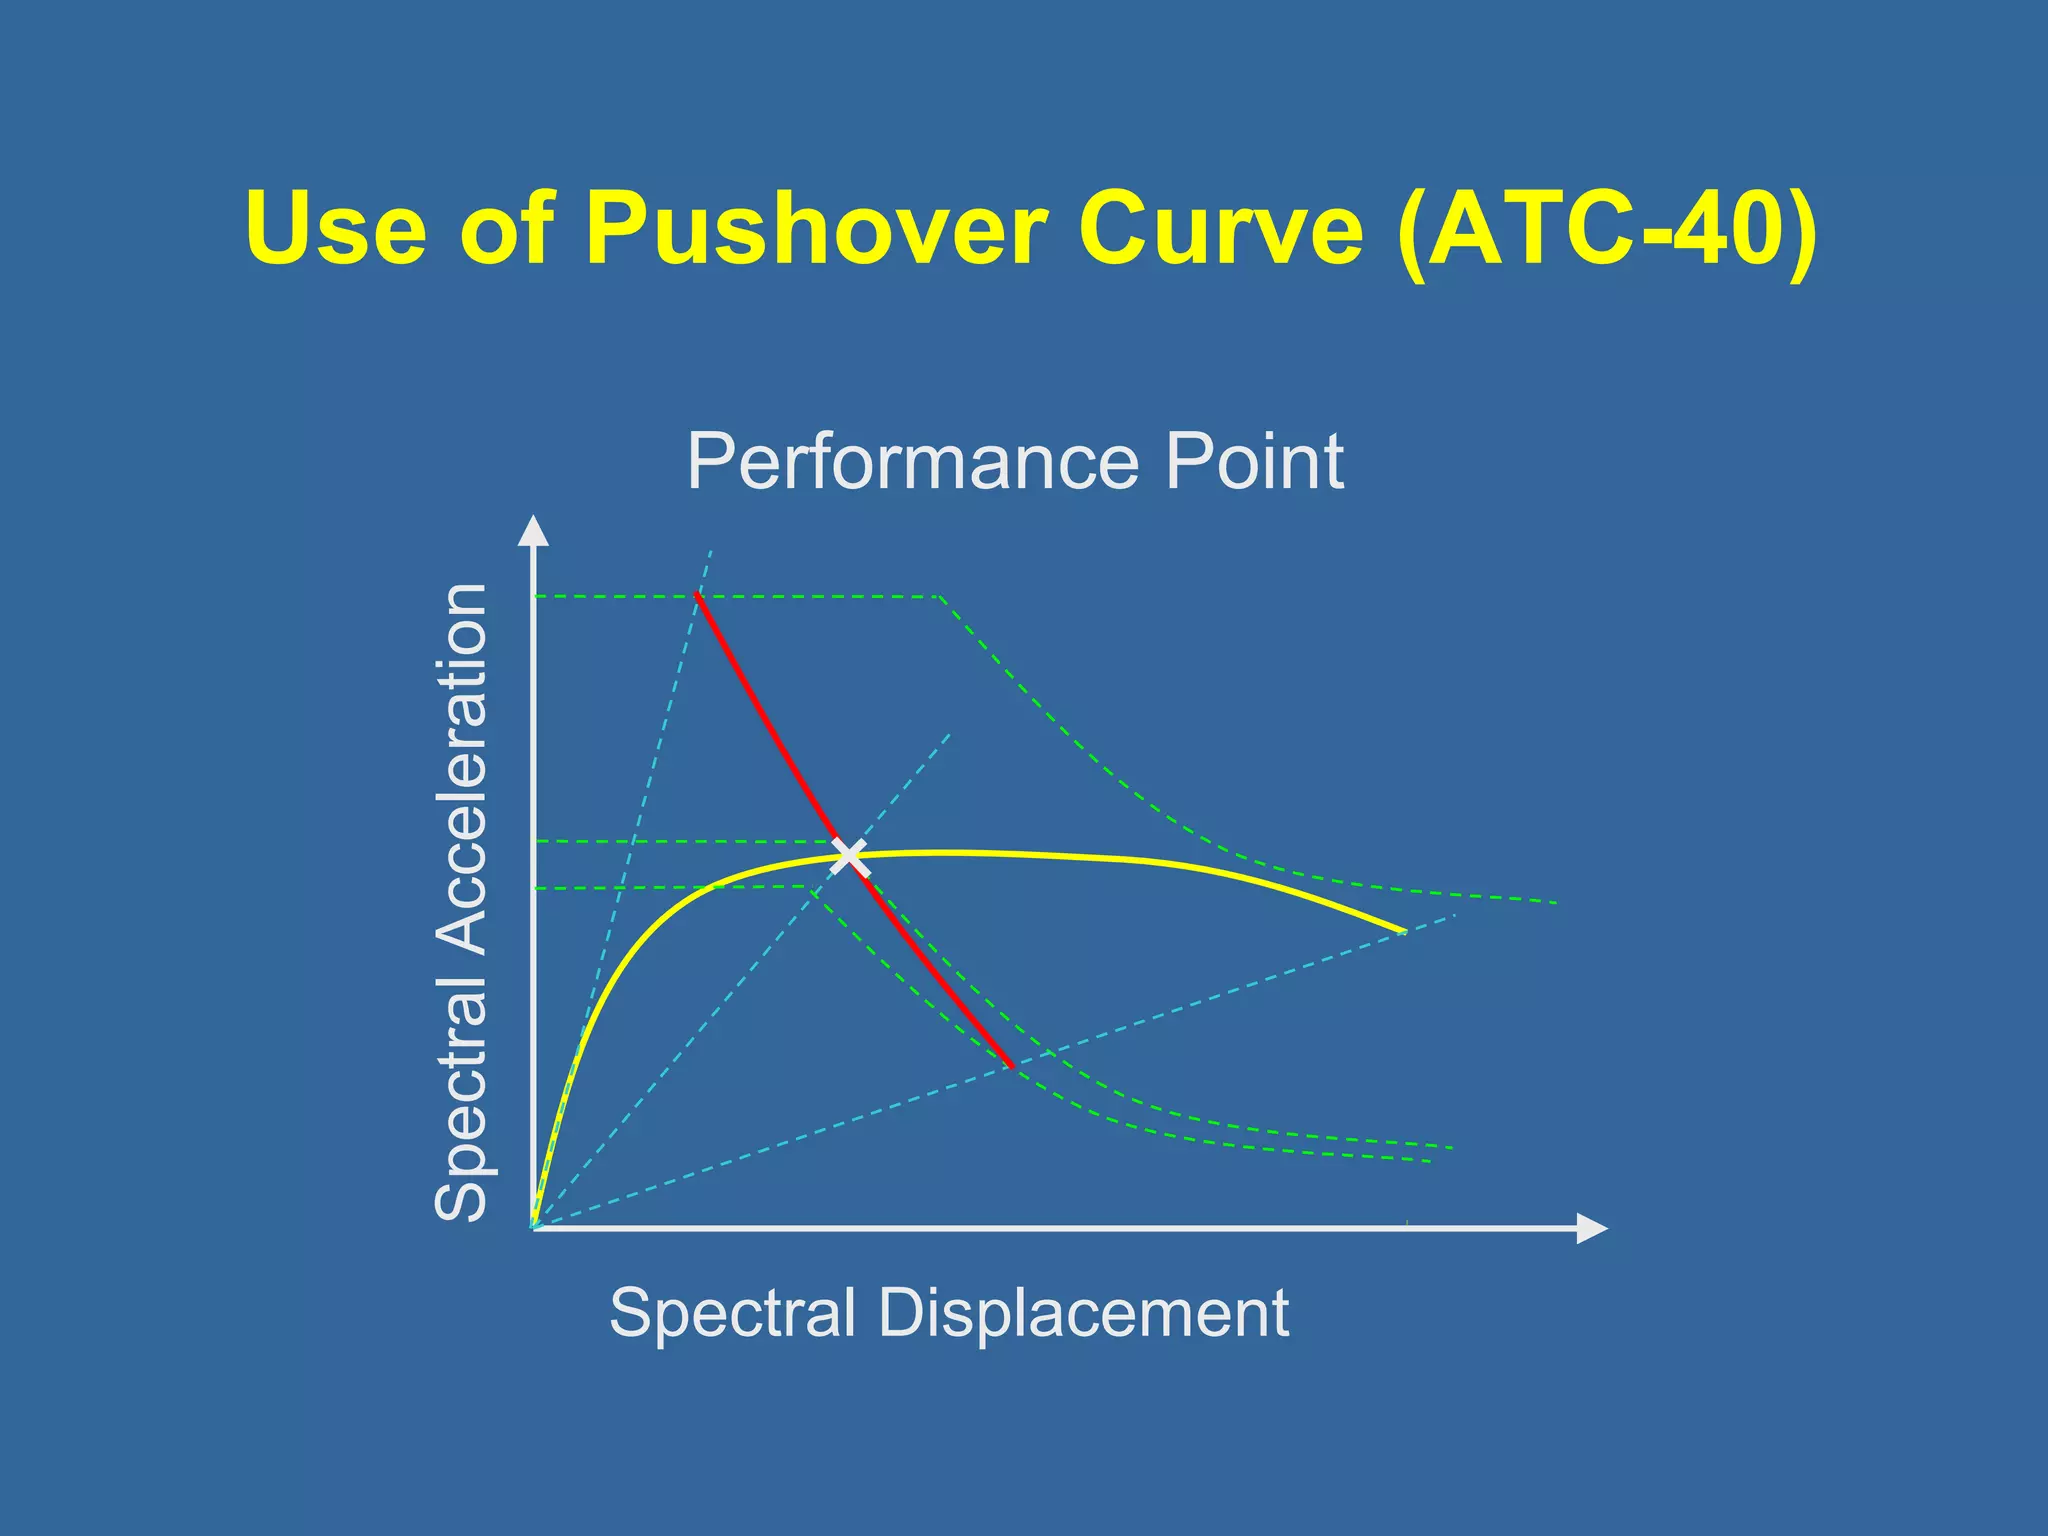
Use of PushoverCurve (ATC-40)
Performance Point
Spectral Acceleration
Spectral Displacement
38.
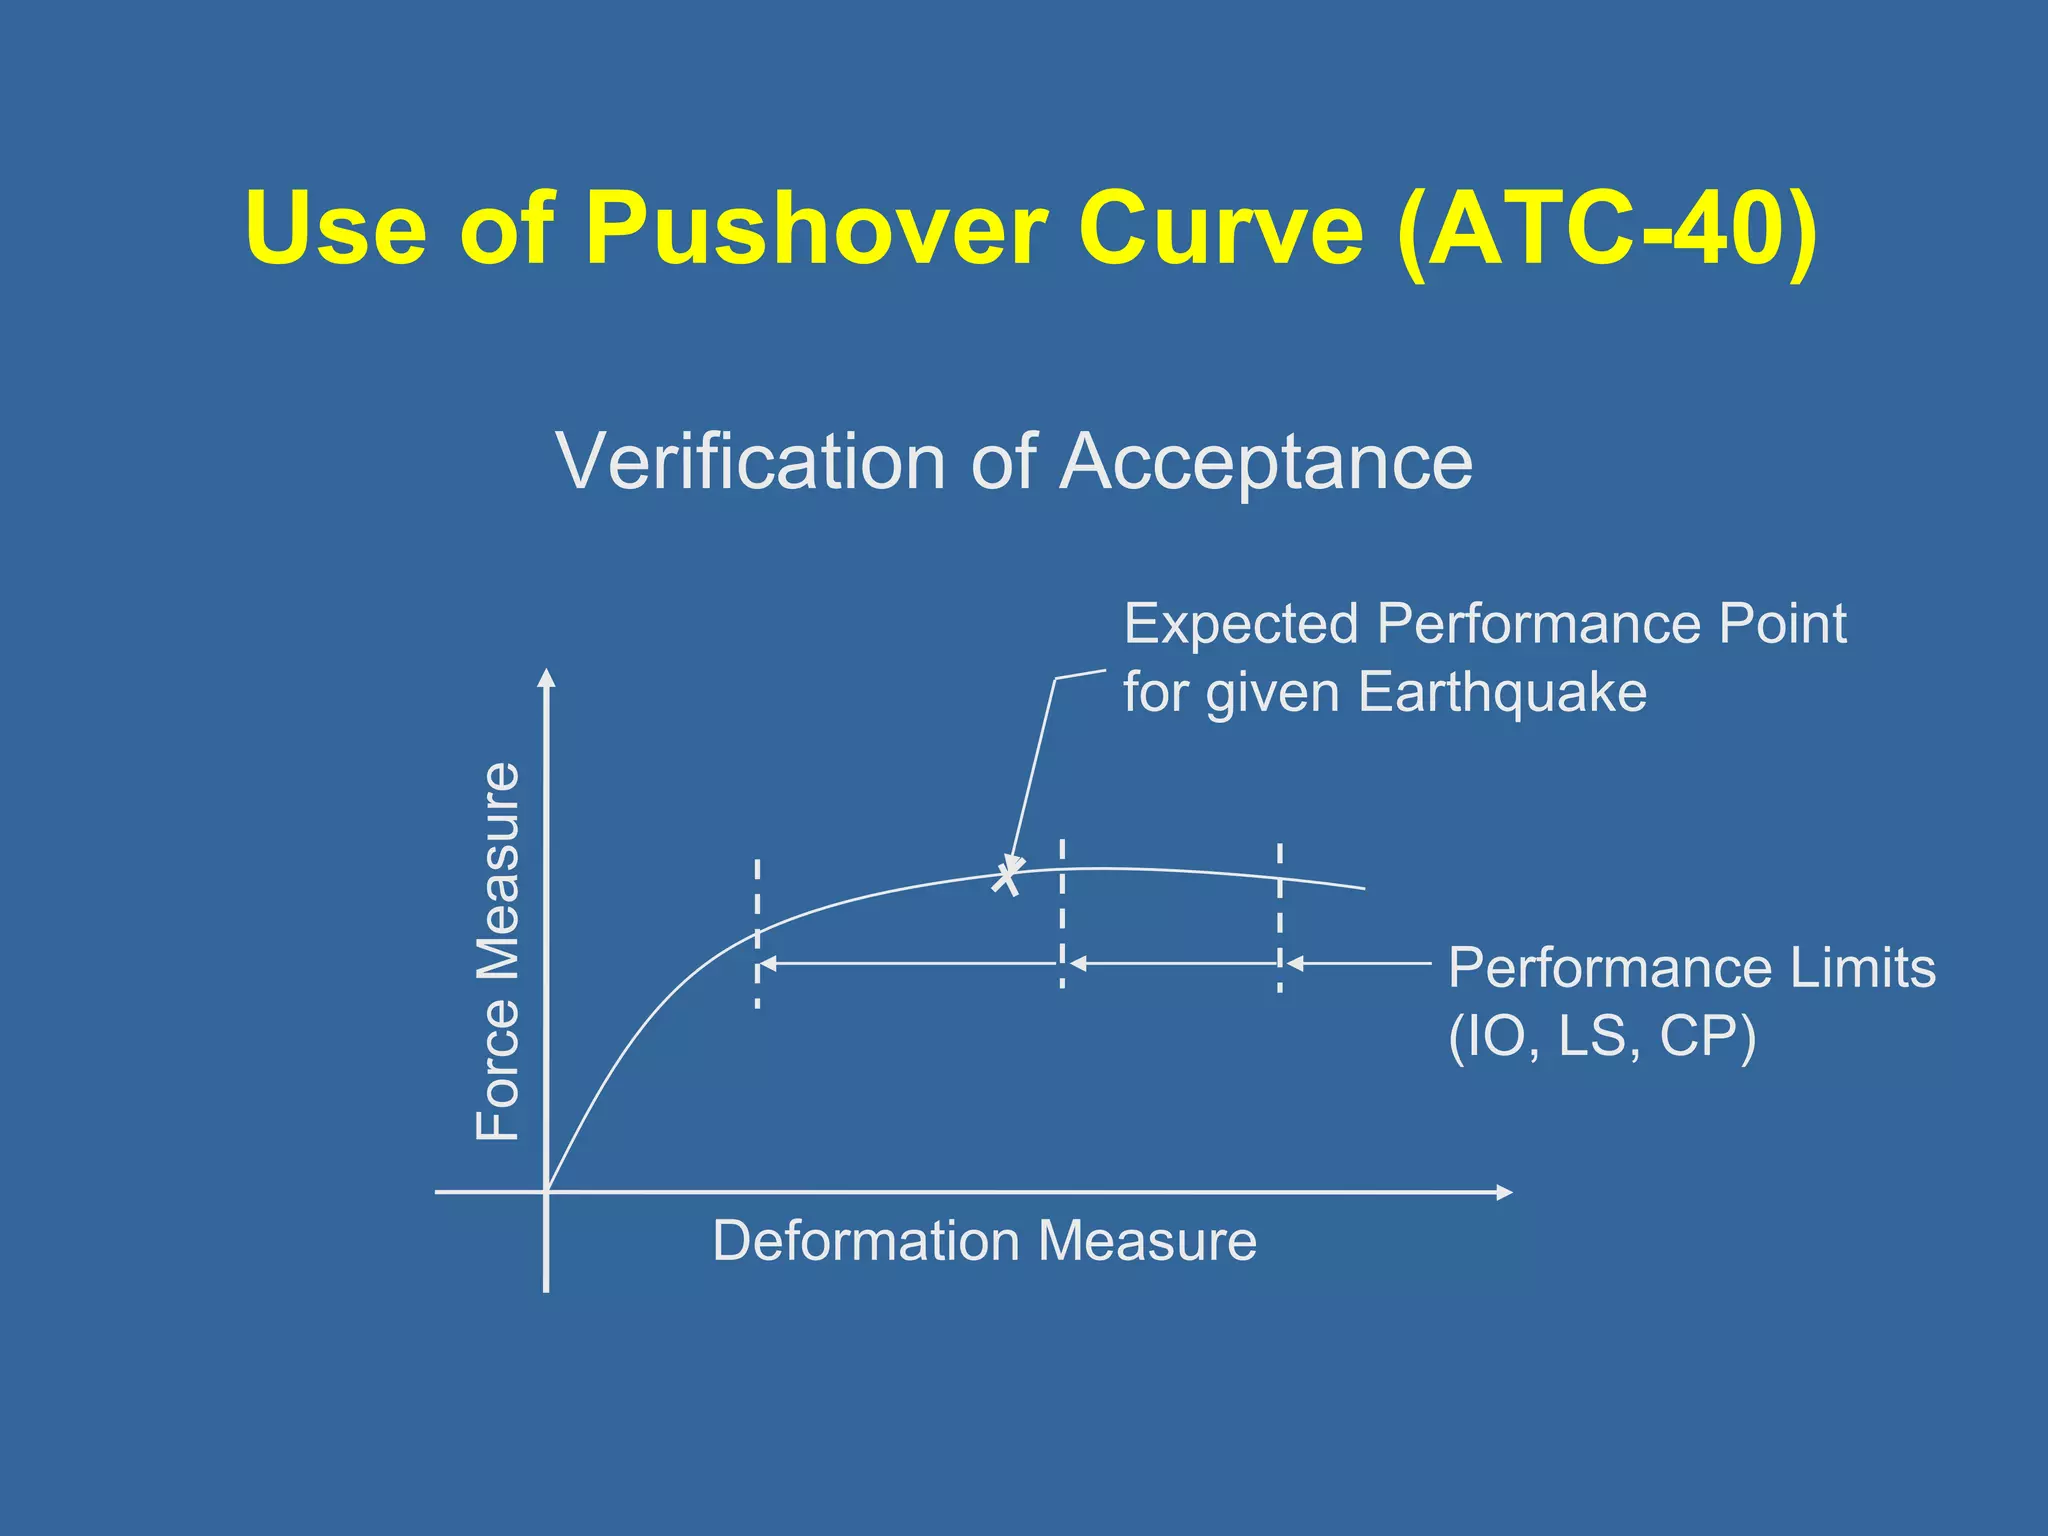
Use of PushoverCurve (ATC-40)
Verification of Acceptance
Expected Performance Point
for given Earthquake
Deformation Measure
Force Measure
Performance Limits
(IO, LS, CP)
Use of PushoverCurve (FEMA-273)
(Displacement Coefficient Method)
Estimate Target Displacement
Verify Acceptance
41.
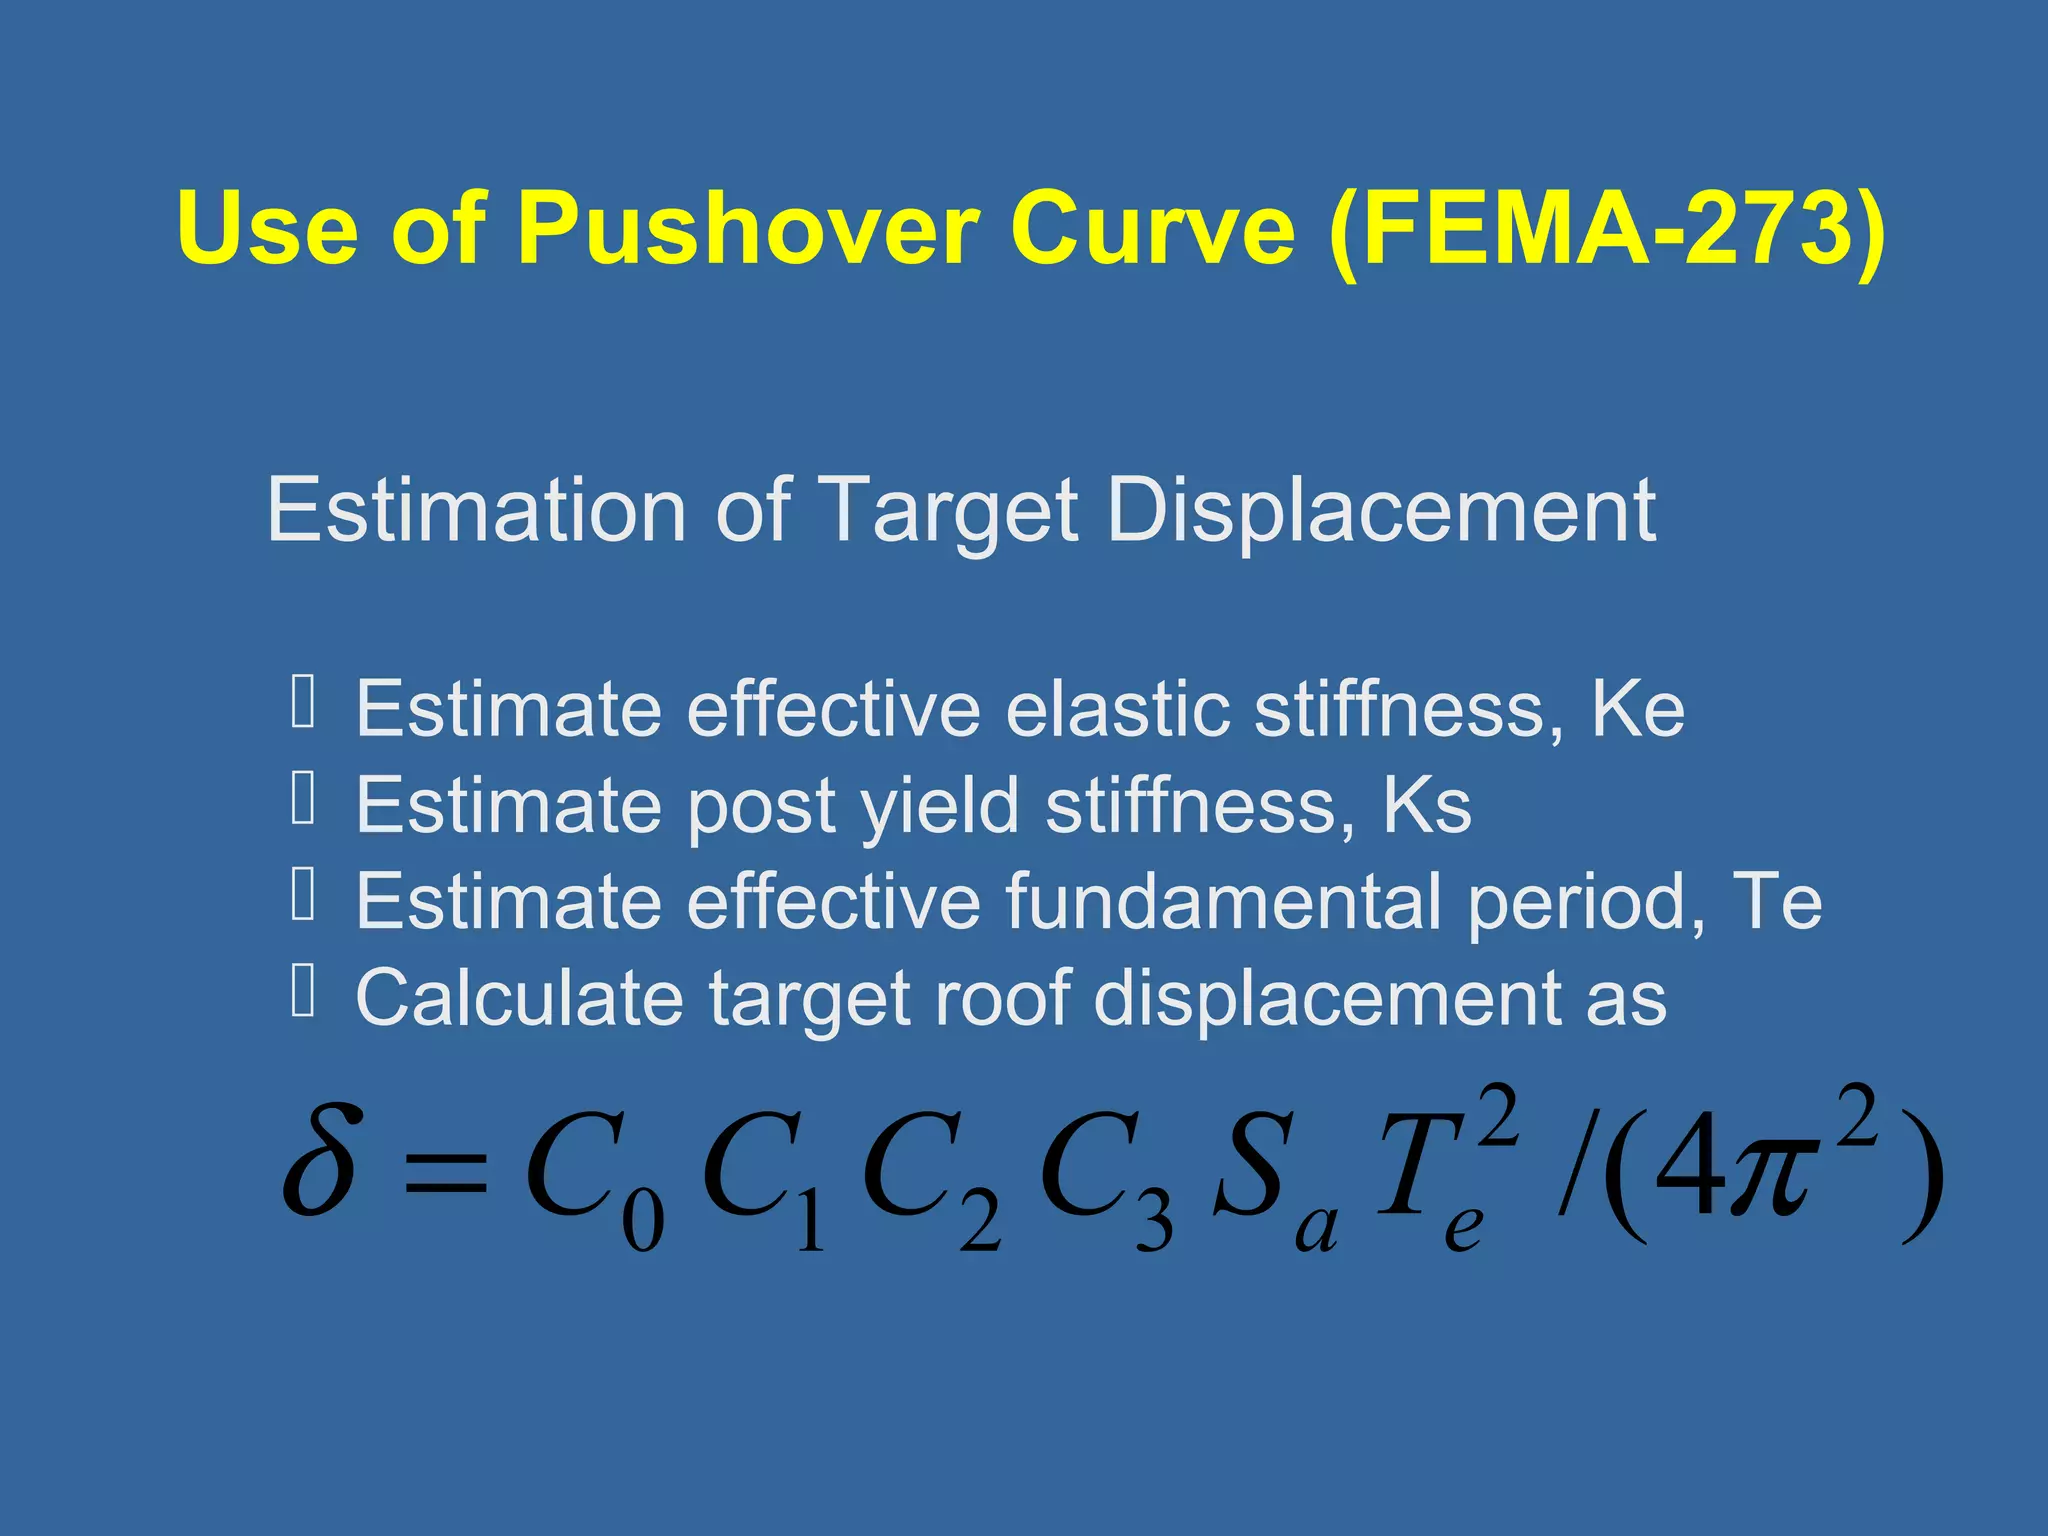
Use of PushoverCurve (FEMA-273)
Estimation of Target Displacement
Estimate effective elastic stiffness, Ke
Estimate post yield stiffness, Ks
Estimate effective fundamental period, Te
Calculate target roof displacement as
2 /(4 2 )
d = C0 C1C2 C3 Sa Te p
42.
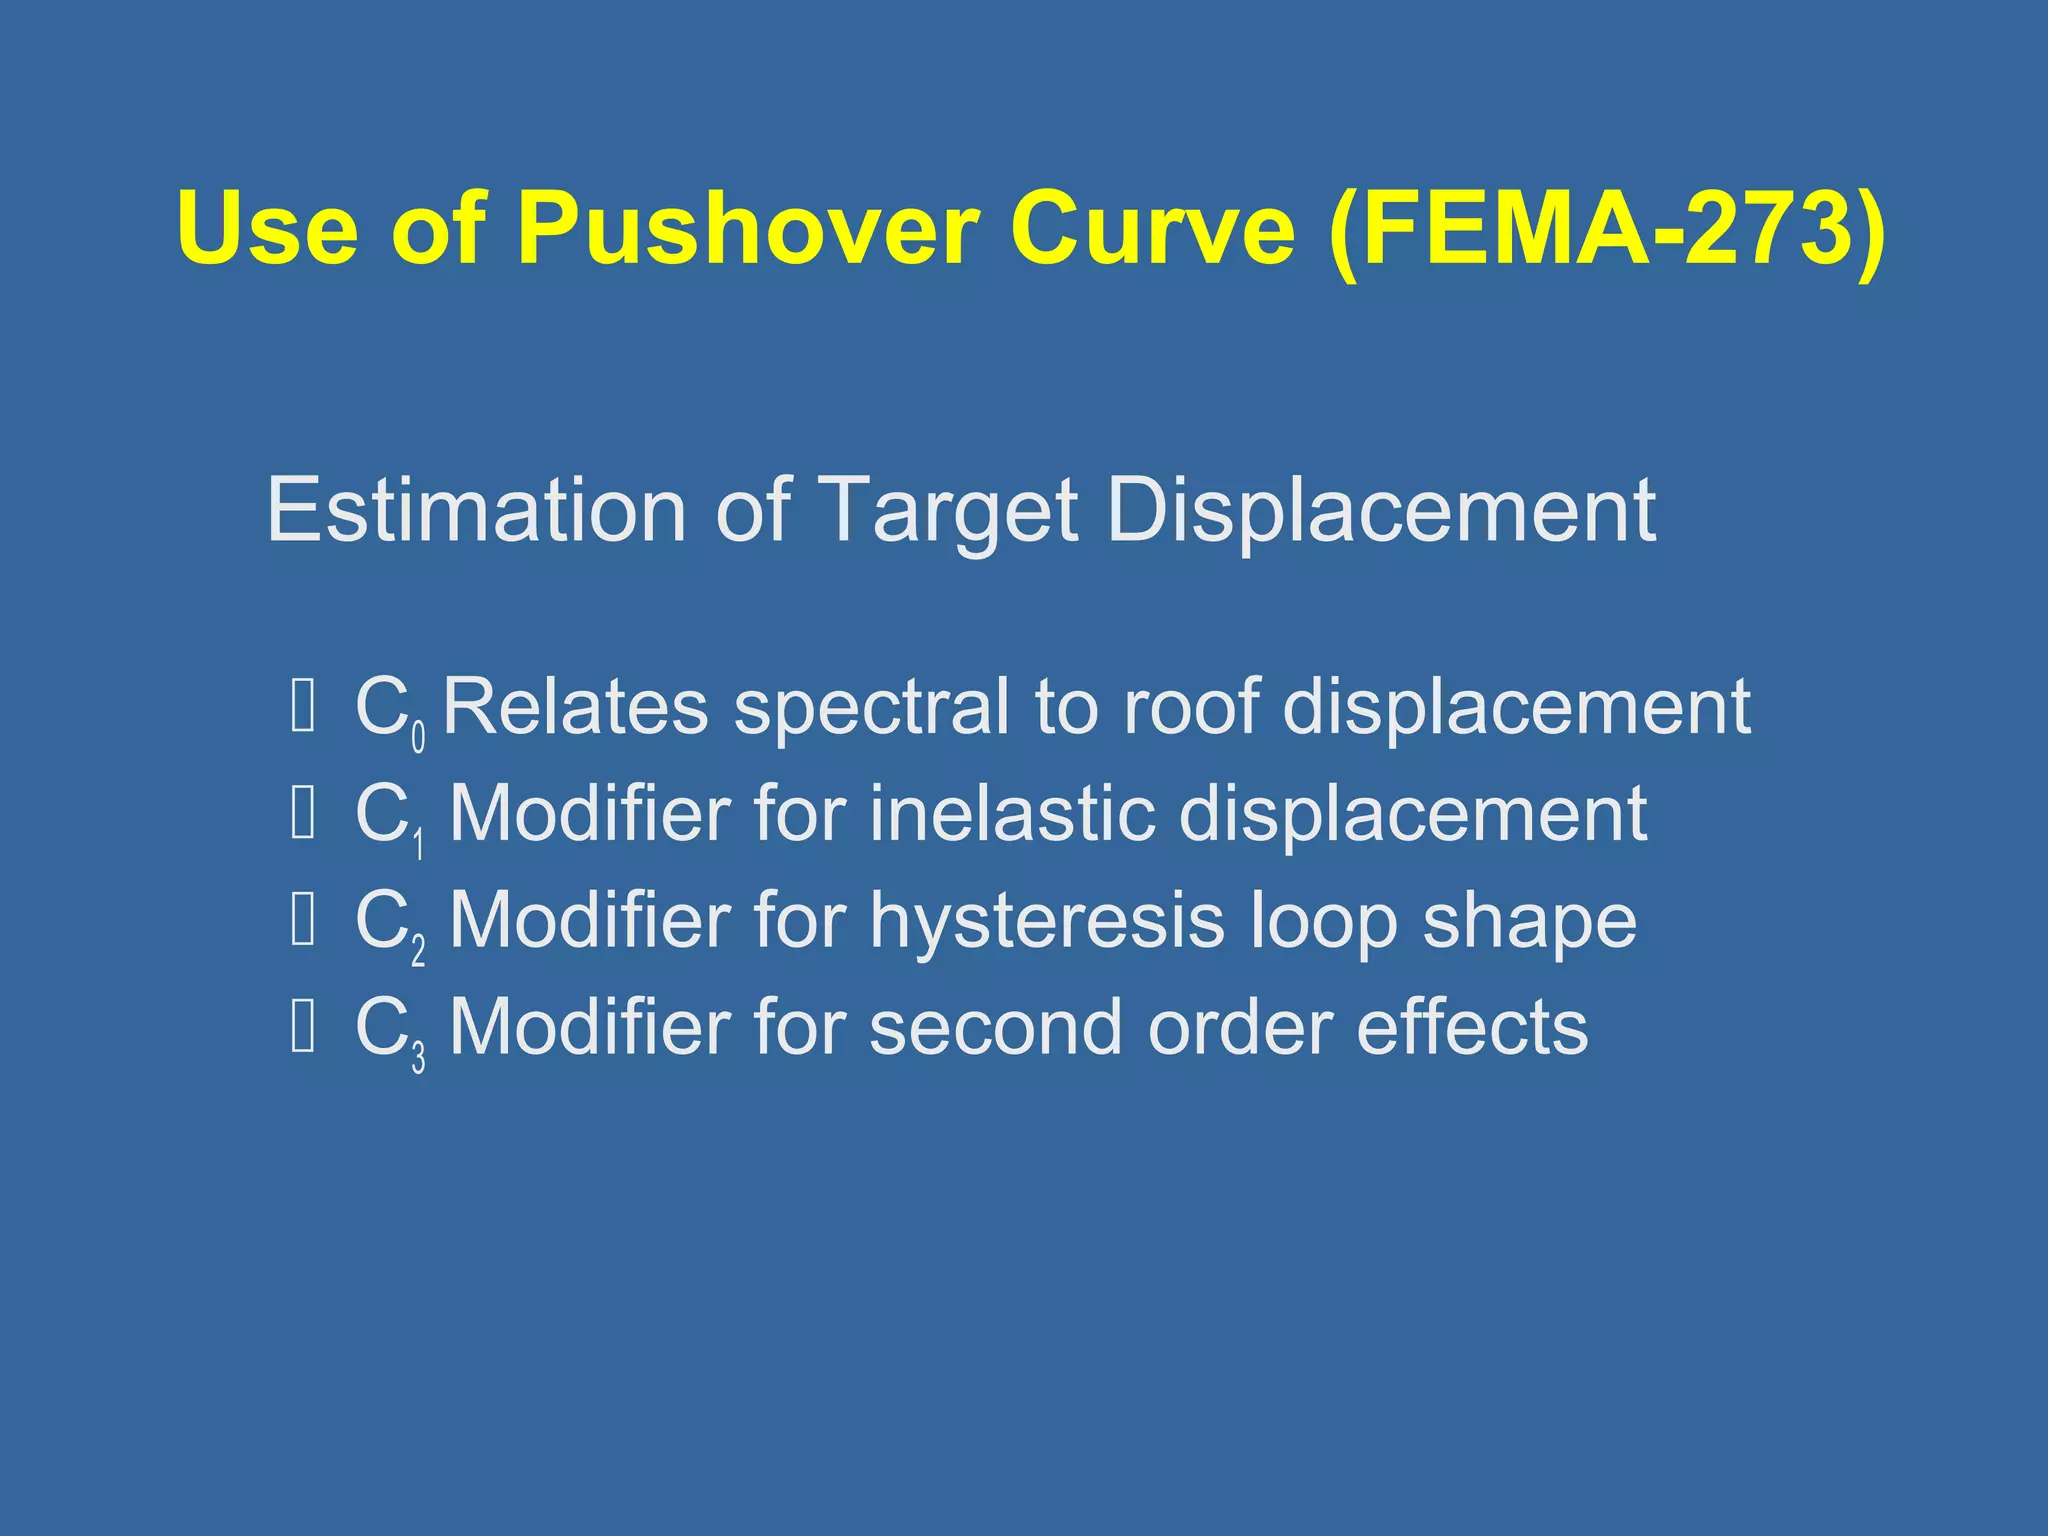
Use of PushoverCurve (FEMA-273)
Estimation of Target Displacement
C0 Relates spectral to roof displacement
C1 Modifier for inelastic displacement
C2 Modifier for hysteresis loop shape
C3 Modifier for second order effects
43.
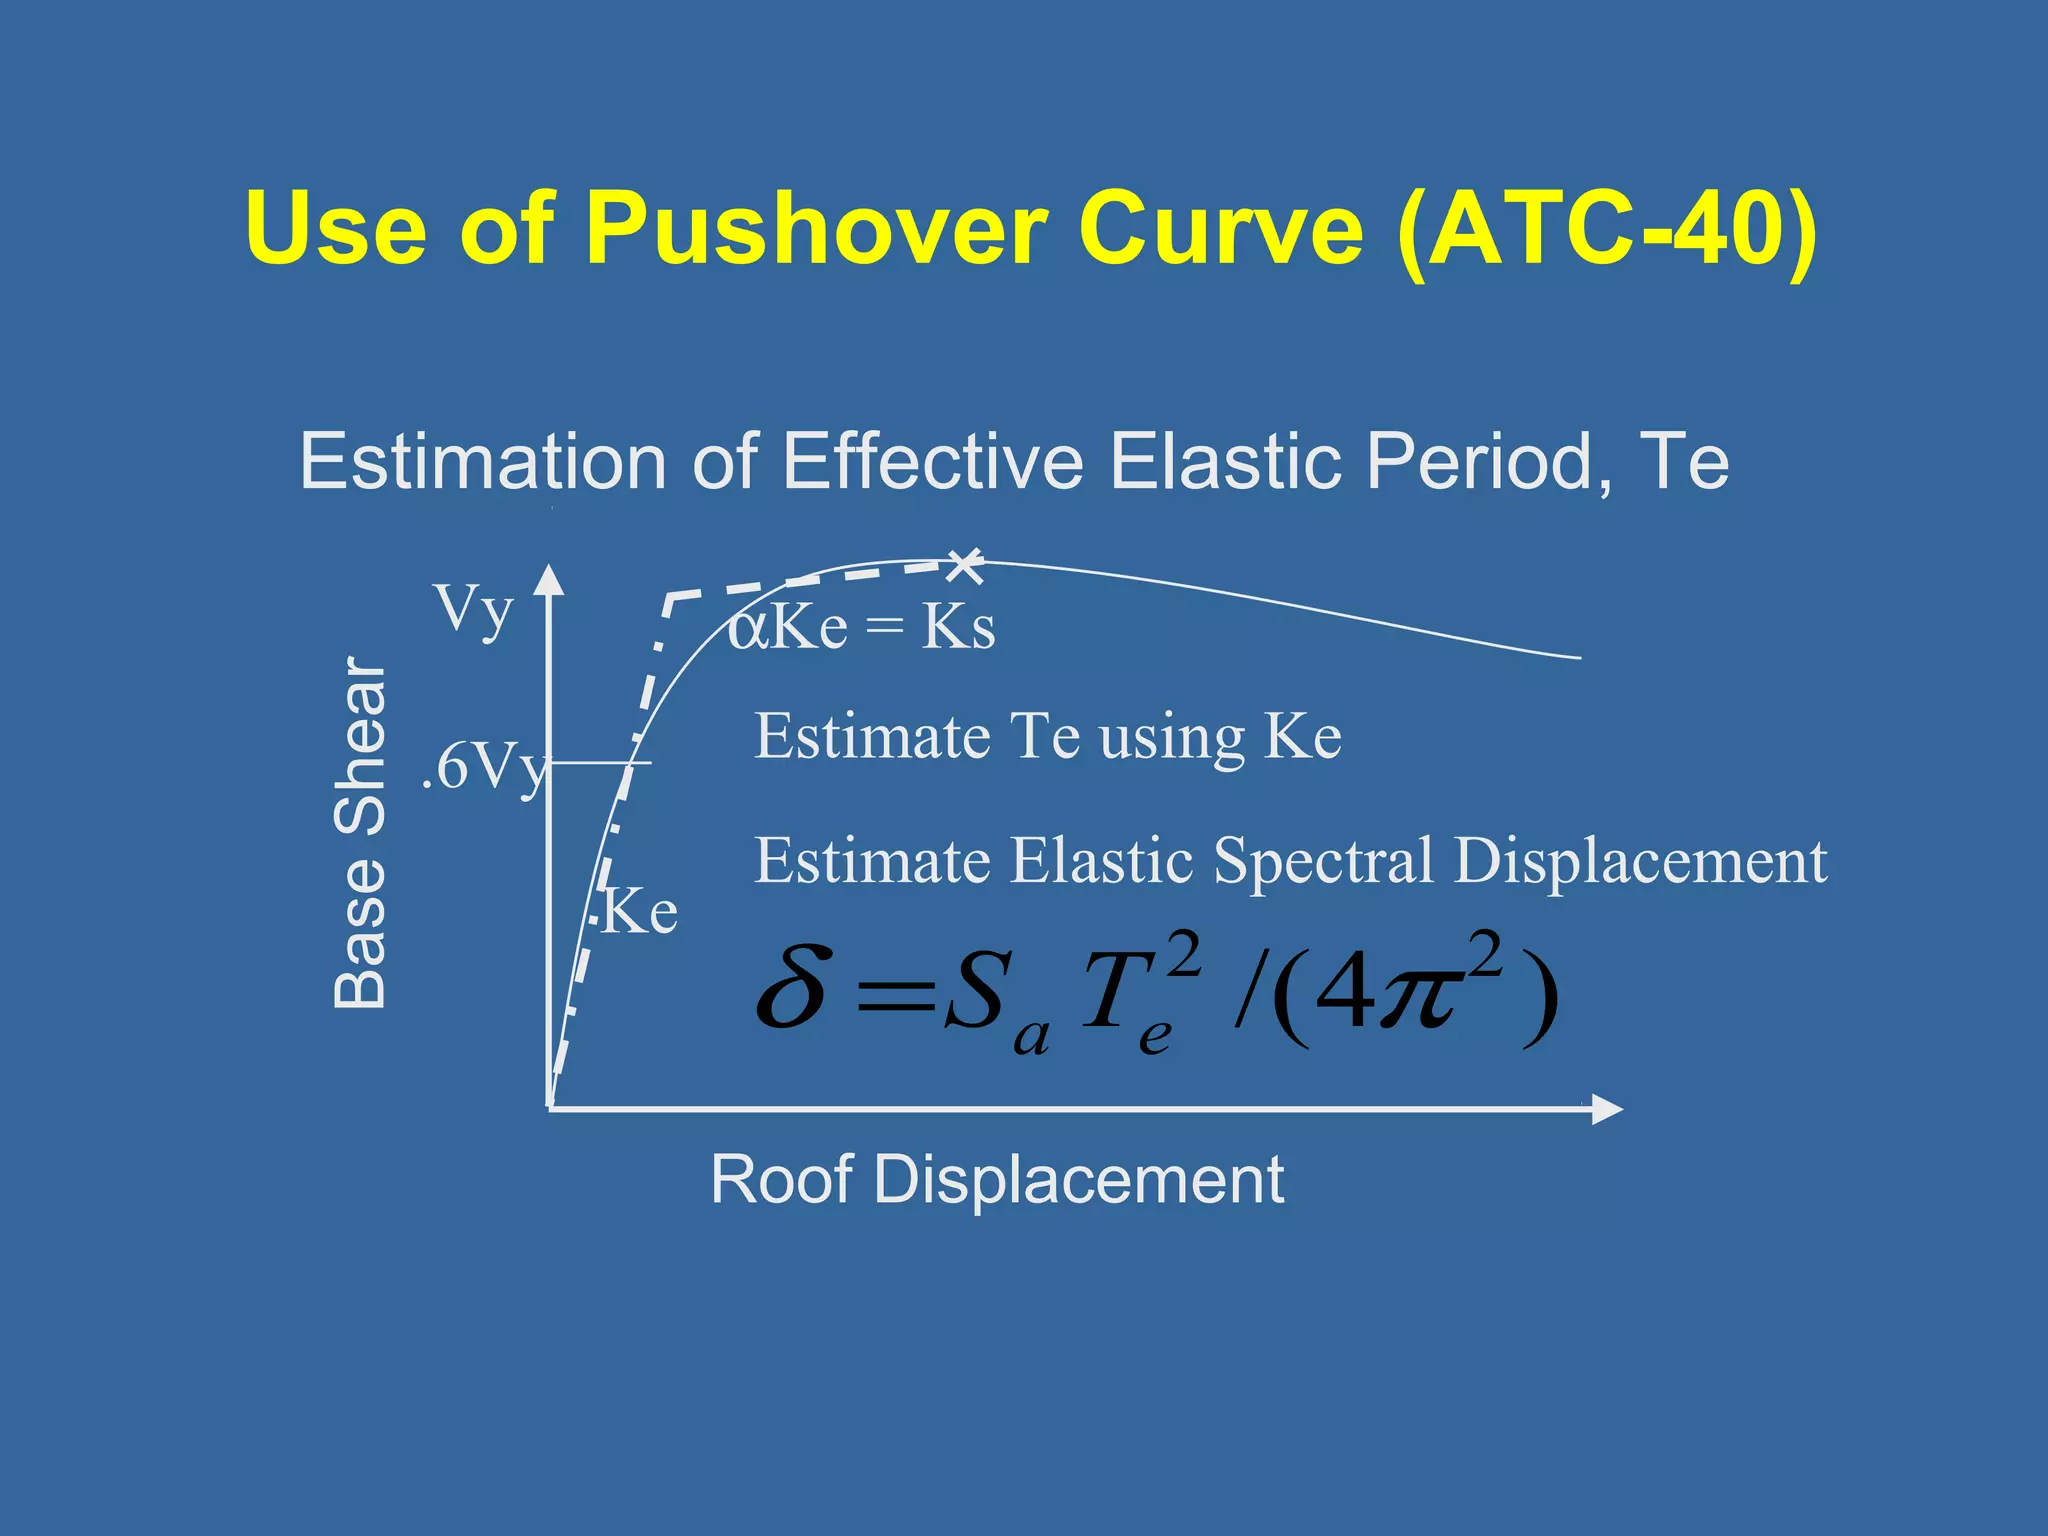
Use of PushoverCurve (ATC-40)
Estimation of Effective Elastic Period, Te
Vy
.6Vy
Base Shear Roof Displacement
Ke
aKe = Ks
Estimate Te using Ke
Estimate Elastic Spectral Displacement
d =Sa Te2 /(4p 2 )
44.
Use of PushoverCurve (FEMA-273)
Calculation of C0
Relates spectral to roof displacement
- use modal participation factor for control
node from first mode
- or use modal participation factor for
control node from deflected shape at the
target displacement
- or use tables based on number of stories
and varies from 1 to 1.5
45.
Use of PushoverCurve (FEMA-273)
Calculation of C1
Modifier for inelastic displacement
Spectral
Acceleration
C1 = [1 +(R-1)T0/Te]/R
C1 = 1
T0
Time Period
R is elastic strength
demand to yield
strength
46.
Use of PushoverCurve (FEMA-273)
Calculation of C2
Modifier for hysteresis loop shape
- from Tables
- depends on Framing Type
(degrading strength)
- depends on Performance Level
- depends on Effective Period
- varies from 1.0 to 1.5
47.
Use of PushoverCurve (FEMA-273)
Calculation of C3
Modifier for dynamic second order effects
C3 = 1 if post yield slope, a is positive
else
C3 = 1 +[ |a|(R-1)3/2 ]/Te
48.
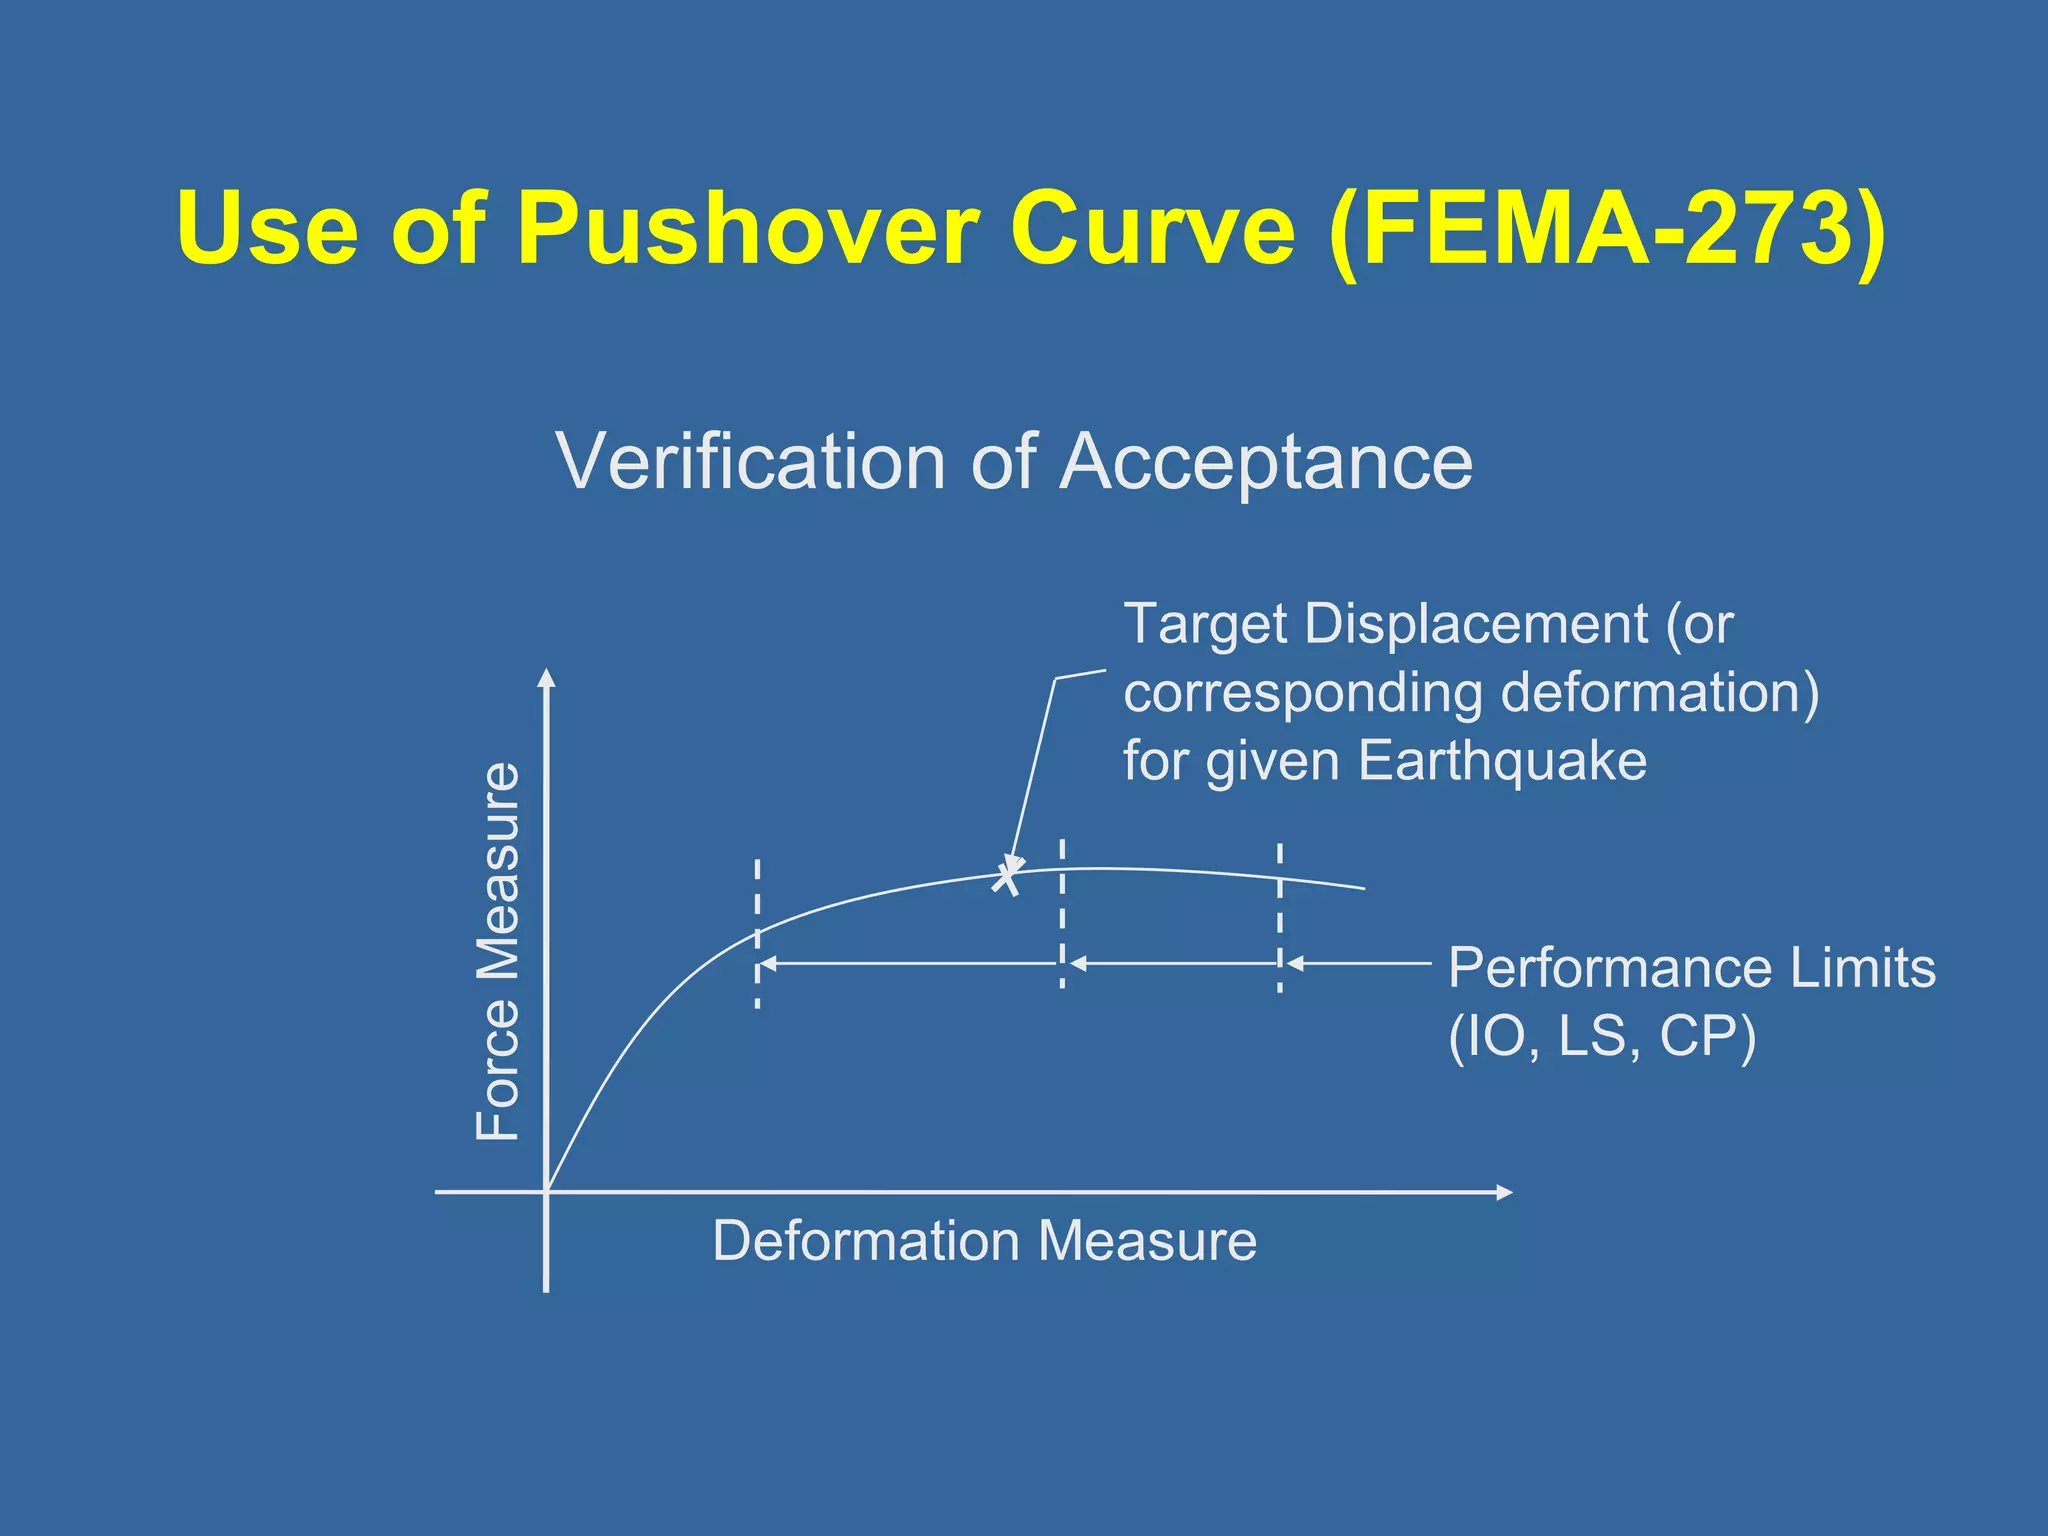
Use of PushoverCurve (FEMA-273)
Verification of Acceptance
Target Displacement (or
corresponding deformation)
for given Earthquake
Deformation Measure
Force Measure
Performance Limits
(IO, LS, CP)
49.
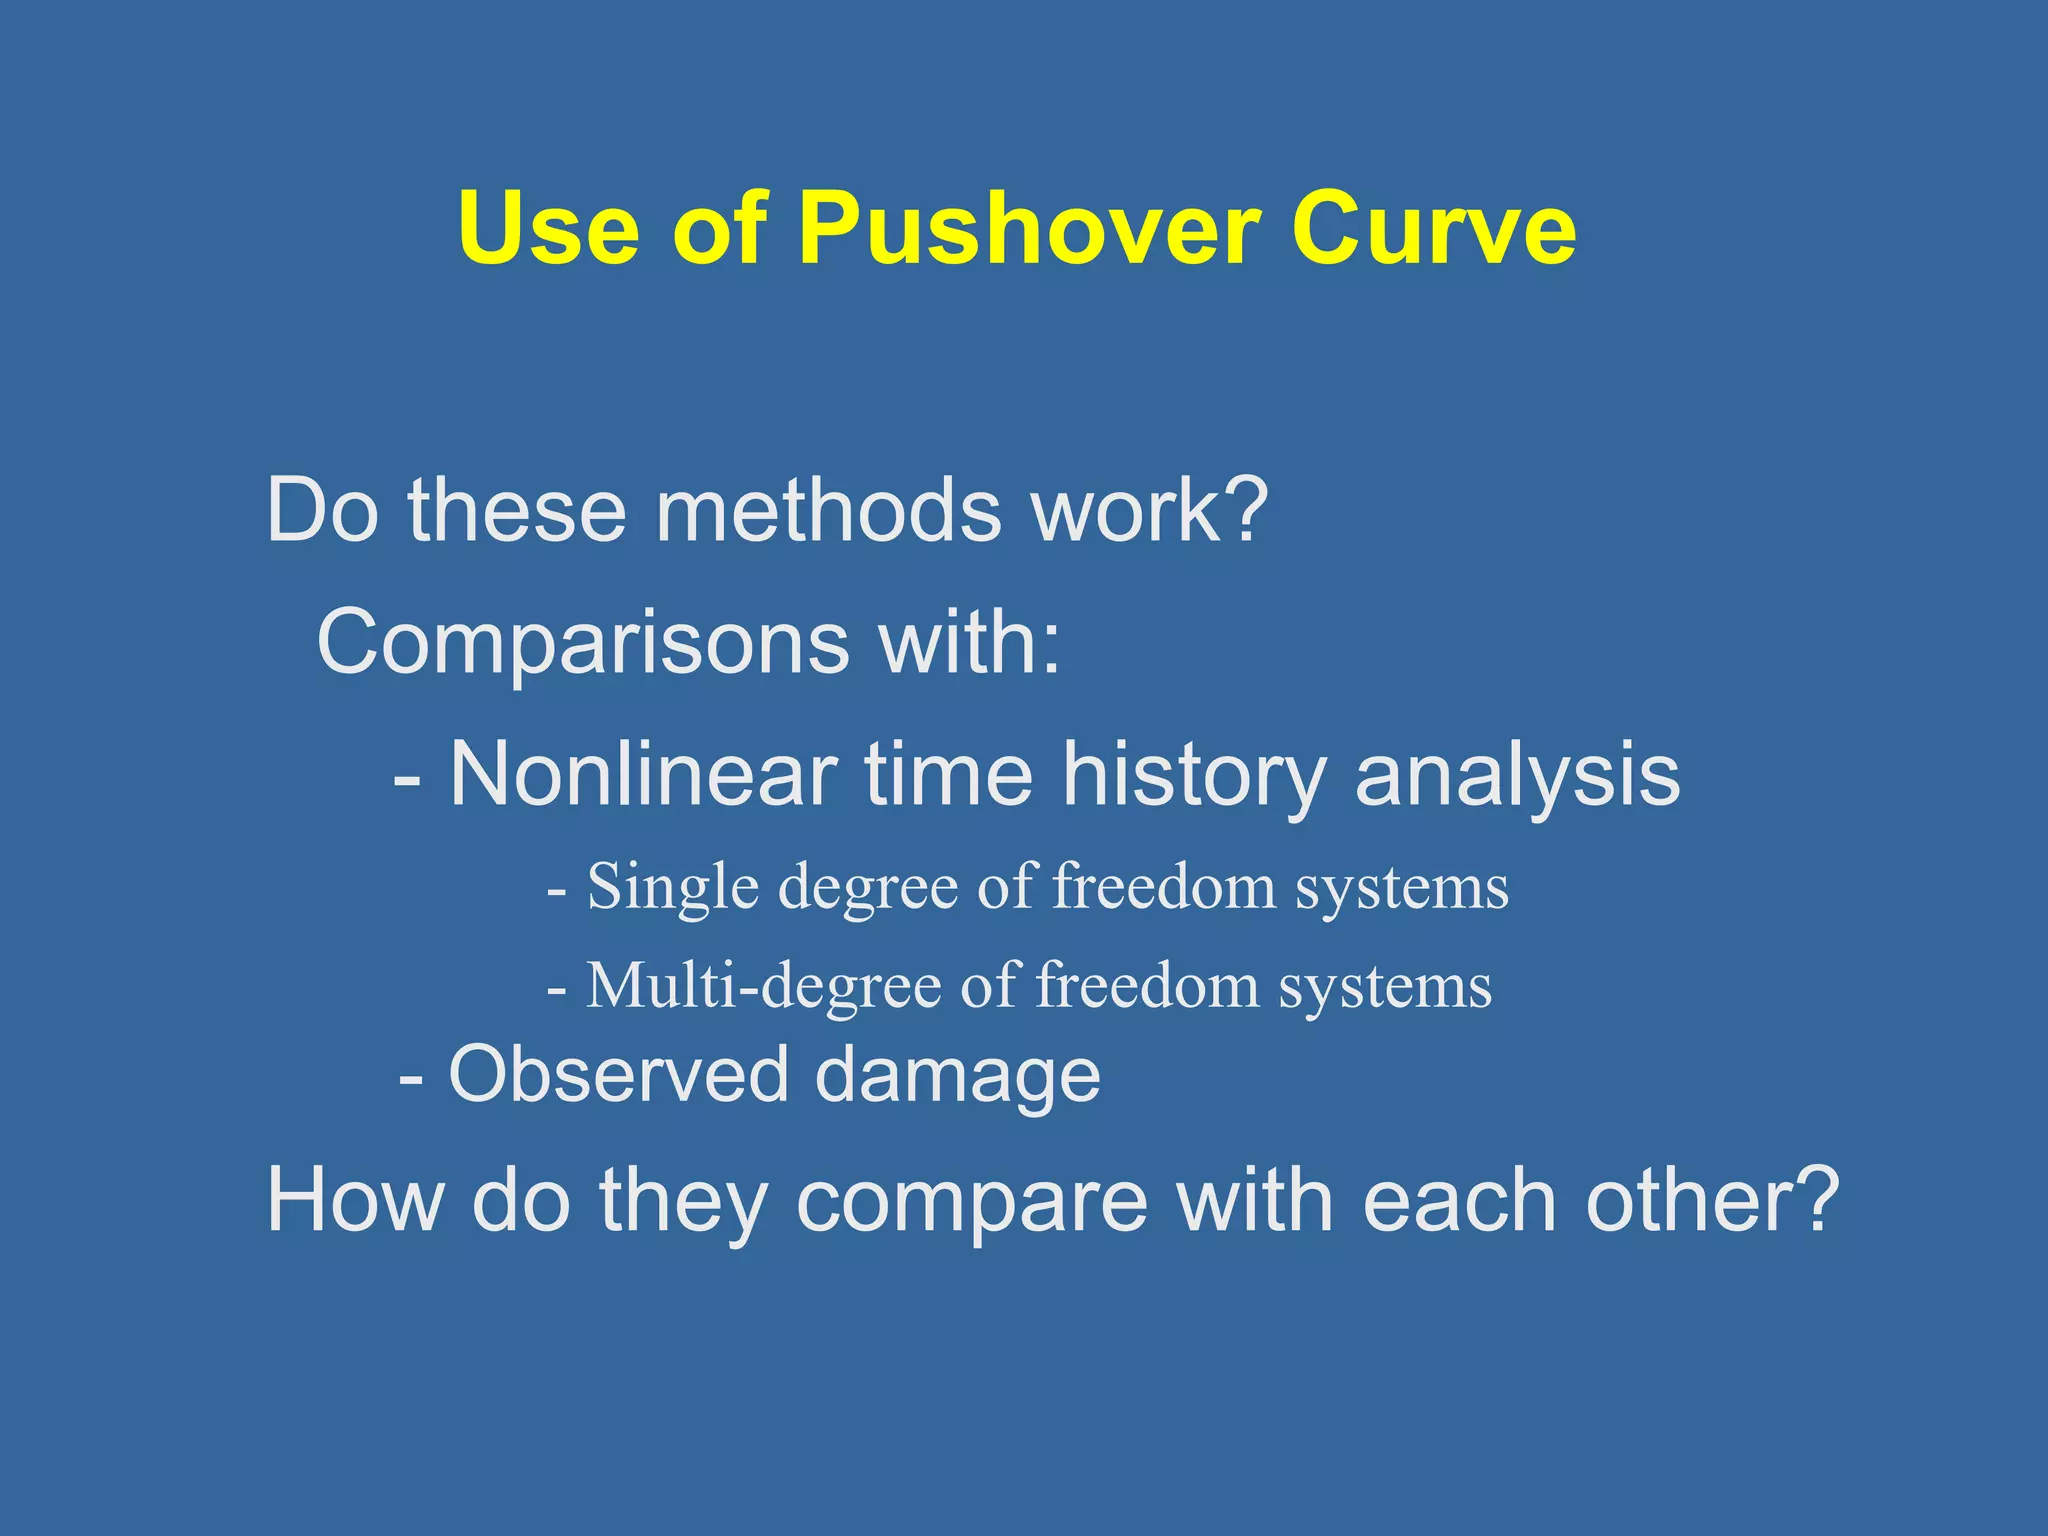
How do theycompare with each other?
- Observed damage
- Multi-degree of freedom systems
- Single degree of freedom systems
- Nonlinear time history analysis
Comparisons with:
Do these methods work?
Use of Pushover Curve
50.
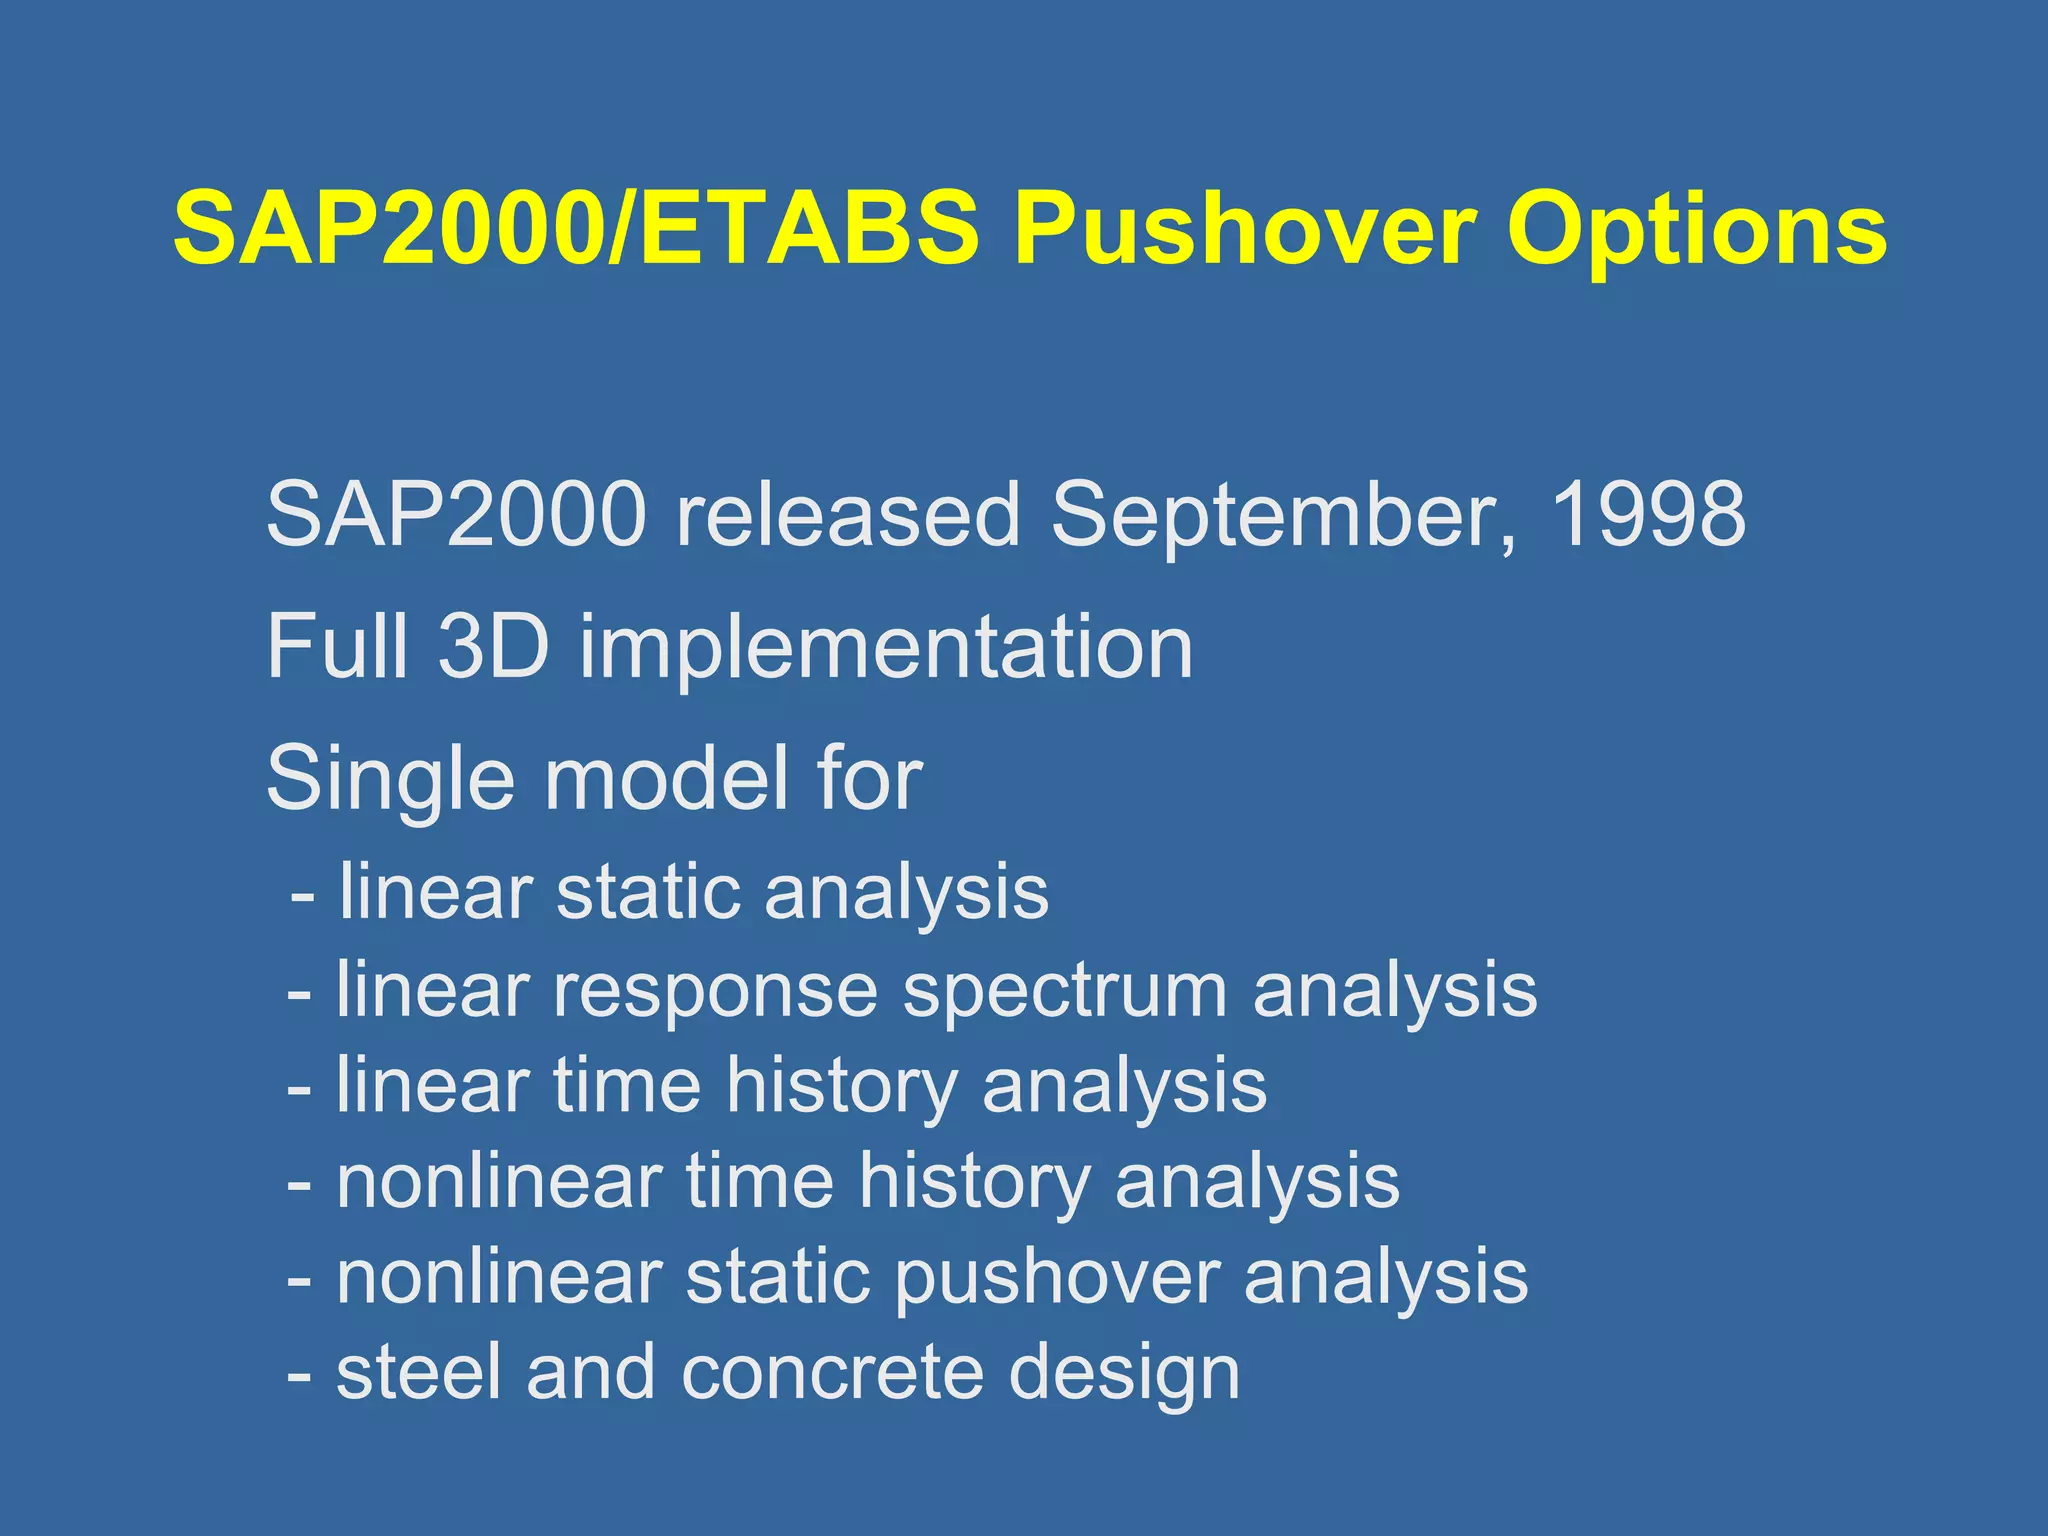
SAP2000/ETABS Pushover Options
SAP2000 released September, 1998
Full 3D implementation
Single model for
- linear static analysis
- linear response spectrum analysis
- linear time history analysis
- nonlinear time history analysis
- nonlinear static pushover analysis
- steel and concrete design
51.
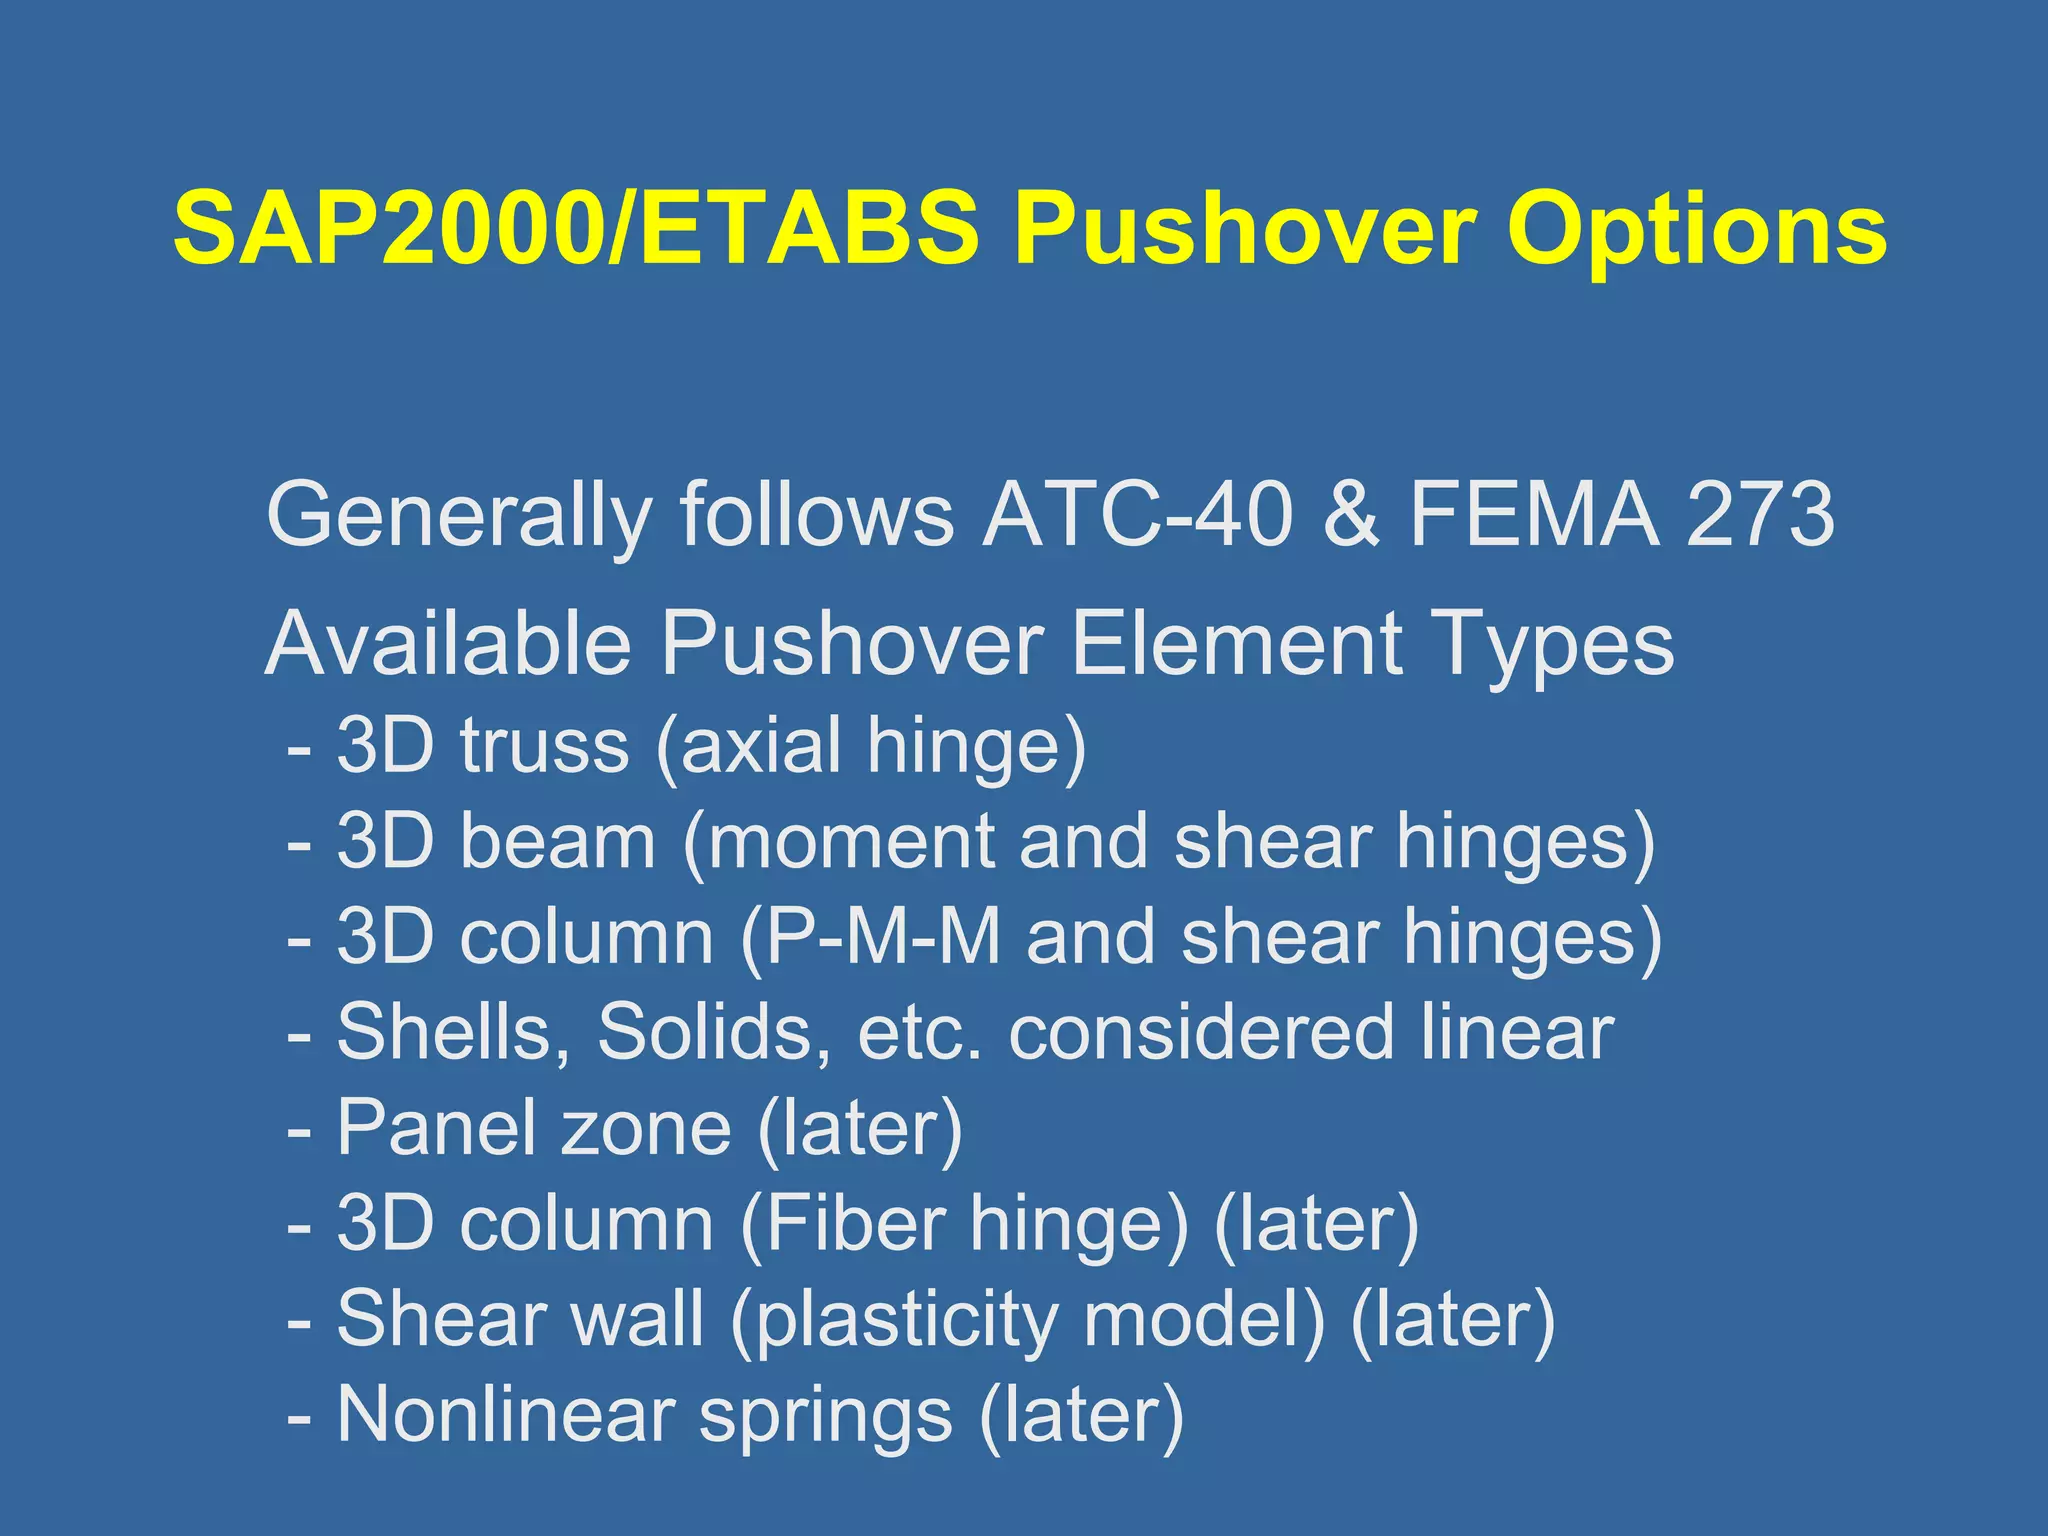
SAP2000/ETABS Pushover Options
Generally follows ATC-40 FEMA 273
Available Pushover Element Types
- 3D truss (axial hinge)
- 3D beam (moment and shear hinges)
- 3D column (P-M-M and shear hinges)
- Shells, Solids, etc. considered linear
- Panel zone (later)
- 3D column (Fiber hinge) (later)
- Shear wall (plasticity model) (later)
- Nonlinear springs (later)
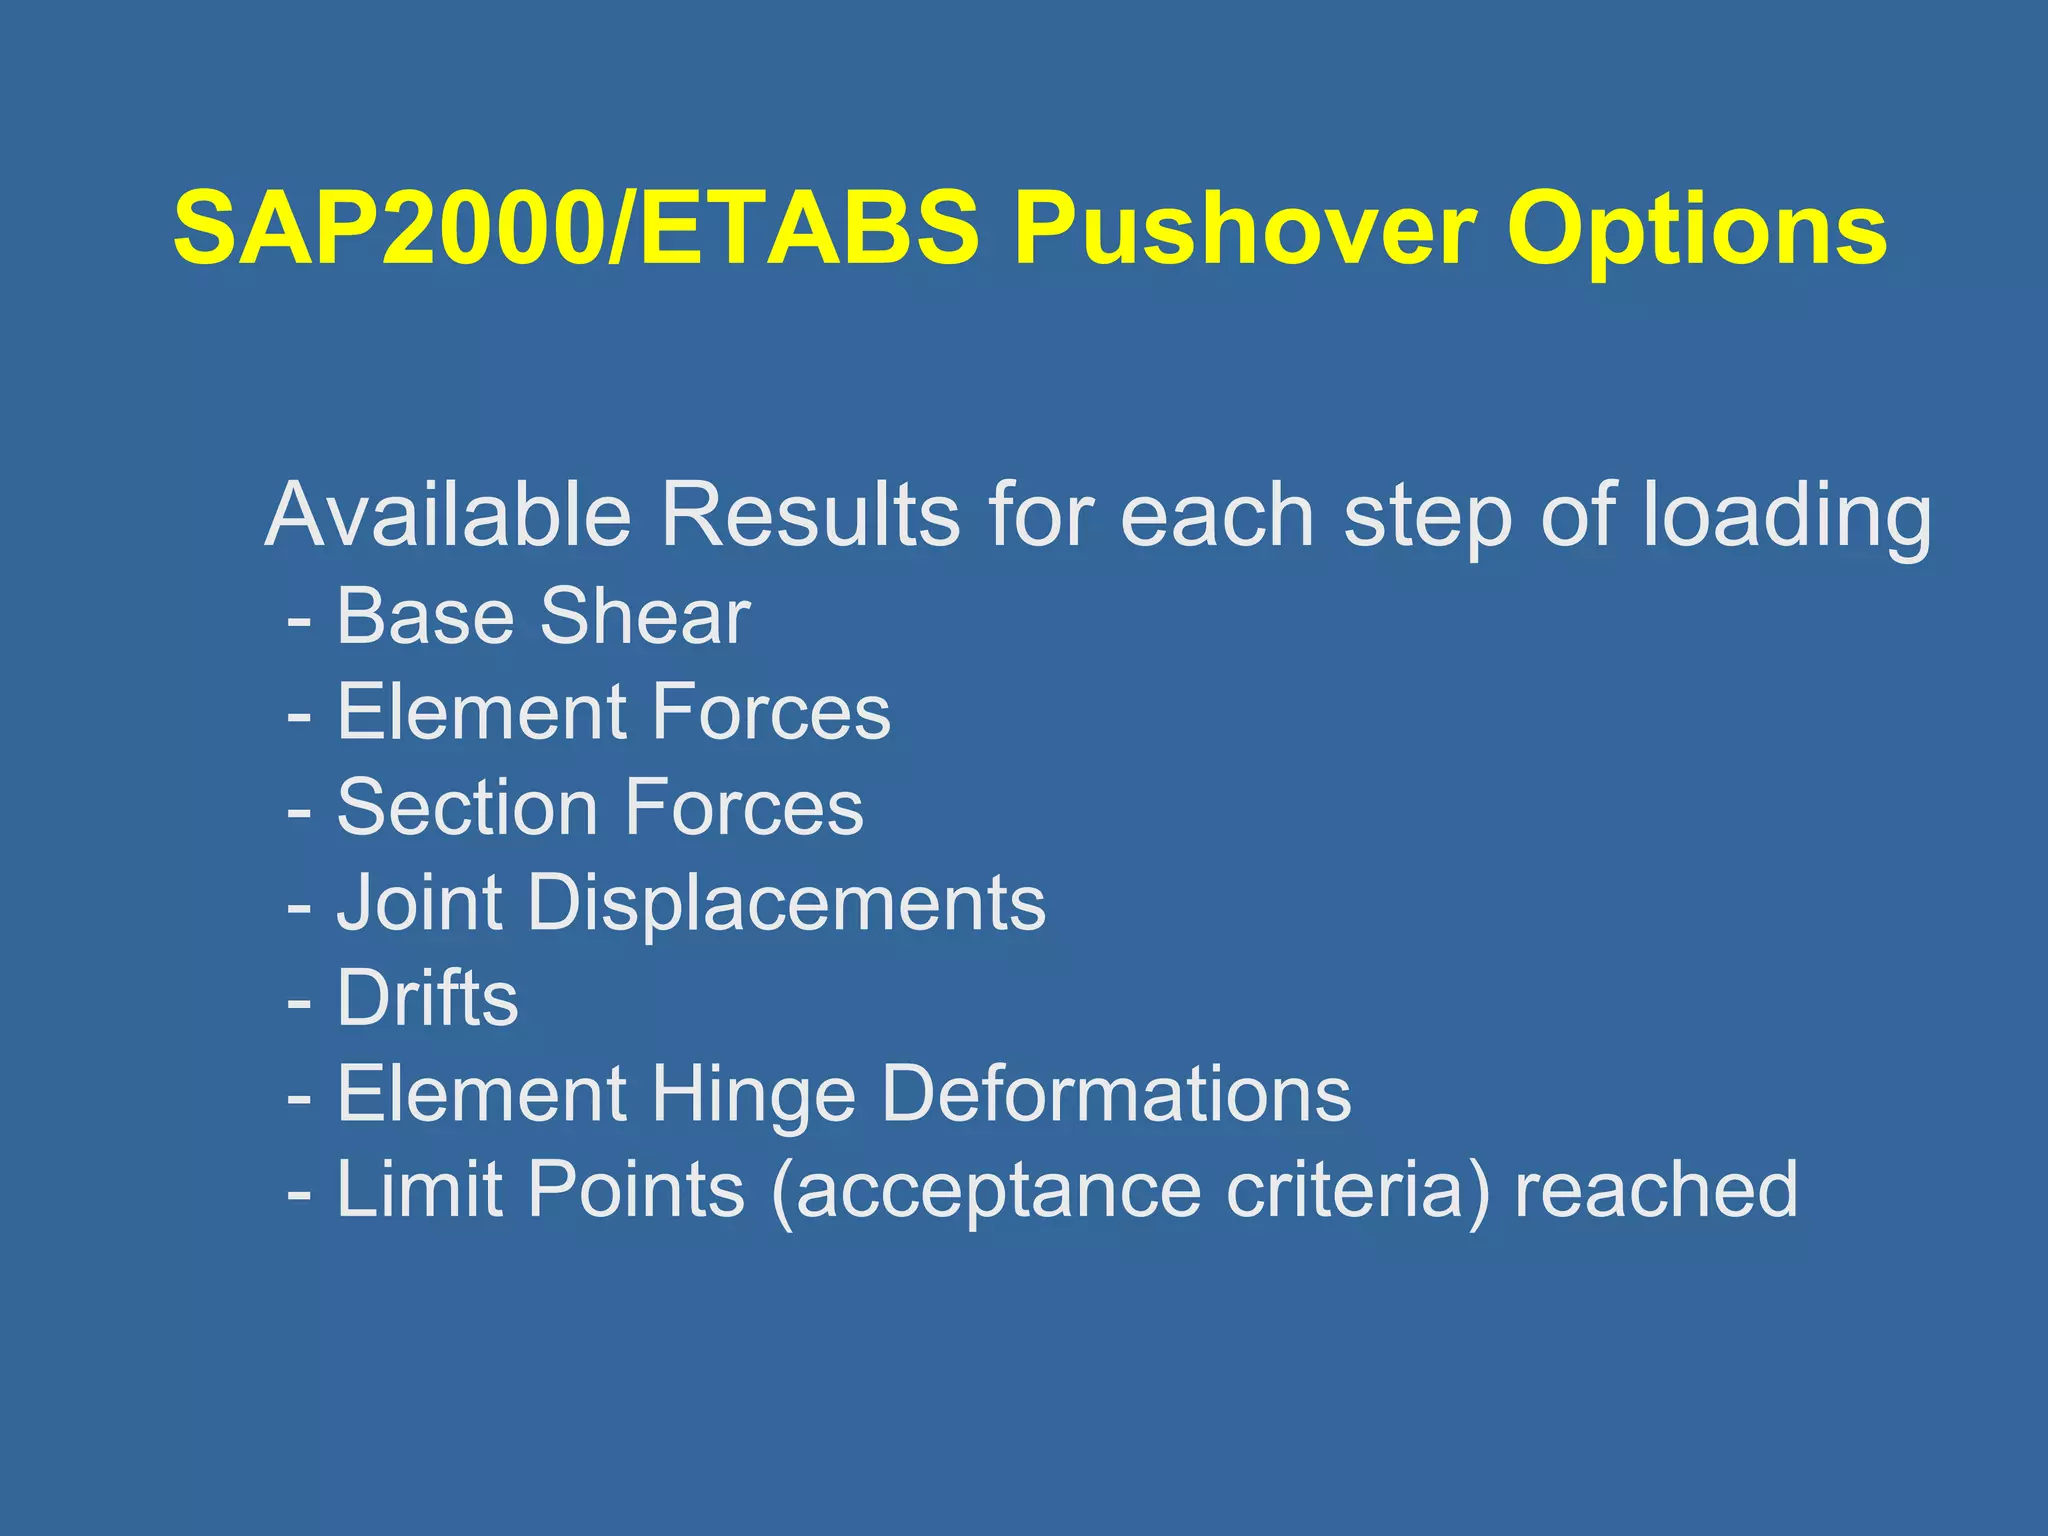
SAP2000/ETABS Pushover Options
Available Results for each step of loading
- Base Shear
- Element Forces
- Section Forces
- Joint Displacements
- Drifts
- Element Hinge Deformations
- Limit Points (acceptance criteria) reached
57.
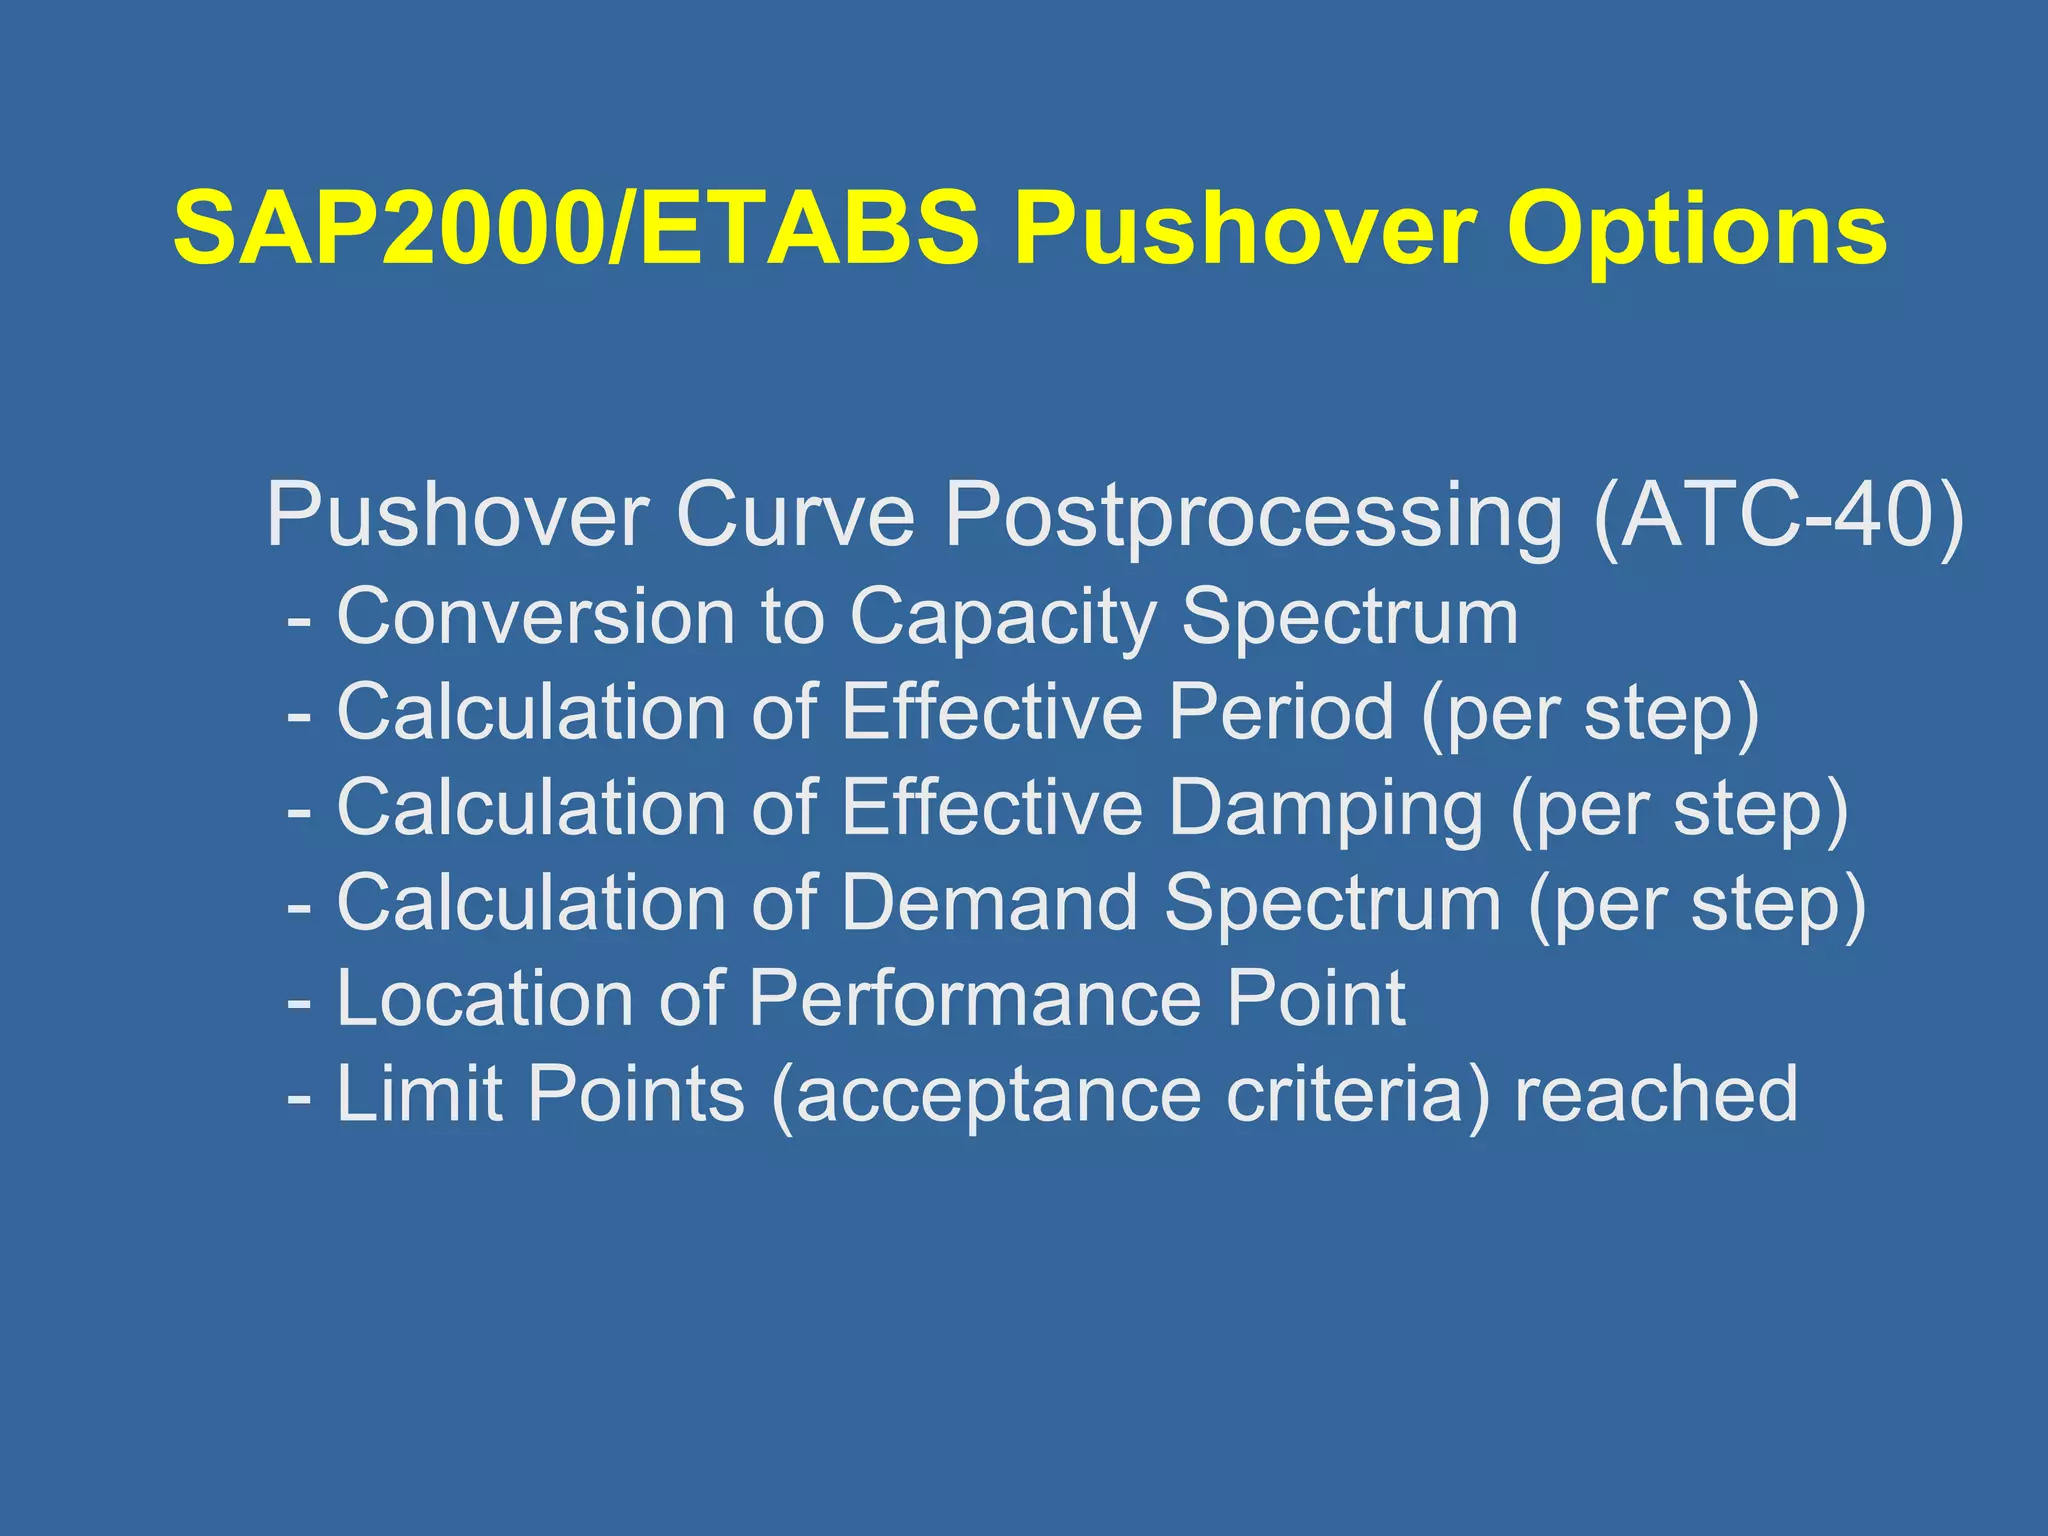
SAP2000/ETABS Pushover Options
Pushover Curve Postprocessing (ATC-40)
- Conversion to Capacity Spectrum
- Calculation of Effective Period (per step)
- Calculation of Effective Damping (per step)
- Calculation of Demand Spectrum (per step)
- Location of Performance Point
- Limit Points (acceptance criteria) reached
58.
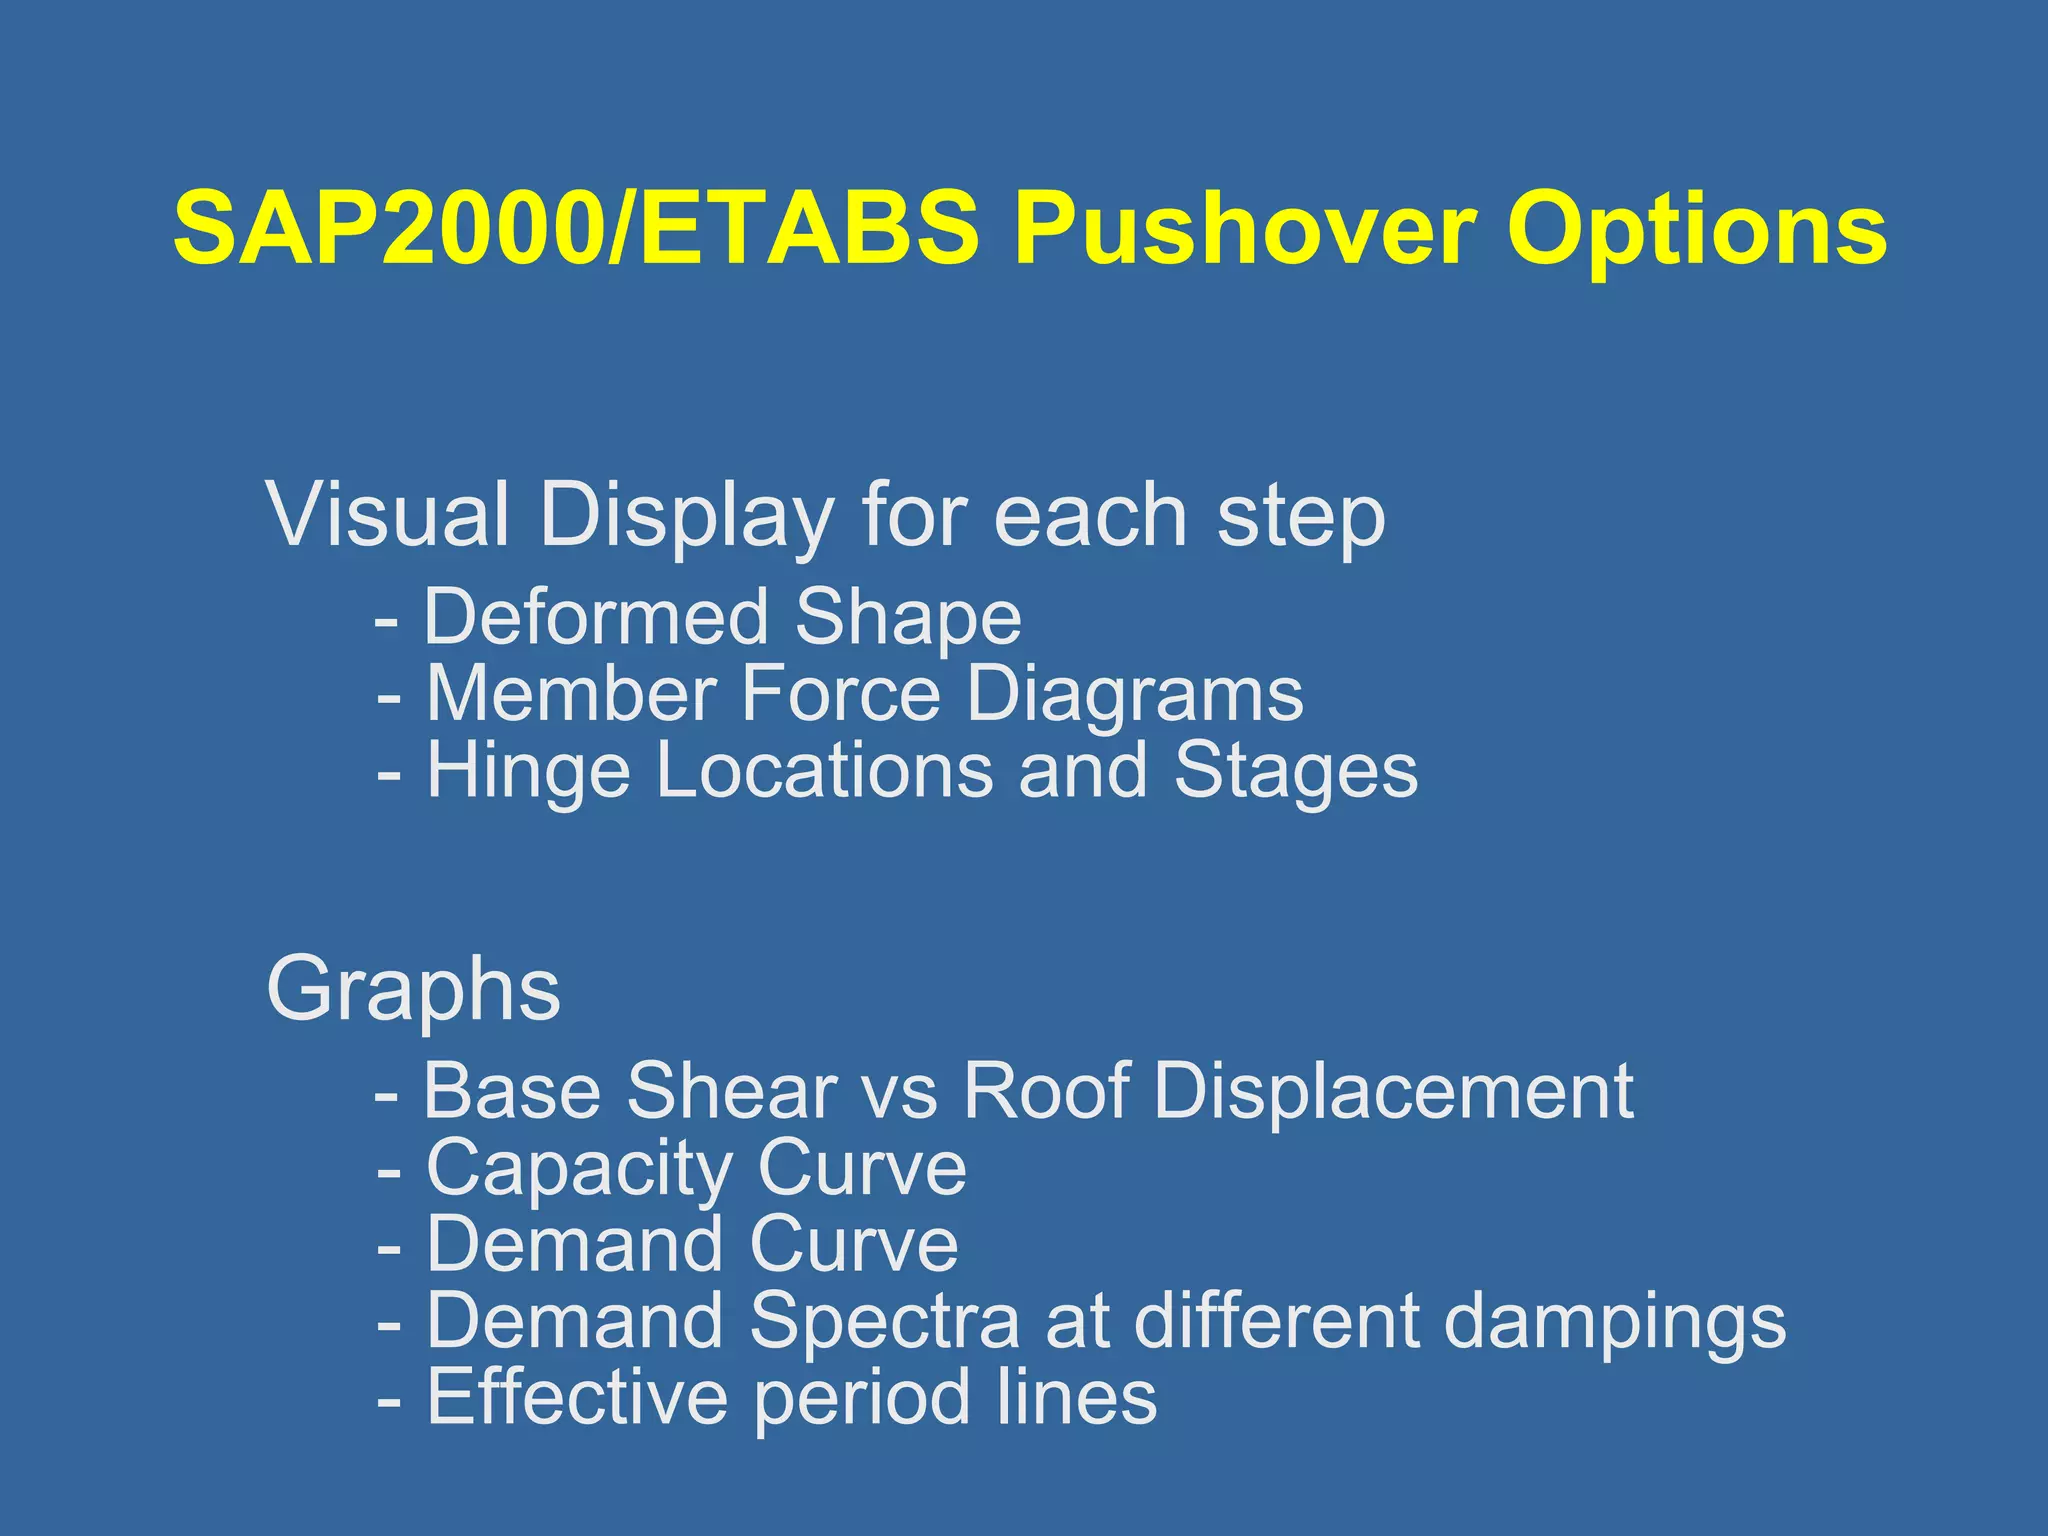
SAP2000/ETABS Pushover Options
Visual Display for each step
- Deformed Shape
- Member Force Diagrams
- Hinge Locations and Stages
Graphs
- Base Shear vs Roof Displacement
- Capacity Curve
- Demand Curve
- Demand Spectra at different dampings
- Effective period lines

![Use of Pushover Curve (FEMA-273)
Calculation of C1
Modifier for inelastic displacement
Spectral
Acceleration
C1 = [1 +(R-1)T0/Te]/R
C1 = 1
T0
Time Period
R is elastic strength
demand to yield
strength](https://image.slidesharecdn.com/1223989staticpushoveranalysis-141129050636-conversion-gate01/75/1223989-static-pushover-analysis-45-2048.jpg)
![Use of Pushover Curve (FEMA-273)
Calculation of C3
Modifier for dynamic second order effects
C3 = 1 if post yield slope, a is positive
else
C3 = 1 +[ |a|(R-1)3/2 ]/Te](https://image.slidesharecdn.com/1223989staticpushoveranalysis-141129050636-conversion-gate01/75/1223989-static-pushover-analysis-47-2048.jpg)