Download to read offline
![International Research Journal of Engineering and Technology (IRJET) e-ISSN: 2395-0056
Volume: 09 Issue: 10 | Oct 2022 www.irjet.net p-ISSN: 2395-0072
© 2022, IRJET | Impact Factor value: 7.529 | ISO 9001:2008 Certified Journal | Page 822
induced forces from previous records and also resist the
lateral loads which are done using the ETABS software.
REFERENCES
[1] IS 1893 (part 1): (2002), “Criteria for Earthquake
Resistant Design of Structures Part General Provisions and
Buildings”, Bureau of Indian Standards.
[2] CSI Computers and Structures INC. “Introductory
Tutorial for ETABS: Linear and Nonlinear Static and
Dynamic Analysis and Design of Three-Dimensional
Structures” 2011.
[3] B.C. Punmia, A.K. Jain, 2006, R.C.C Designs”, Laxmi
Publications New Delhi.
[4] IS-456 2000 plain and reinforced concrete code of
practice.
[5] P.Agarwal, M.Shrinkhande, earthquake resistance
design of structures, PHI learning Pvt. 2012.
[6] Pardeshi Sameer, Prof. N. G. Gore (2016), “Study of
seismic analysis and design of multi storey symmetrical
and asymmetrical building “Volume: 03 Issue: 01.
[7] Ali Kadhim Sallal (2018) “Design and analysis ten
storied building using ETABS software-2016” Volume 4;
Issue 2; May 2018; Page No. 21-27
[8] Pushkar Rathod, Rahul Chandrashekar “seismic
analysis of multistoried building for different plans using
ETABS 2015” Volume: 04 Issue: 10 | Oct -2017
[9] S. Vijaya Bhaskar Reddy, Jagath Chandra. P, Srinivas
Vasam, P Srinivasa Rao “Analysis Of Multistoried
Structures Using ETABS” Vol. 3, Issue 1, pp: (151-158),
Month: April 2015 - September 2015,](https://image.slidesharecdn.com/irjet-v9i10131-221110080810-d9281278/75/Response-Spectrum-and-Time-History-Analysis-of-a-Multistorey-Building-4-2048.jpg)

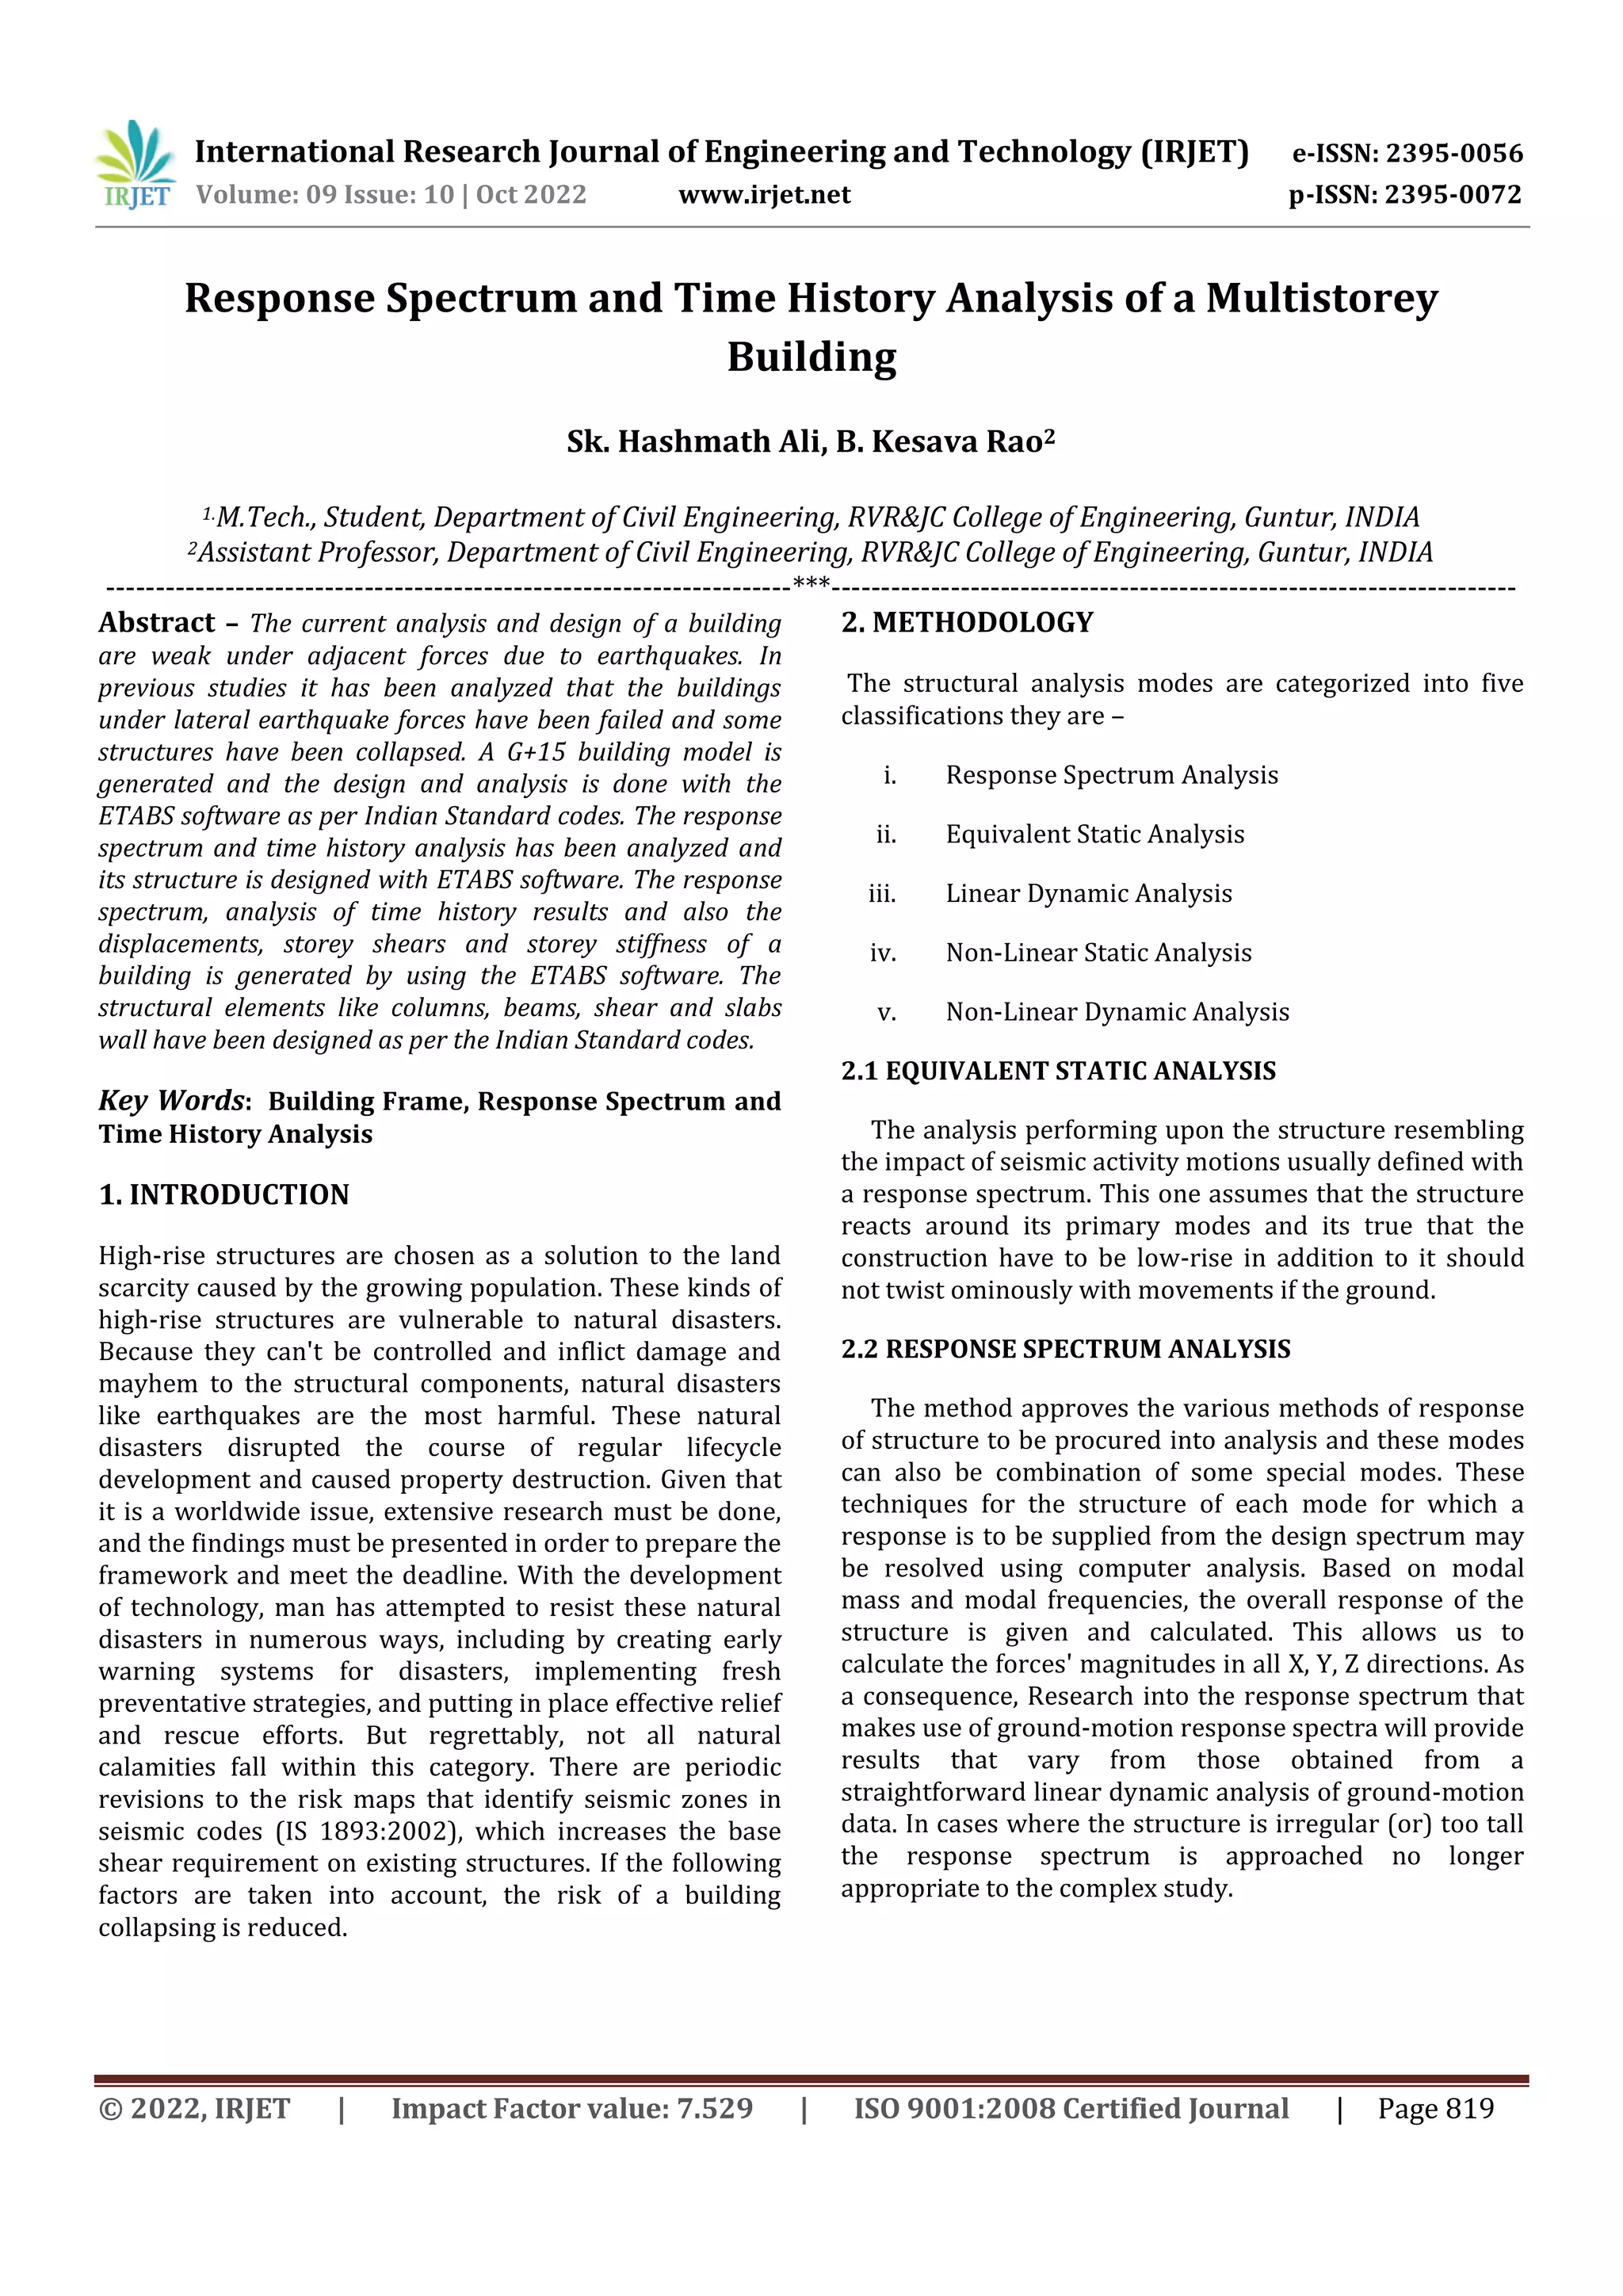
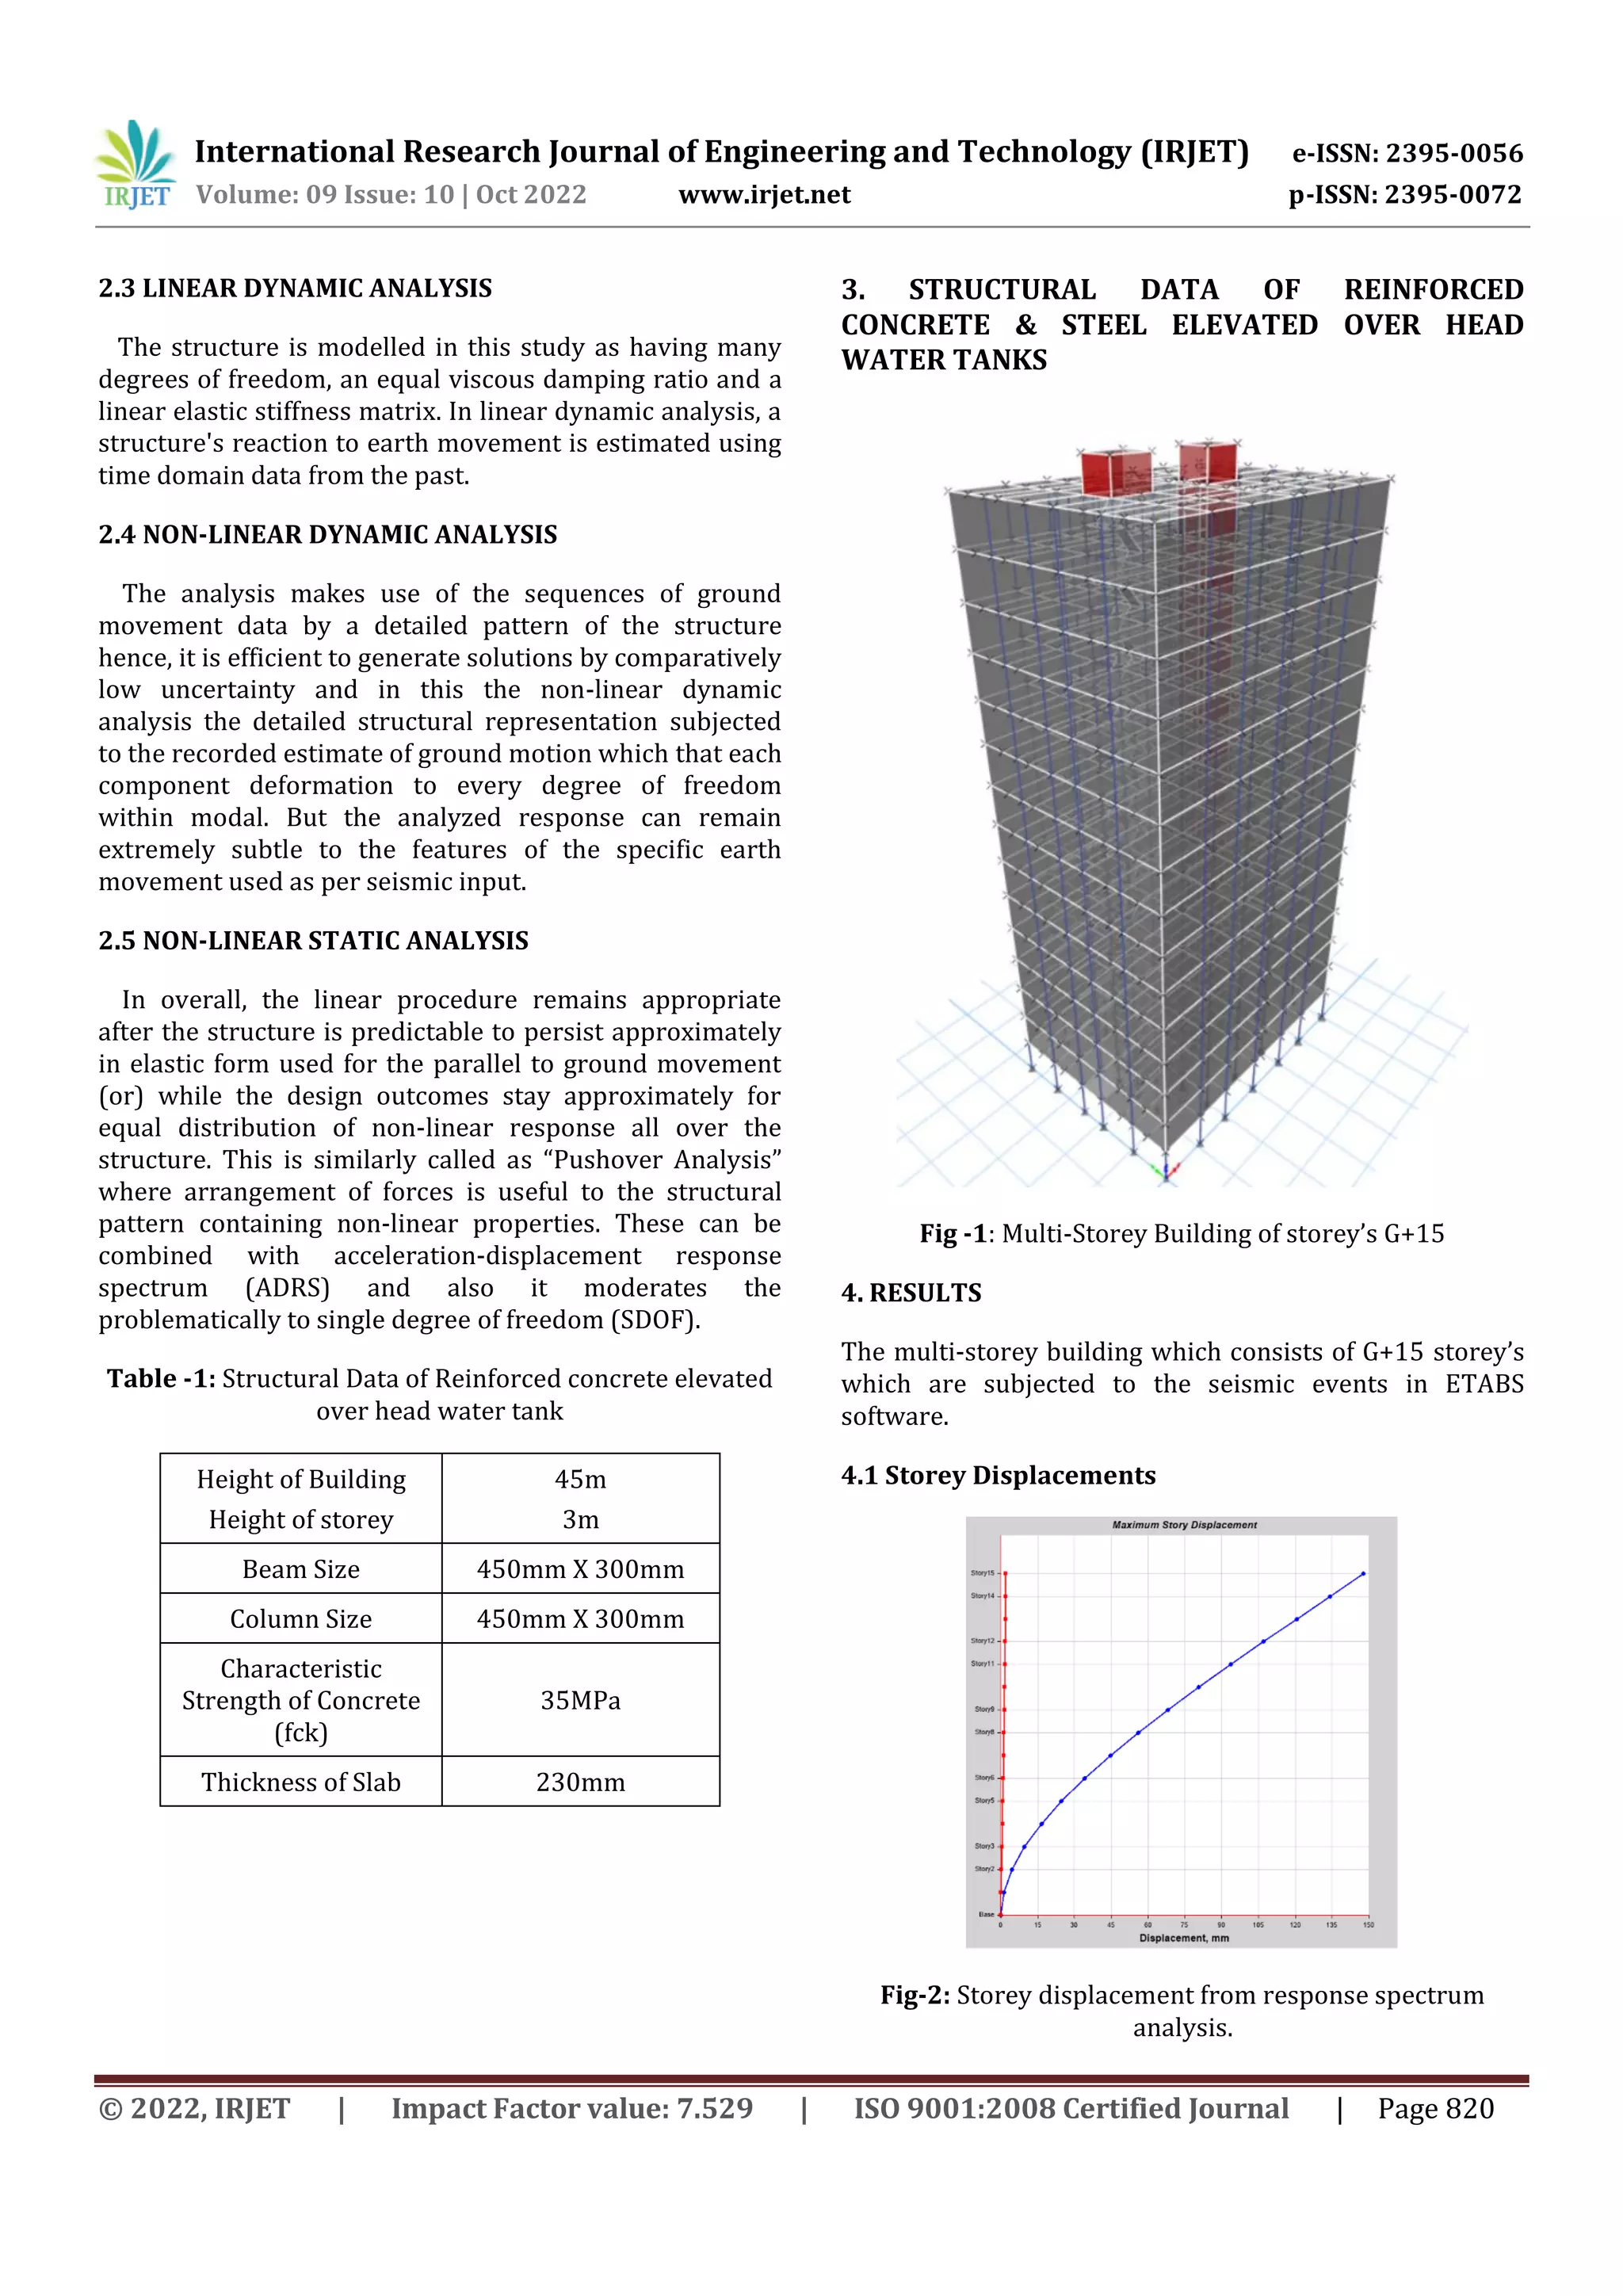
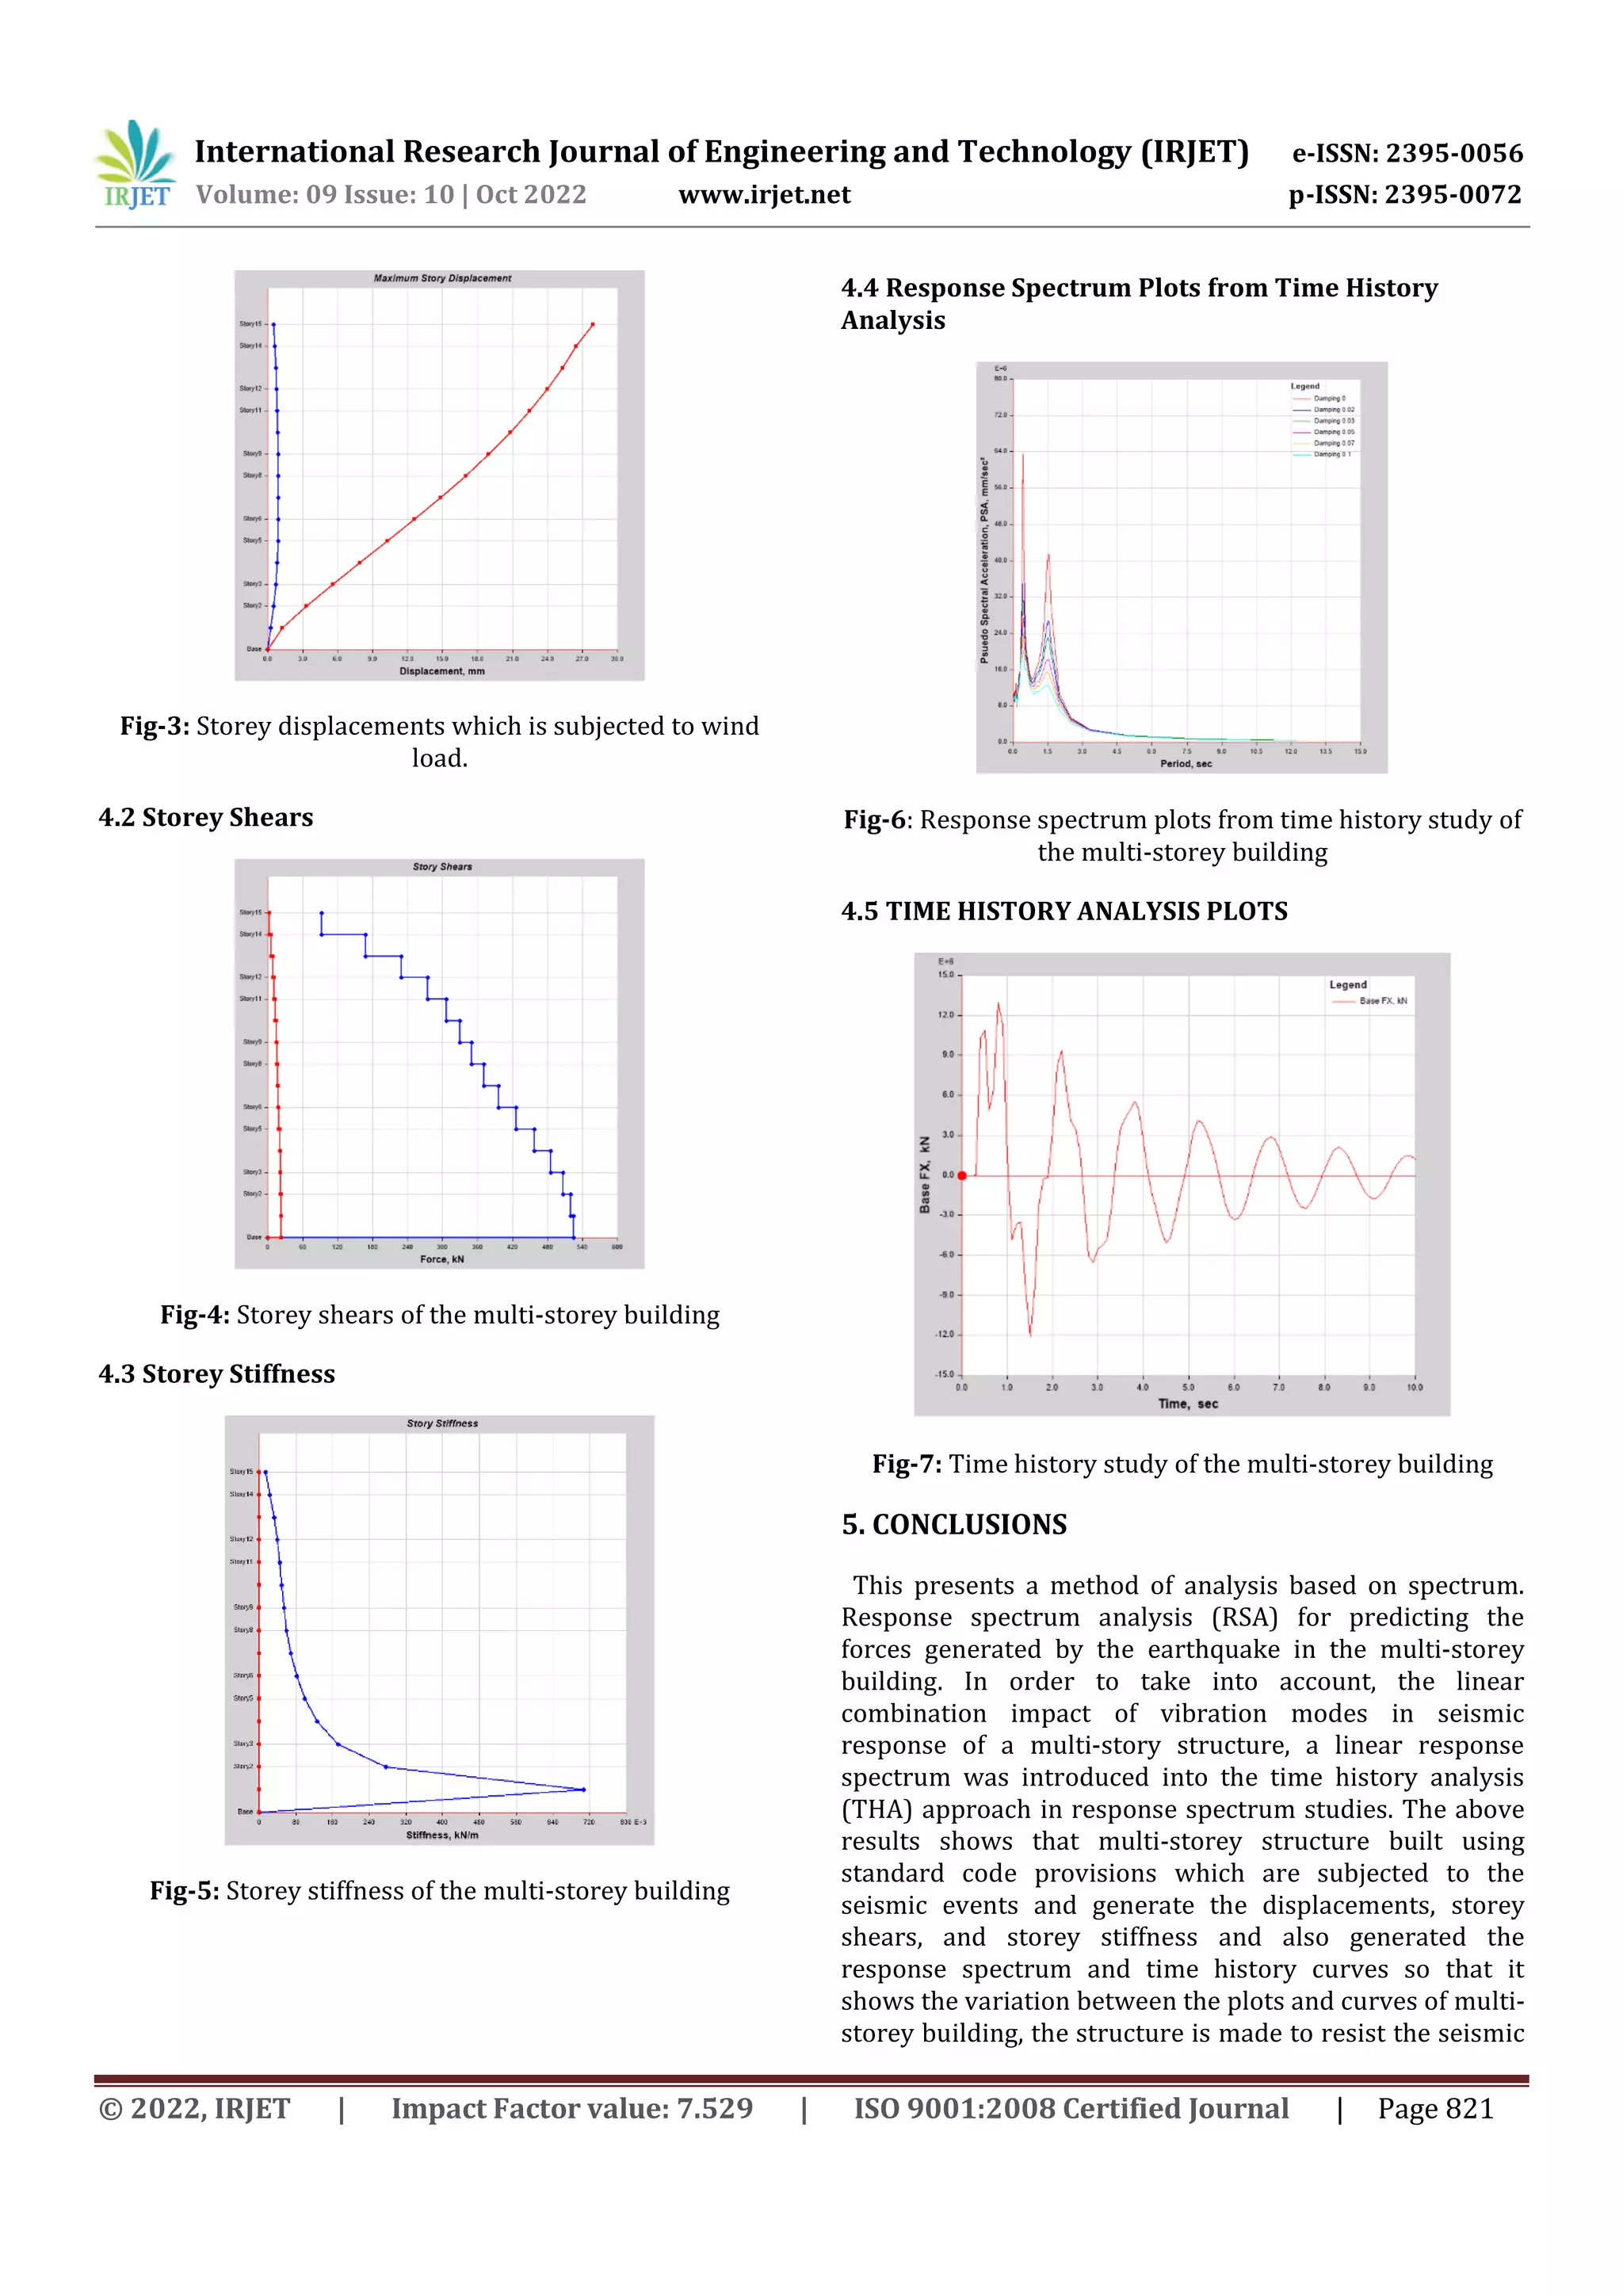
This document summarizes a study that analyzed the response spectrum and time history analysis of a 15-story building model using ETABS software. The building was subjected to seismic analysis to determine displacements, storey shears, and stiffness under earthquake forces. Both response spectrum analysis and time history analysis were conducted. The response spectrum analysis produced plots of storey displacement, storey shear, and storey stiffness. The time history analysis generated response spectrum plots and time history plots showing the variation in results between the two analysis methods. The study concluded the multi-story building designed to code was able to resist seismic forces based on the analysis results.


