Downloaded 709 times
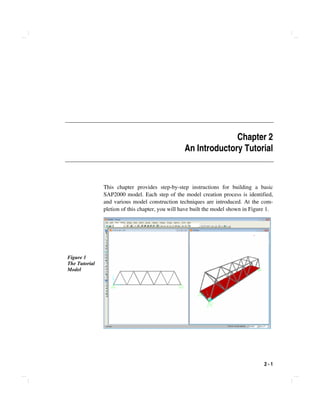

This document provides an introductory tutorial for building a model in SAP2000. It describes building a model of a five panel sloped truss bridge that is 60 feet long. The tutorial walks through defining materials, drawing frame and area objects, adding loads and restraints, running analyses, and reviewing results. It introduces the basic tools and functions in SAP2000 for constructing models and performing common modeling tasks.


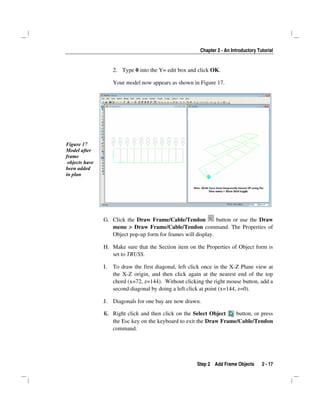
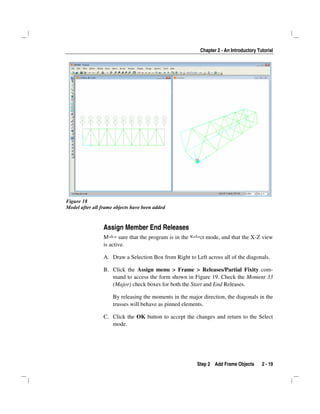
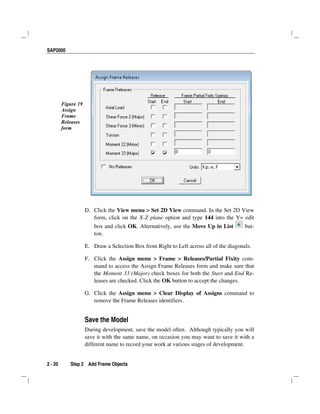
![[Deck] What's New in Spark-Iceberg Integration via DSV2.pptx](https://cdn.slidesharecdn.com/ss_thumbnails/deckwhatsnewinspark-icebergintegrationviadsv2-260210005337-25955b12-thumbnail.jpg?width=640&height=640&fit=bounds)


