Download as PDF, PPTX


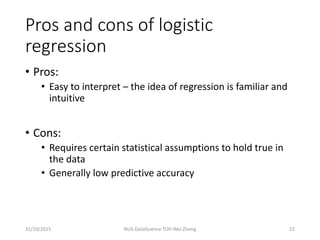


The document provides an introduction to data analytics using R given by Wei Zhong from NUS. It begins with an overview of Wei Zhong and his background in computational biology. The agenda is then outlined, covering key concepts in data analytics like logistic regression, decision trees, random forests, and evaluation metrics. An overview of data analytics is presented, distinguishing descriptive, predictive, and prescriptive analytics. Statistical learning techniques like linear models, tree-based models, and clustering are introduced. Key concepts like cross-validation that will be used in the hands-on session are then defined.