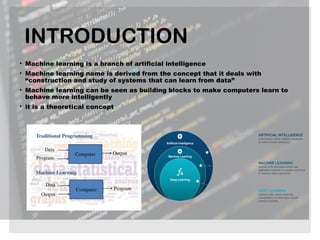
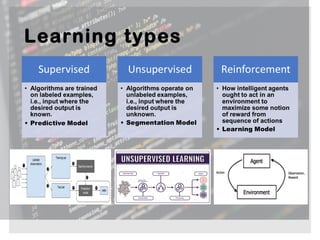
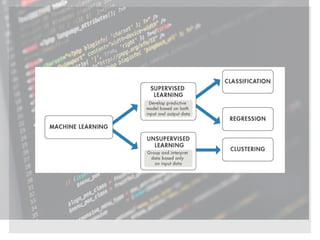
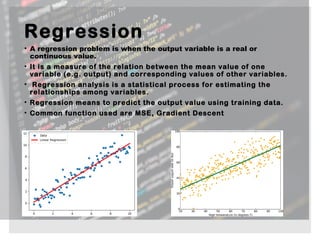
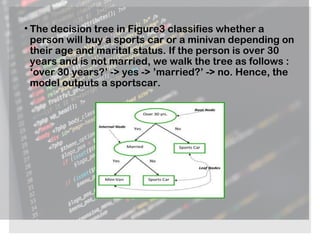
Machine Learning
By: Dhananjay Birmole
INTRODUCTION
• Machine learning is a branch of artificial intelligence
• Machine learning name is derived from the concept that it deals with
“construction and study of systems that can learn from data”
• Machine learning can be seen as building blocks to make computers learn to
behave more intelligently
• it is a theoretical concept
Learning types
Regression
• A regression problem is when the output variable is a real or
continuous value.
• It is a measure of the relation between the mean value of one
variable (e.g. output) and corresponding values of other variables.
• Regression analysis is a statistical process for estimating the
relationships among variables.
• Regression means to predict the output value using training data.
• Common function used are MSE, Gradient Descent
Classification
• A classification problem is when the output variable is a category,
such as “red” or “blue” or “disease” and “no disease”.
• Classification is technique to categorize our data into a desired and
distinct number of classes where we can assign label to each class.
• Classification means to divide the output using training data.
• Works on discrete values
• Common function used are Bayer classifier, Support Vector Machine
Classification vs
Regression• Classification means to group
the output into a class.
• Classification to predict the
type of tumor i.e. harmful or not
harmful using training data
• If it is discrete/categorical
variable, then it is classification
problem
• Regression means to predict the
output value using training
data.
• Regression to predict the house
price from training data
• If it is a real
number/continuous, then it is
regression problem.
Clustering
• An unsupervised learning method is a method in which we
draw references from datasets consisting of input data
without labeled responses.
• It is used as a process to find meaningful structure,
explanatory underlying processes, generative features, and
groupings inherent in a set of examples.
• It is basically a collection of objects on the basis of similarity and
dissimilarity between them.
• Common function used is K-mean
Decision Tree Learning
•Decision tree learning uses a
decision tree as a predictive model
which maps observations about an
item to conclusions about the item's
target value.
•To classify a new instance, we start
at the root and traverse the tree to
reach a leaf; at an internal node we
evaluate the predicate(or function)
on the data instance, to find which
child to go. The process continues
till we reach a leaf node 
• The decision tree in Figure3 classifies whether a
person will buy a sports car or a minivan depending on
their age and marital status. If the person is over 30
years and is not married, we walk the tree as follows :
‘over 30 years?’ -> yes -> ’married?’ -> no. Hence, the
model outputs a sportscar.
Random Forest
•Random Forest is a trademark term for an
ensemble of decision trees. In Random
Forest, we’ve collection of decision trees
(so known as “Forest”). To classify a new
object based on attributes, each tree
gives a classification and we say the tree
“votes” for that class. The forest chooses
the classification having the most votes
(over all the trees in the forest).
•Each tree is planted & grown as follows:
•If the number of cases in the training set
is N, then sample of N cases is taken at
random but with replacement. This
sample will be the training set for
growing the tree.
•If there are M input variables, a number
m<<M is specified such that at each node,
m variables are selected at random out of
the M and the best split on these m is
used to split the node. The value of m is
held constant during the forest growing.
•Each tree is grown to the largest extent
possible. There is no pruning.
True vs. False and Positive
vs. Negative
•The Boy Who Cried Wolf example
•"Wolf" is a positive class.
•"No wolf" is a negative class.
•We can summarize our "wolf-prediction" model
using a 2x2 confusion matrix that depicts all four
possible outcomes:
•A true positive is an outcome where the
model correctly predicts
the positive class. Similarly, a true
negative is an outcome where the
model correctly predicts
the negative class.
•A false positive is an outcome where the
model incorrectly predicts
the positive class. And a false negative is
an outcome where the
model incorrectly predicts
the negative class.
•In the following sections, we'll look at
how to evaluate classification models
using metrics derived from these four
outcomes.
Linear Regression
•In ML, we have a set of input variables (x) that
are used to determine the output variable (y). A
relationship exists between the input variables
and the output variable. The goal of ML is to
quantify this relationship.
Fig 1
•In Linear Regression, the relationship
between the input variables (x) and
output variable (y) is expressed as an
equation of the form y = a + bx. Thus, the
goal of linear regression is to find out the
values of coefficients a and b. Here, a is
the intercept and b is the slope of the
line.
•Figure 1 shows the plotted x and y values
for a dataset. The goal is to fit a line that
is nearest to most of the points. This
would reduce the distance (‘error’)
between the y value of a data point and
the line.
Logistic Regression
• Linear regression predictions are continuous values
(rainfall in cm),logistic regression predictions are
discrete values (whether a student passed/failed)
• Logistic regression is best suited for binary
classification (datasets where y = 0 or 1, where 1
denotes the default class. Example: In predicting
whether an event will occur or not, the event that it
occurs is classified as 1. In predicting whether a
person will be sick or not, the sick instances are
denoted as 1). It is named after the transformation
function used in it, called the logistic function h(x)= 1/
(1 + ex), which is an S-shaped curve.after applying a
transformation function.
• In logistic regression, the output is in the form
of probabilities of the default class (unlike
linear regression, where the output is directly
produced). As it is a probability, the output
lies in the range of 0-1. The output (y-value) is
generated by log transforming the x-value,
using the logistic function h(x)= 1/ (1 + e^ -x) .
A threshold is then applied to force this
probability into a binary classification.
Machine
Learning Applications
Future of Machine
Learning
•Machine Learning can be a
competitive advantage to any
company be it a top MNC or a startup
as things that are currently being
done manually will be done tomorrow
by machines. Machine Learning
revolution will stay with us for long
and so will be the future of Machine
Learning.

Machine Learning

  • 1.
  • 2.
    INTRODUCTION • Machine learningis a branch of artificial intelligence • Machine learning name is derived from the concept that it deals with “construction and study of systems that can learn from data” • Machine learning can be seen as building blocks to make computers learn to behave more intelligently • it is a theoretical concept
  • 3.
  • 5.
    Regression • A regressionproblem is when the output variable is a real or continuous value. • It is a measure of the relation between the mean value of one variable (e.g. output) and corresponding values of other variables. • Regression analysis is a statistical process for estimating the relationships among variables. • Regression means to predict the output value using training data. • Common function used are MSE, Gradient Descent
  • 6.
    Classification • A classificationproblem is when the output variable is a category, such as “red” or “blue” or “disease” and “no disease”. • Classification is technique to categorize our data into a desired and distinct number of classes where we can assign label to each class. • Classification means to divide the output using training data. • Works on discrete values • Common function used are Bayer classifier, Support Vector Machine
  • 7.
    Classification vs Regression• Classificationmeans to group the output into a class. • Classification to predict the type of tumor i.e. harmful or not harmful using training data • If it is discrete/categorical variable, then it is classification problem • Regression means to predict the output value using training data. • Regression to predict the house price from training data • If it is a real number/continuous, then it is regression problem.
  • 8.
    Clustering • An unsupervisedlearning method is a method in which we draw references from datasets consisting of input data without labeled responses. • It is used as a process to find meaningful structure, explanatory underlying processes, generative features, and groupings inherent in a set of examples. • It is basically a collection of objects on the basis of similarity and dissimilarity between them. • Common function used is K-mean
  • 9.
    Decision Tree Learning •Decisiontree learning uses a decision tree as a predictive model which maps observations about an item to conclusions about the item's target value. •To classify a new instance, we start at the root and traverse the tree to reach a leaf; at an internal node we evaluate the predicate(or function) on the data instance, to find which child to go. The process continues till we reach a leaf node 
  • 10.
    • The decisiontree in Figure3 classifies whether a person will buy a sports car or a minivan depending on their age and marital status. If the person is over 30 years and is not married, we walk the tree as follows : ‘over 30 years?’ -> yes -> ’married?’ -> no. Hence, the model outputs a sportscar.
  • 11.
    Random Forest •Random Forestis a trademark term for an ensemble of decision trees. In Random Forest, we’ve collection of decision trees (so known as “Forest”). To classify a new object based on attributes, each tree gives a classification and we say the tree “votes” for that class. The forest chooses the classification having the most votes (over all the trees in the forest).
  • 12.
    •Each tree isplanted & grown as follows: •If the number of cases in the training set is N, then sample of N cases is taken at random but with replacement. This sample will be the training set for growing the tree. •If there are M input variables, a number m<<M is specified such that at each node, m variables are selected at random out of the M and the best split on these m is used to split the node. The value of m is held constant during the forest growing. •Each tree is grown to the largest extent possible. There is no pruning.
  • 13.
    True vs. Falseand Positive vs. Negative •The Boy Who Cried Wolf example •"Wolf" is a positive class. •"No wolf" is a negative class. •We can summarize our "wolf-prediction" model using a 2x2 confusion matrix that depicts all four possible outcomes:
  • 15.
    •A true positive is anoutcome where the model correctly predicts the positive class. Similarly, a true negative is an outcome where the model correctly predicts the negative class. •A false positive is an outcome where the model incorrectly predicts the positive class. And a false negative is an outcome where the model incorrectly predicts the negative class. •In the following sections, we'll look at how to evaluate classification models using metrics derived from these four outcomes.
  • 16.
    Linear Regression •In ML,we have a set of input variables (x) that are used to determine the output variable (y). A relationship exists between the input variables and the output variable. The goal of ML is to quantify this relationship. Fig 1
  • 17.
    •In Linear Regression,the relationship between the input variables (x) and output variable (y) is expressed as an equation of the form y = a + bx. Thus, the goal of linear regression is to find out the values of coefficients a and b. Here, a is the intercept and b is the slope of the line. •Figure 1 shows the plotted x and y values for a dataset. The goal is to fit a line that is nearest to most of the points. This would reduce the distance (‘error’) between the y value of a data point and the line.
  • 18.
    Logistic Regression • Linearregression predictions are continuous values (rainfall in cm),logistic regression predictions are discrete values (whether a student passed/failed) • Logistic regression is best suited for binary classification (datasets where y = 0 or 1, where 1 denotes the default class. Example: In predicting whether an event will occur or not, the event that it occurs is classified as 1. In predicting whether a person will be sick or not, the sick instances are denoted as 1). It is named after the transformation function used in it, called the logistic function h(x)= 1/ (1 + ex), which is an S-shaped curve.after applying a transformation function.
  • 19.
    • In logisticregression, the output is in the form of probabilities of the default class (unlike linear regression, where the output is directly produced). As it is a probability, the output lies in the range of 0-1. The output (y-value) is generated by log transforming the x-value, using the logistic function h(x)= 1/ (1 + e^ -x) . A threshold is then applied to force this probability into a binary classification.
  • 20.
  • 21.
    Future of Machine Learning •MachineLearning can be a competitive advantage to any company be it a top MNC or a startup as things that are currently being done manually will be done tomorrow by machines. Machine Learning revolution will stay with us for long and so will be the future of Machine Learning.