Download to read offline


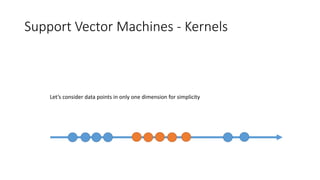
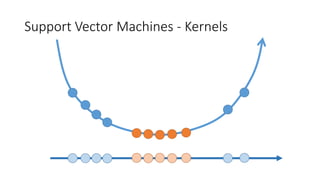
![Support Vector Machines - Kernels
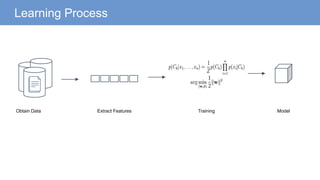
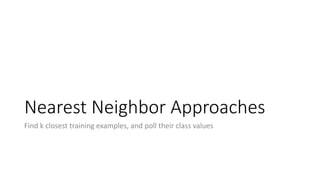
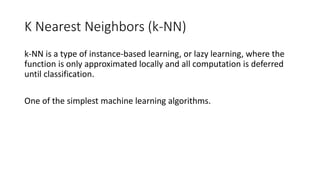
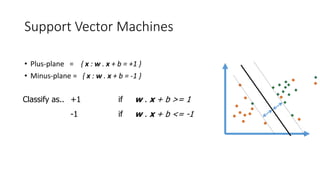
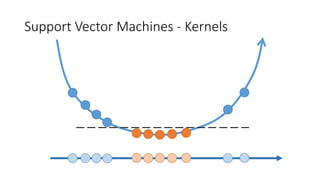
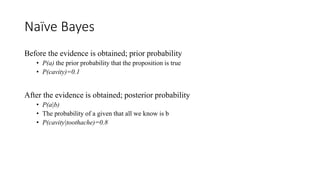
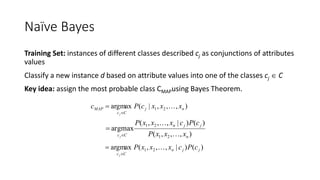
The linear classifier relies on dot product between vectors K(xi,xj)=xi
Txj
If every data point is mapped into high-dimensional space via some transformation Φ: x →
φ(x), the dot product becomes: K(xi,xj)= φ(xi) Tφ(xj)
A kernel function is some function that corresponds to an inner product in some expanded
feature space.
Example:
2-dimensional vectors x=[x1 x2]; let K(xi,xj)=(1 + xi
Txj)2
,
Need to show that K(xi,xj)= φ(xi) Tφ(xj):
K(xi,xj)=(1 + xi
Txj)2
,
= 1+ xi1
2xj1
2 + 2 xi1xj1 xi2xj2+ xi2
2xj2
2 + 2xi1xj1 + 2xi2xj2
= [1 xi1
2 √2 xi1xi2 xi2
2 √2xi1 √2xi2]T [1 xj1
2 √2 xj1xj2 xj2
2 √2xj1 √2xj2]
= φ(xi) Tφ(xj), where φ(x) = [1 x1
2 √2 x1x2 x2
2 √2x1 √2x2]](https://image.slidesharecdn.com/analyticsbootcamp-180928104639/85/Analytics-Boot-Camp-Slides-94-320.jpg)


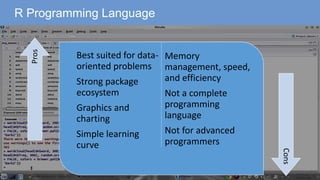
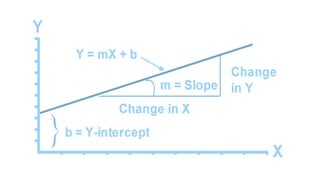
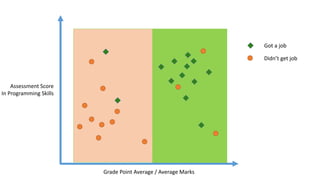
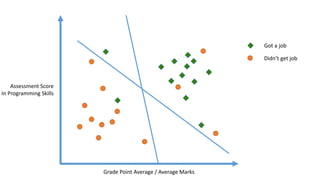
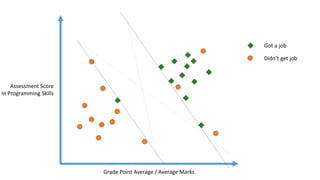
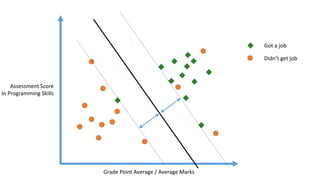
The document outlines a curriculum for an analytics boot camp, covering data analytics techniques, machine learning models, and programming tools such as R, Python, and MATLAB. It emphasizes the use of various machine learning methods, including supervised and unsupervised learning, and introduces key concepts like regression, decision trees, and clustering algorithms. Additionally, it discusses cloud computing frameworks and their applications in data analytics, along with the importance of evaluating model performance.


![제 23회 보아즈(BOAZ) 빅데이터 컨퍼런스 - [MBOAX] : ABSA를 활용한 소비자 반응 분석 기반 운영 효율화 대시보드 설계](https://cdn.slidesharecdn.com/ss_thumbnails/3-1boaz23rdconferencemboax-260203102709-9d519923-thumbnail.jpg?width=640&height=640&fit=bounds)


