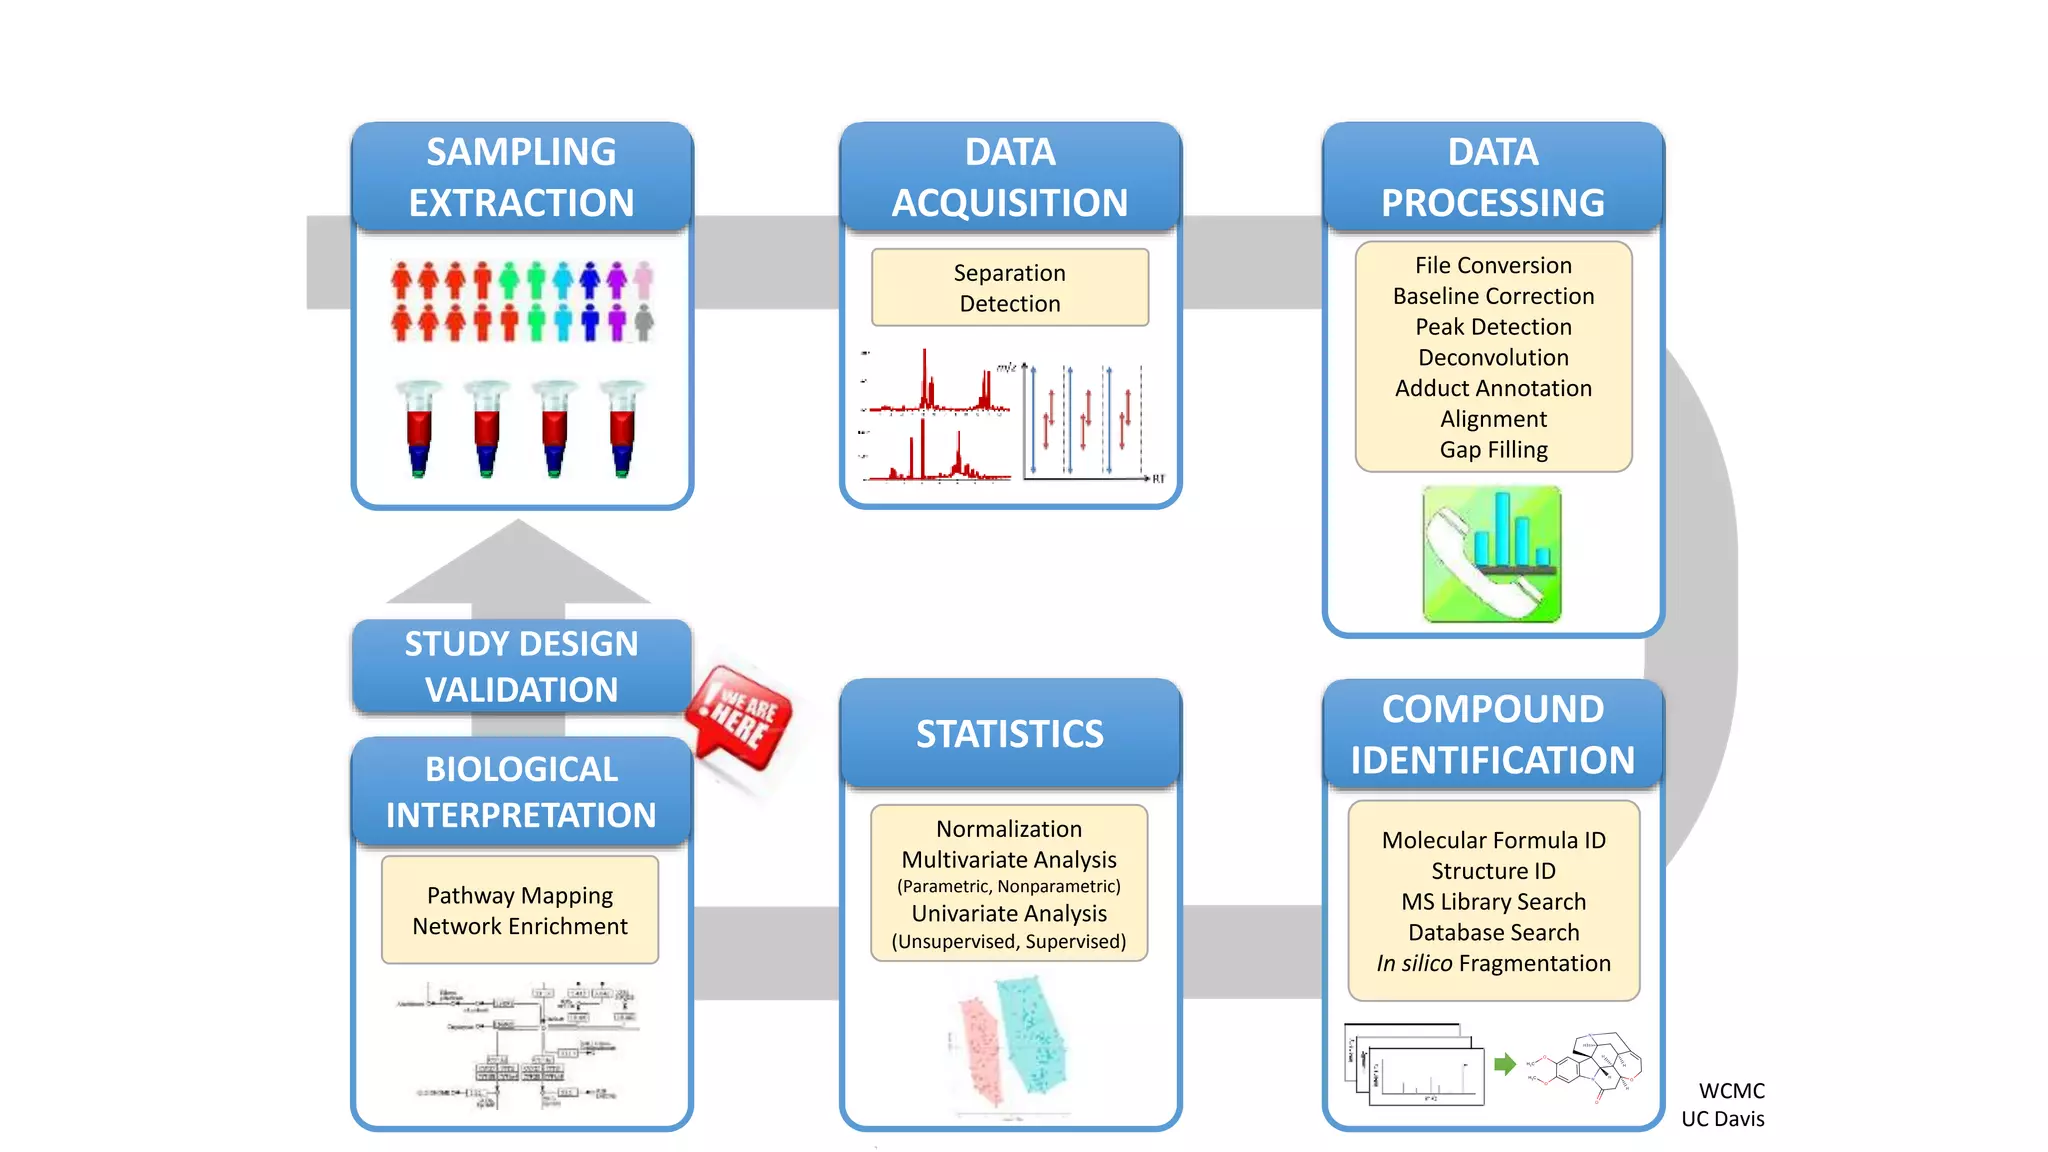
This document discusses biochemical network mapping and visualization. It begins by describing the process of creating a metabolic network graph with nodes representing metabolites and edges representing reactions. While metabolic databases can provide information on known reactions, not all detected metabolites may be present. The document then introduces MetaMapp as an approach to map all detected metabolites into a network graph by combining information on known biochemical reactions with chemical similarity. Cytoscape software allows visualization and analysis of these network graphs. In conclusion, MetaMapp can be used to incorporate all identified metabolites into biochemical modules to aid in interpretation of omics data.
DATA
ACQUISITION
Separation
Detection
SAMPLING
EXTRACTION
DATA
PROCESSING
File Conversion
Baseline Correction
PeakDetection
Deconvolution
Adduct Annotation
Alignment
Gap Filling
STATISTICS
Normalization
Multivariate Analysis
(Parametric, Nonparametric)
Univariate Analysis
(Unsupervised, Supervised)
BIOLOGICAL
INTERPRETATION
Pathway Mapping
Network Enrichment
STUDY DESIGN
VALIDATION
COMPOUND
IDENTIFICATION
Molecular Formula ID
Structure ID
MS Library Search
Database Search
In silico Fragmentation
WCMC
UC Davis
3.
Questions :
• Whya network graph ?
• How to create biochemical network map of
identified metabolites ?
• How to include all the identified metabolites into a
network ?
• How to visualize and make publication ready
network graphs ?
• How to use MetaMapp and Cytoscape software ?
4.
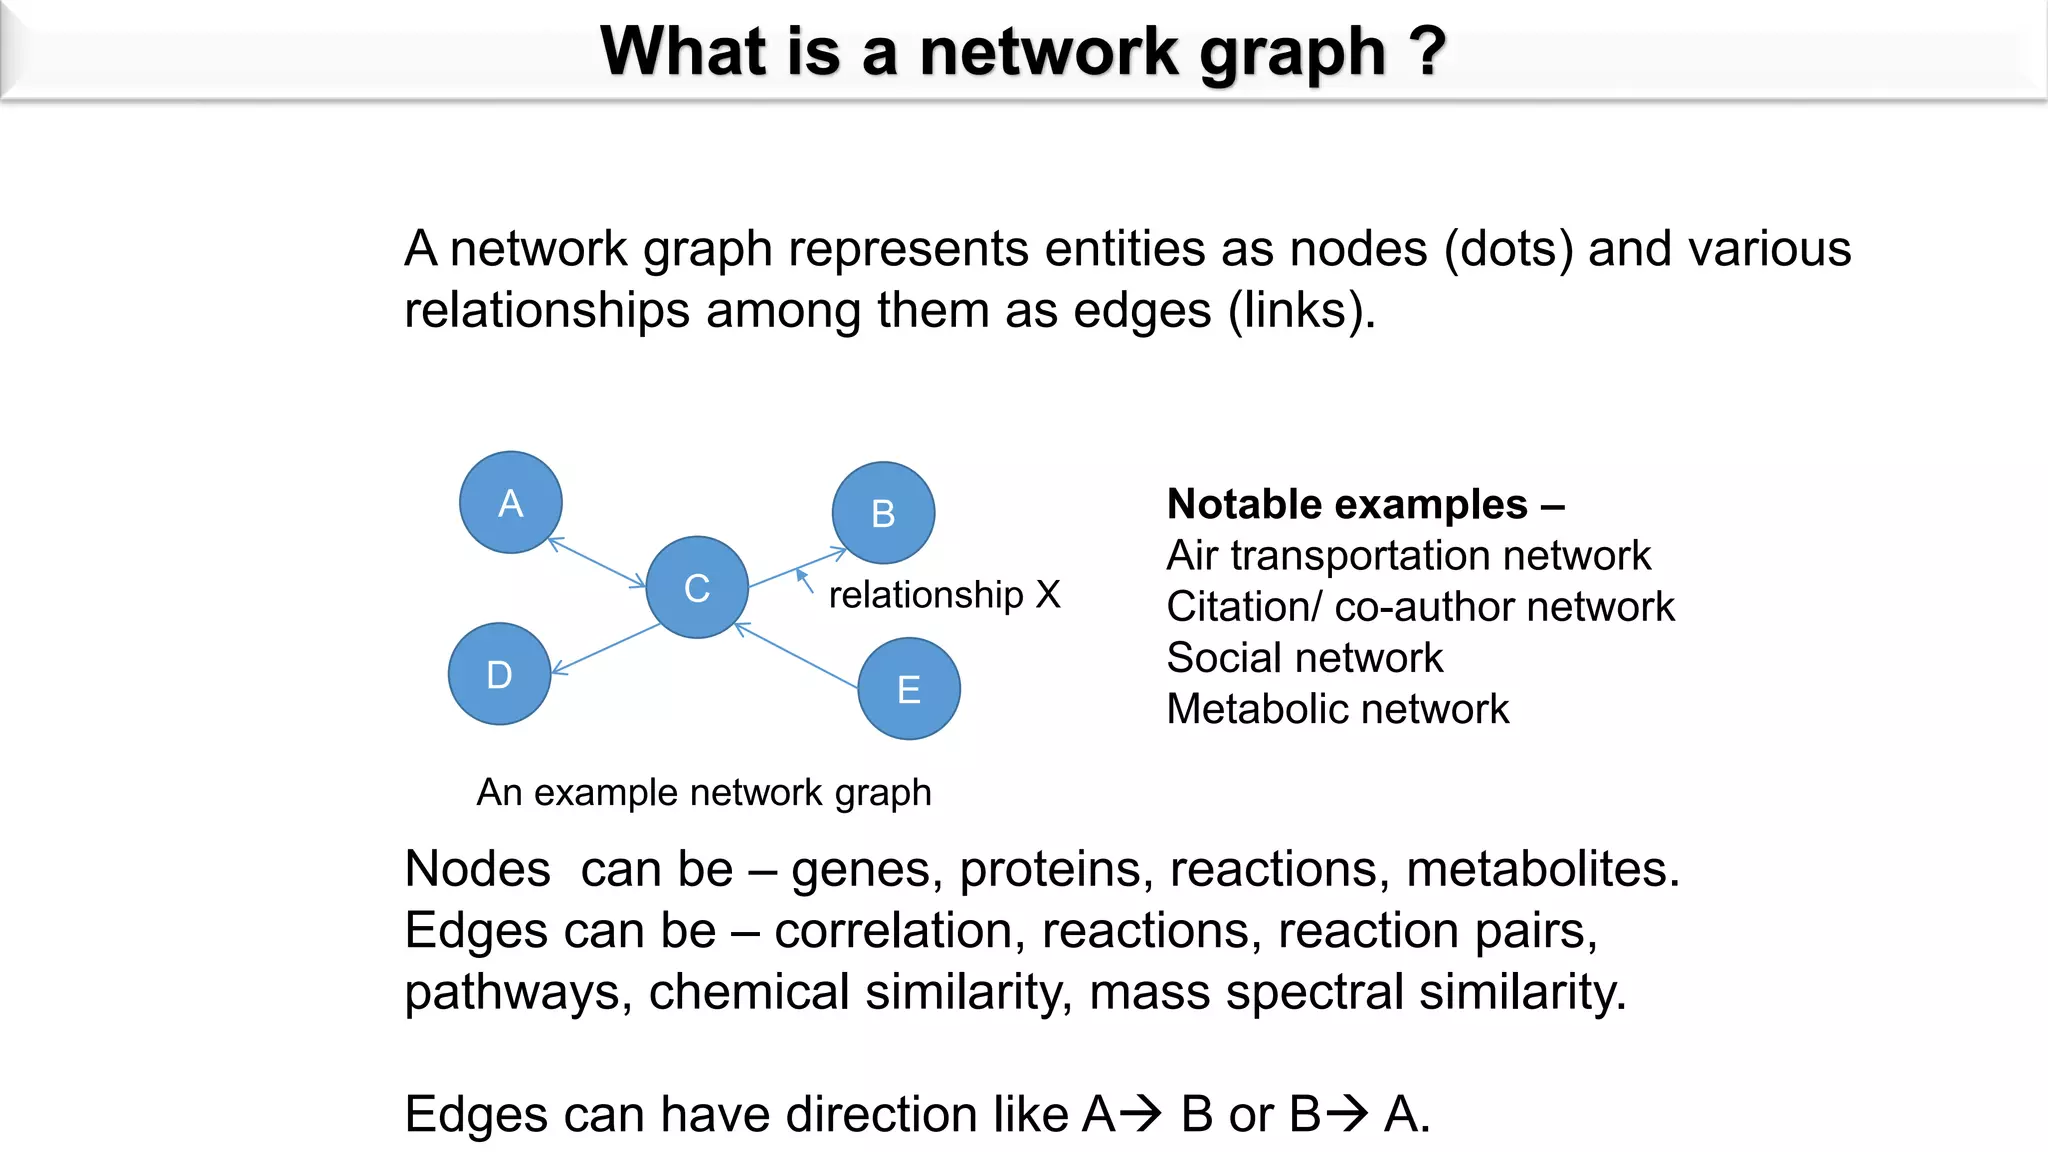
What is anetwork graph ?
A network graph represents entities as nodes (dots) and various
relationships among them as edges (links).
A
C
D
B
E
relationship X
An example network graph
Nodes can be – genes, proteins, reactions, metabolites.
Edges can be – correlation, reactions, reaction pairs,
pathways, chemical similarity, mass spectral similarity.
Edges can have direction like A B or B A.
Notable examples –
Air transportation network
Citation/ co-author network
Social network
Metabolic network
5.
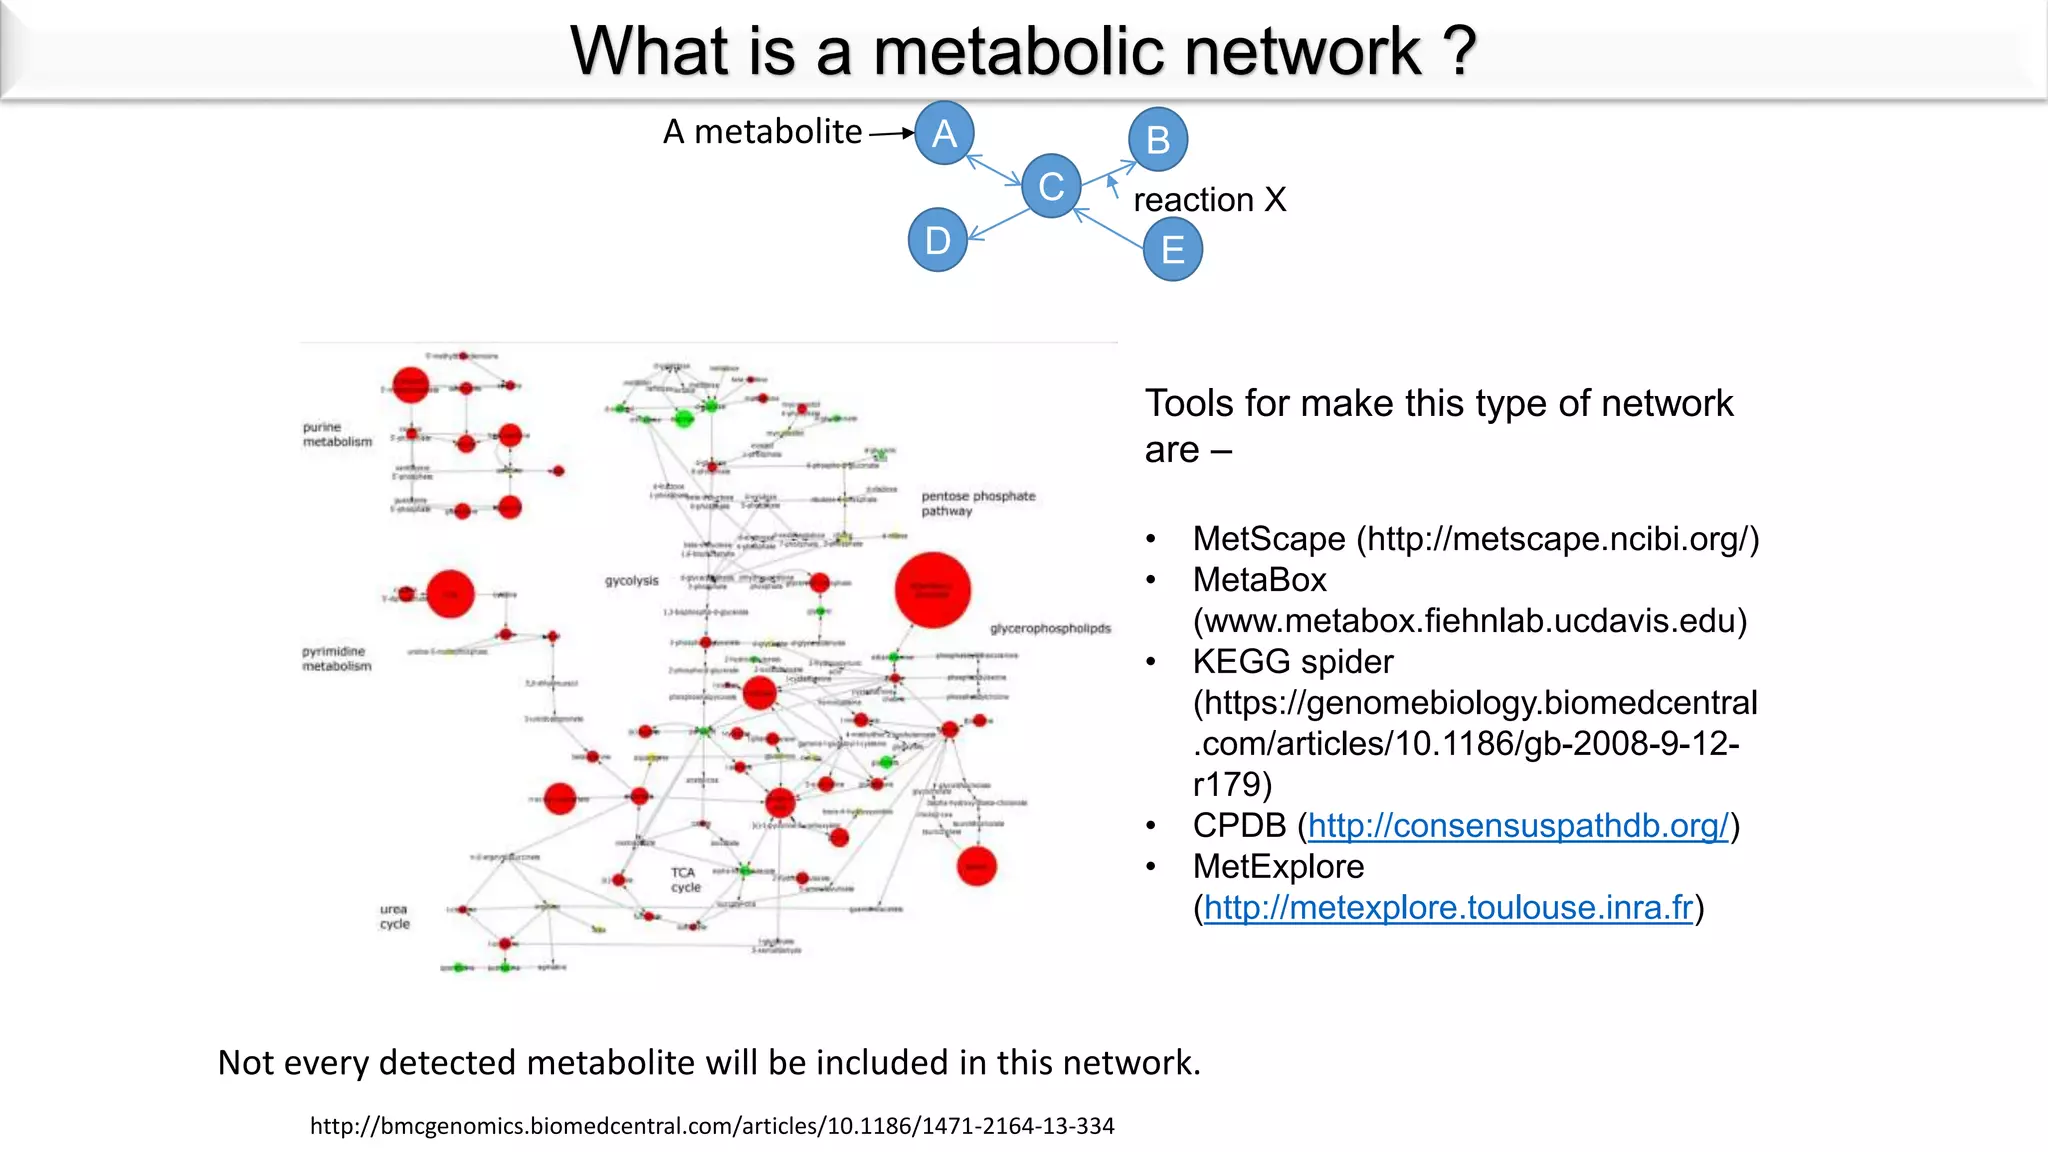
http://bmcgenomics.biomedcentral.com/articles/10.1186/1471-2164-13-334
What is ametabolic network ?
Tools for make this type of network
are –
• MetScape (http://metscape.ncibi.org/)
• MetaBox
(www.metabox.fiehnlab.ucdavis.edu)
• KEGG spider
(https://genomebiology.biomedcentral
.com/articles/10.1186/gb-2008-9-12-
r179)
• CPDB (http://consensuspathdb.org/)
• MetExplore
(http://metexplore.toulouse.inra.fr)
A
C
D
B
E
reaction X
A metabolite
Not every detected metabolite will be included in this network.
6.
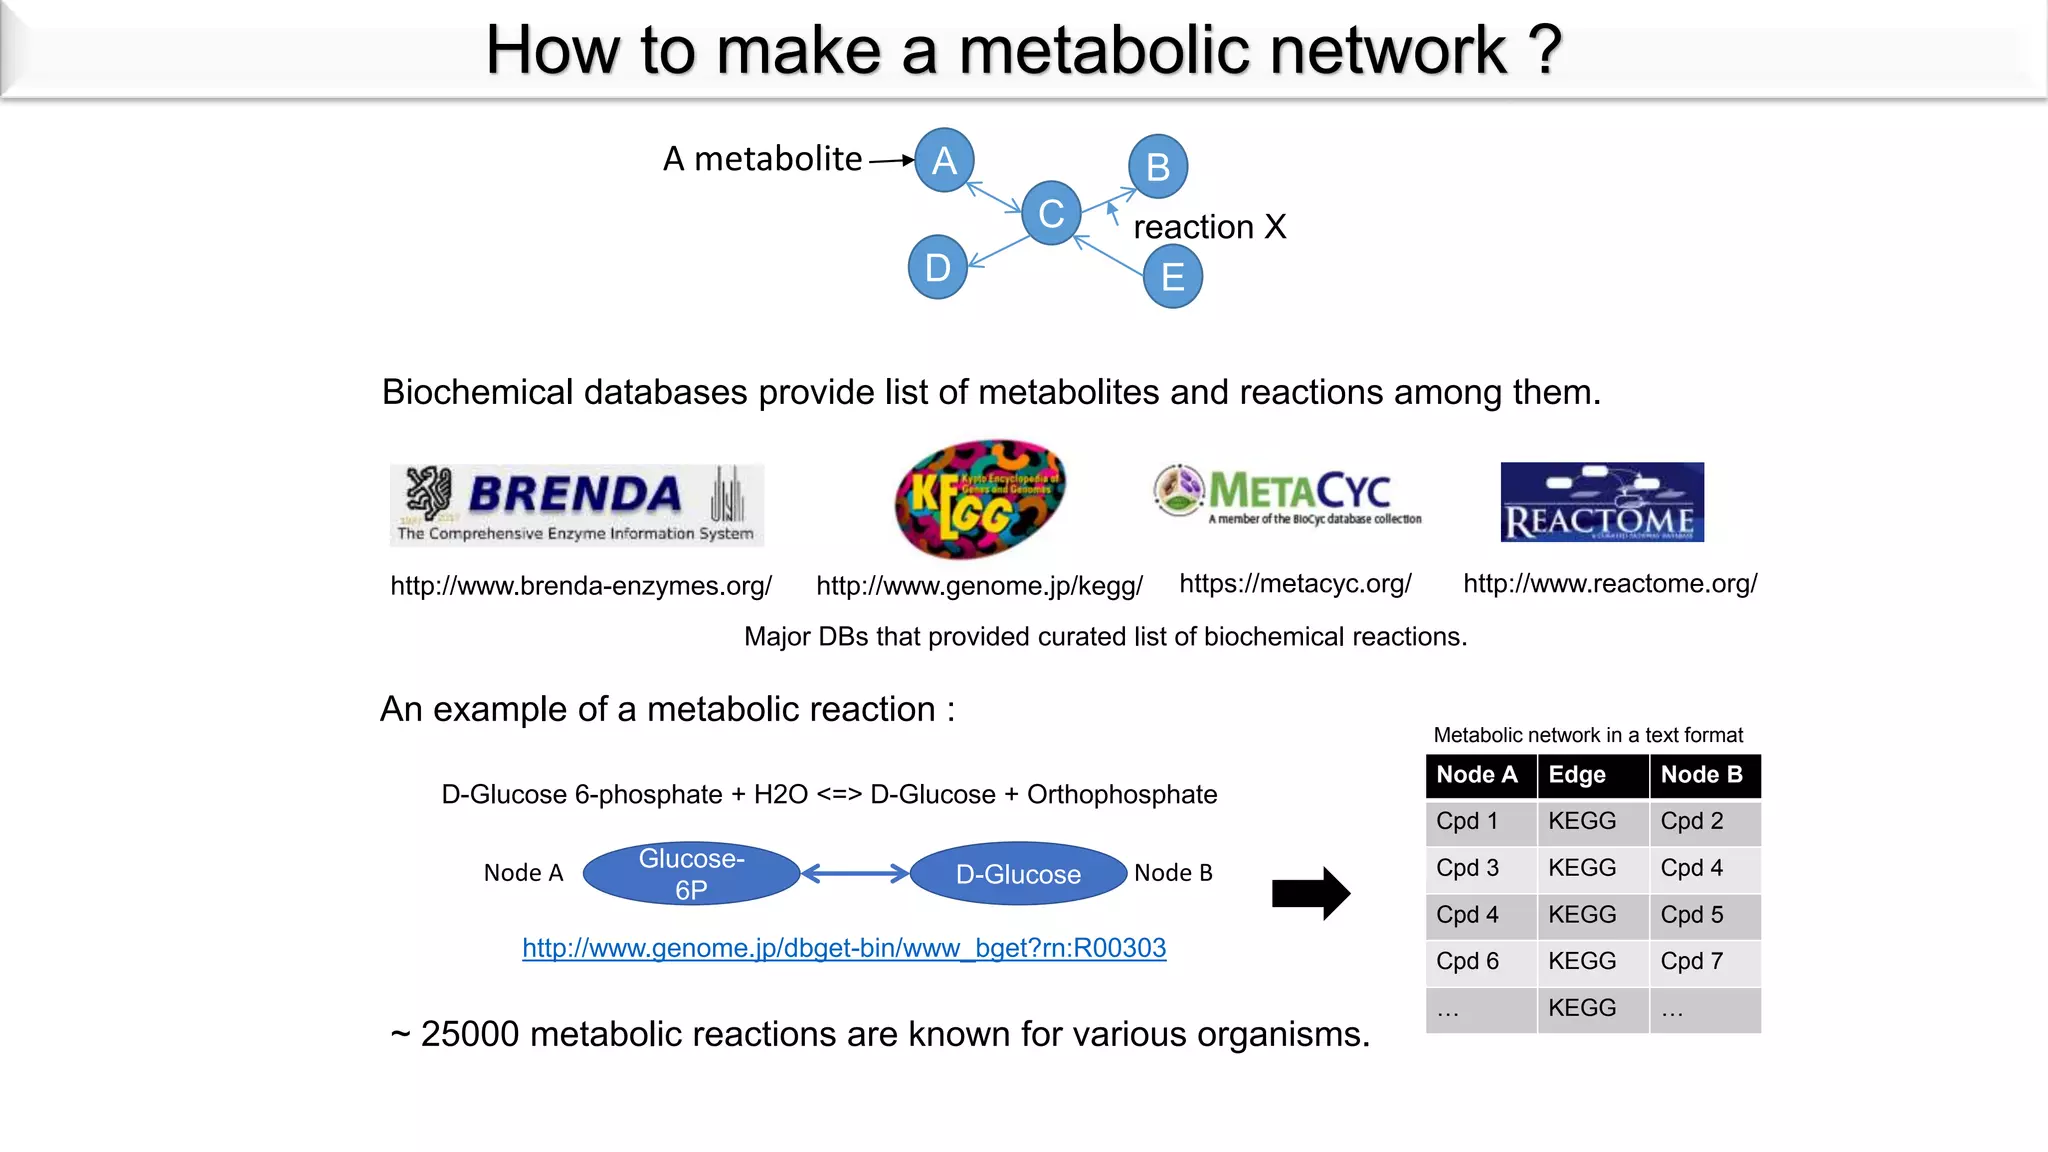
Biochemical databases providelist of metabolites and reactions among them.
An example of a metabolic reaction :
http://www.brenda-enzymes.org/ http://www.genome.jp/kegg/ https://metacyc.org/ http://www.reactome.org/
Major DBs that provided curated list of biochemical reactions.
Glucose-
6P
D-Glucose
D-Glucose 6-phosphate + H2O <=> D-Glucose + Orthophosphate
http://www.genome.jp/dbget-bin/www_bget?rn:R00303
~ 25000 metabolic reactions are known for various organisms.
Node A Node B
Node A Edge Node B
Cpd 1 KEGG Cpd 2
Cpd 3 KEGG Cpd 4
Cpd 4 KEGG Cpd 5
Cpd 6 KEGG Cpd 7
… KEGG …
Metabolic network in a text format
How to make a metabolic network ?
A
C
D
B
E
reaction X
A metabolite
7.
Two representations ofthe EC 2.3.1.35 reaction.
Two ways to convert a reaction to a graph
The KEGG RPAIR database is a manually curated
collection of reactant pairs (substrate-product pairs)
and chemical structure transformation patterns in
enzymatic reactions.
Masanori Arita PNAS 2004;101:1543-1547
Connect only the actual subtract-product and ignore the side
product or co-factors.
8.
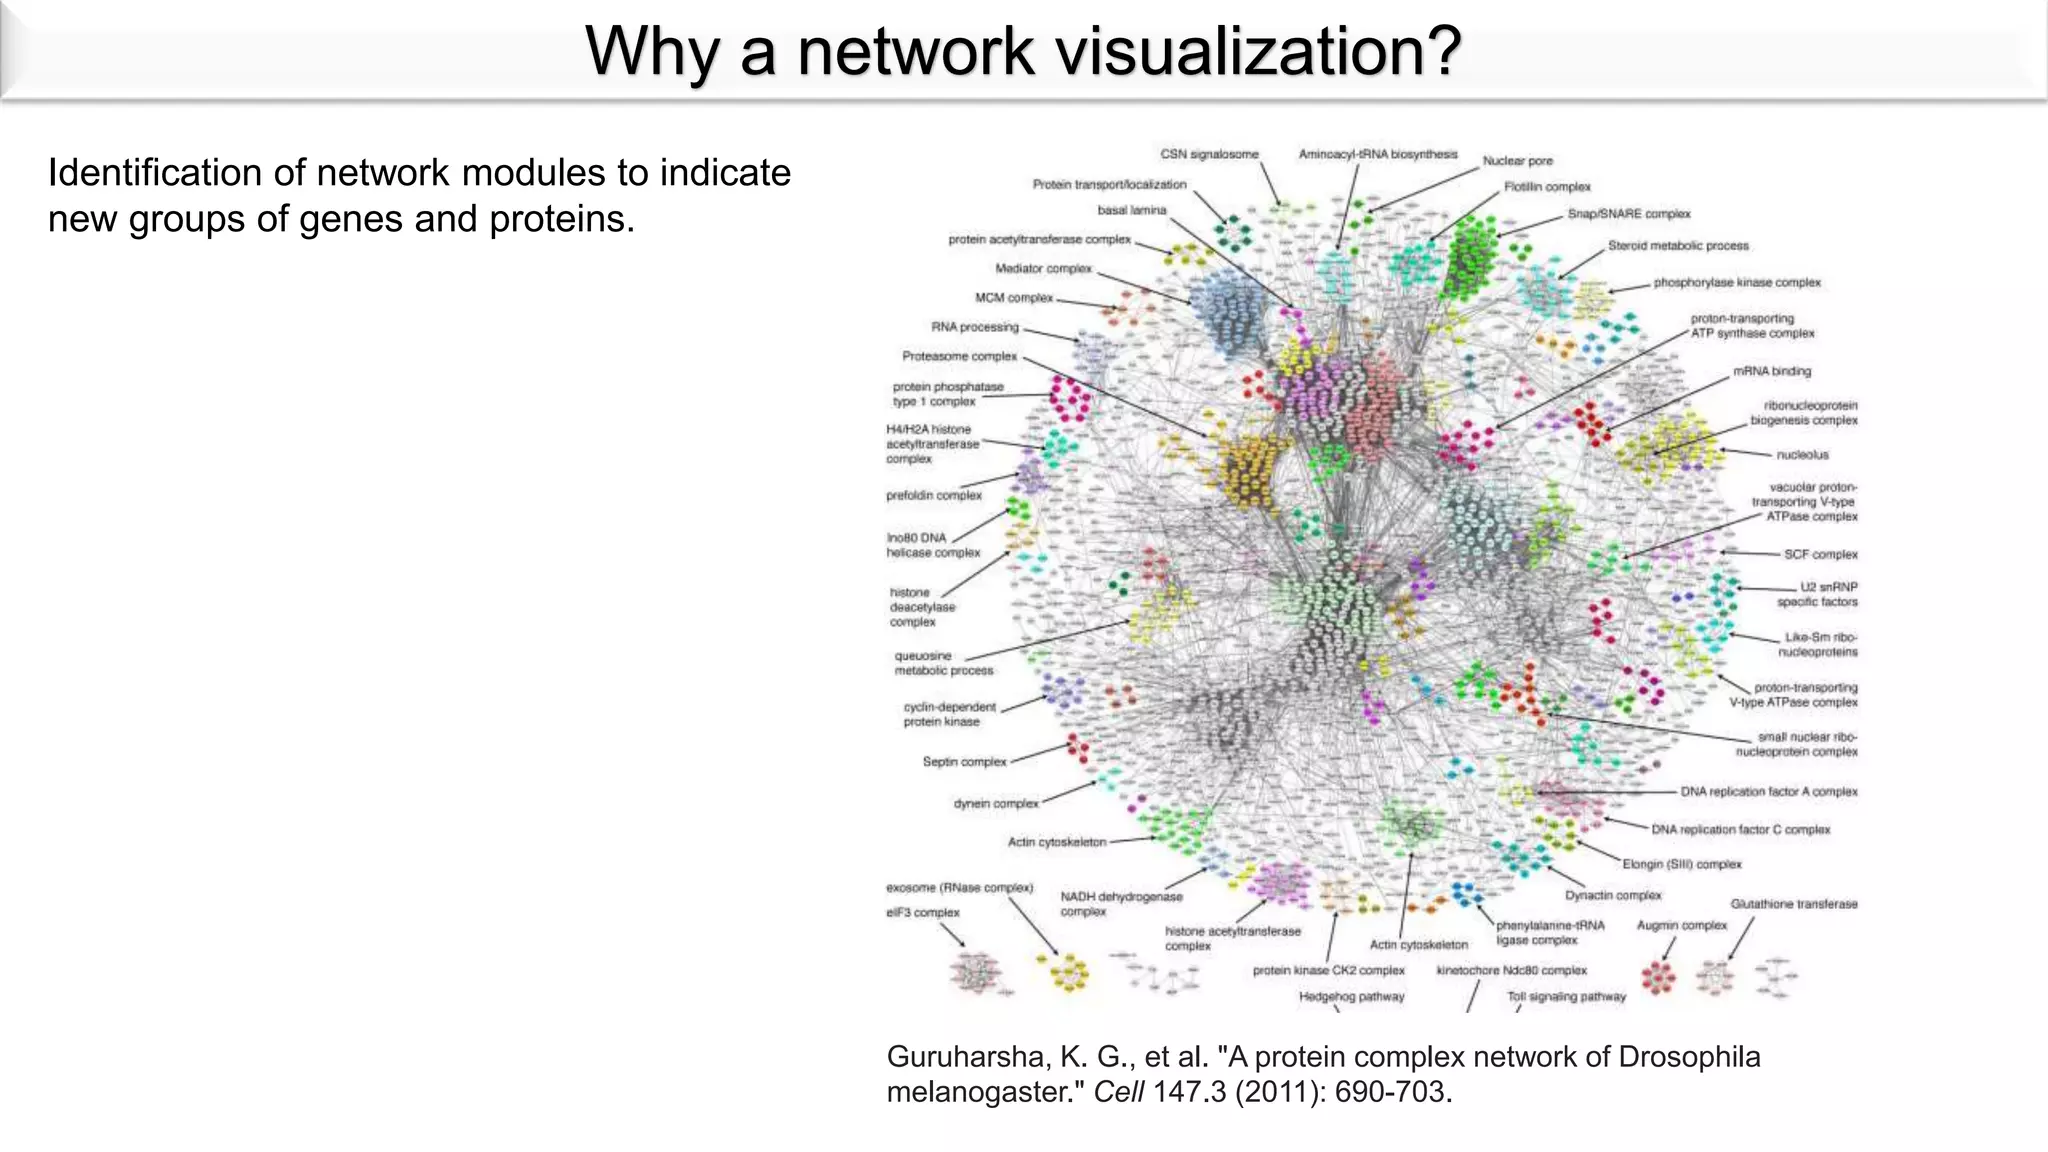
Why a networkvisualization?
Guruharsha, K. G., et al. "A protein complex network of Drosophila
melanogaster." Cell 147.3 (2011): 690-703.
Identification of network modules to indicate
new groups of genes and proteins.
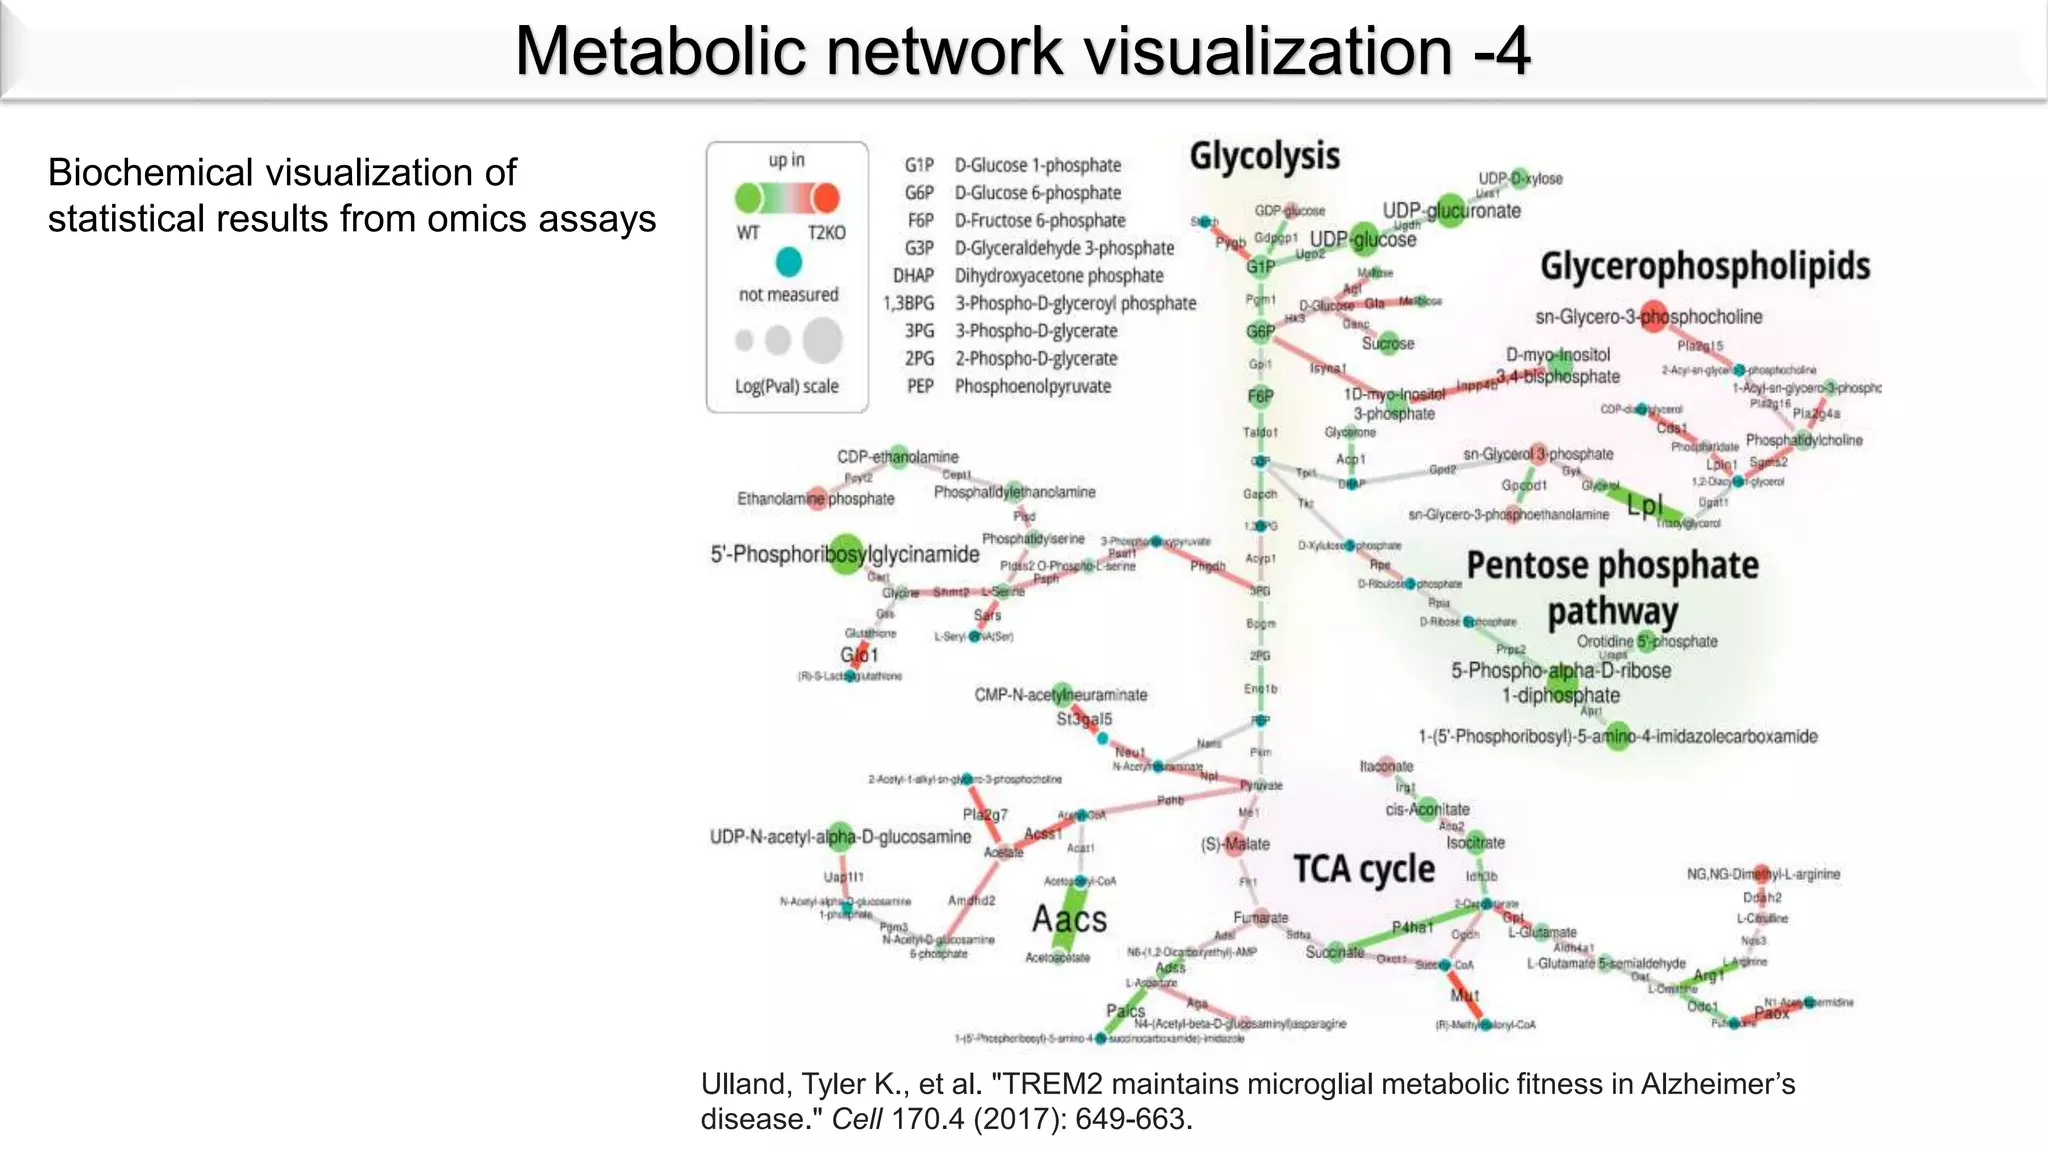
Ulland, Tyler K.,et al. "TREM2 maintains microglial metabolic fitness in Alzheimer’s
disease." Cell 170.4 (2017): 649-663.
Biochemical visualization of
statistical results from omics assays
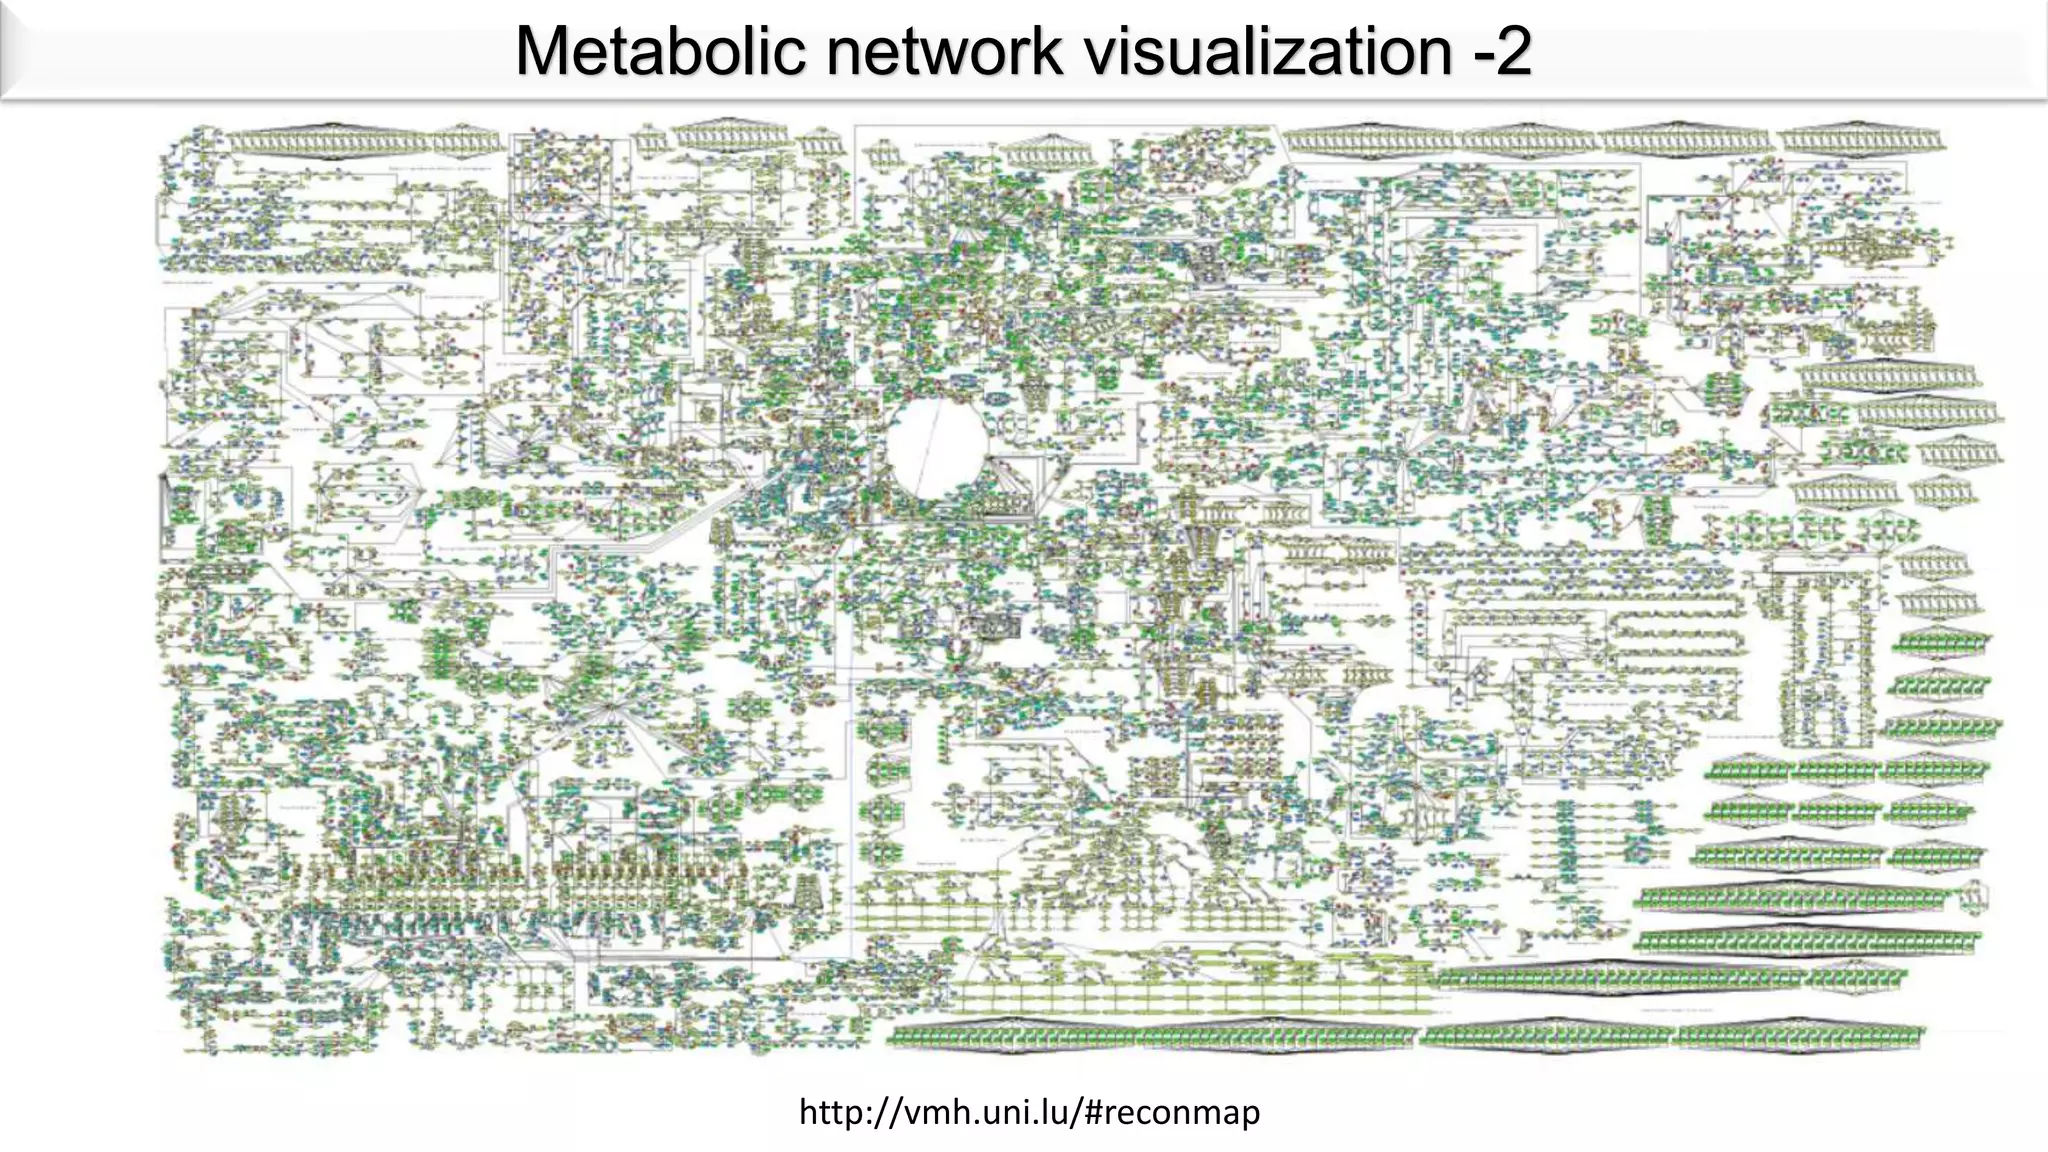
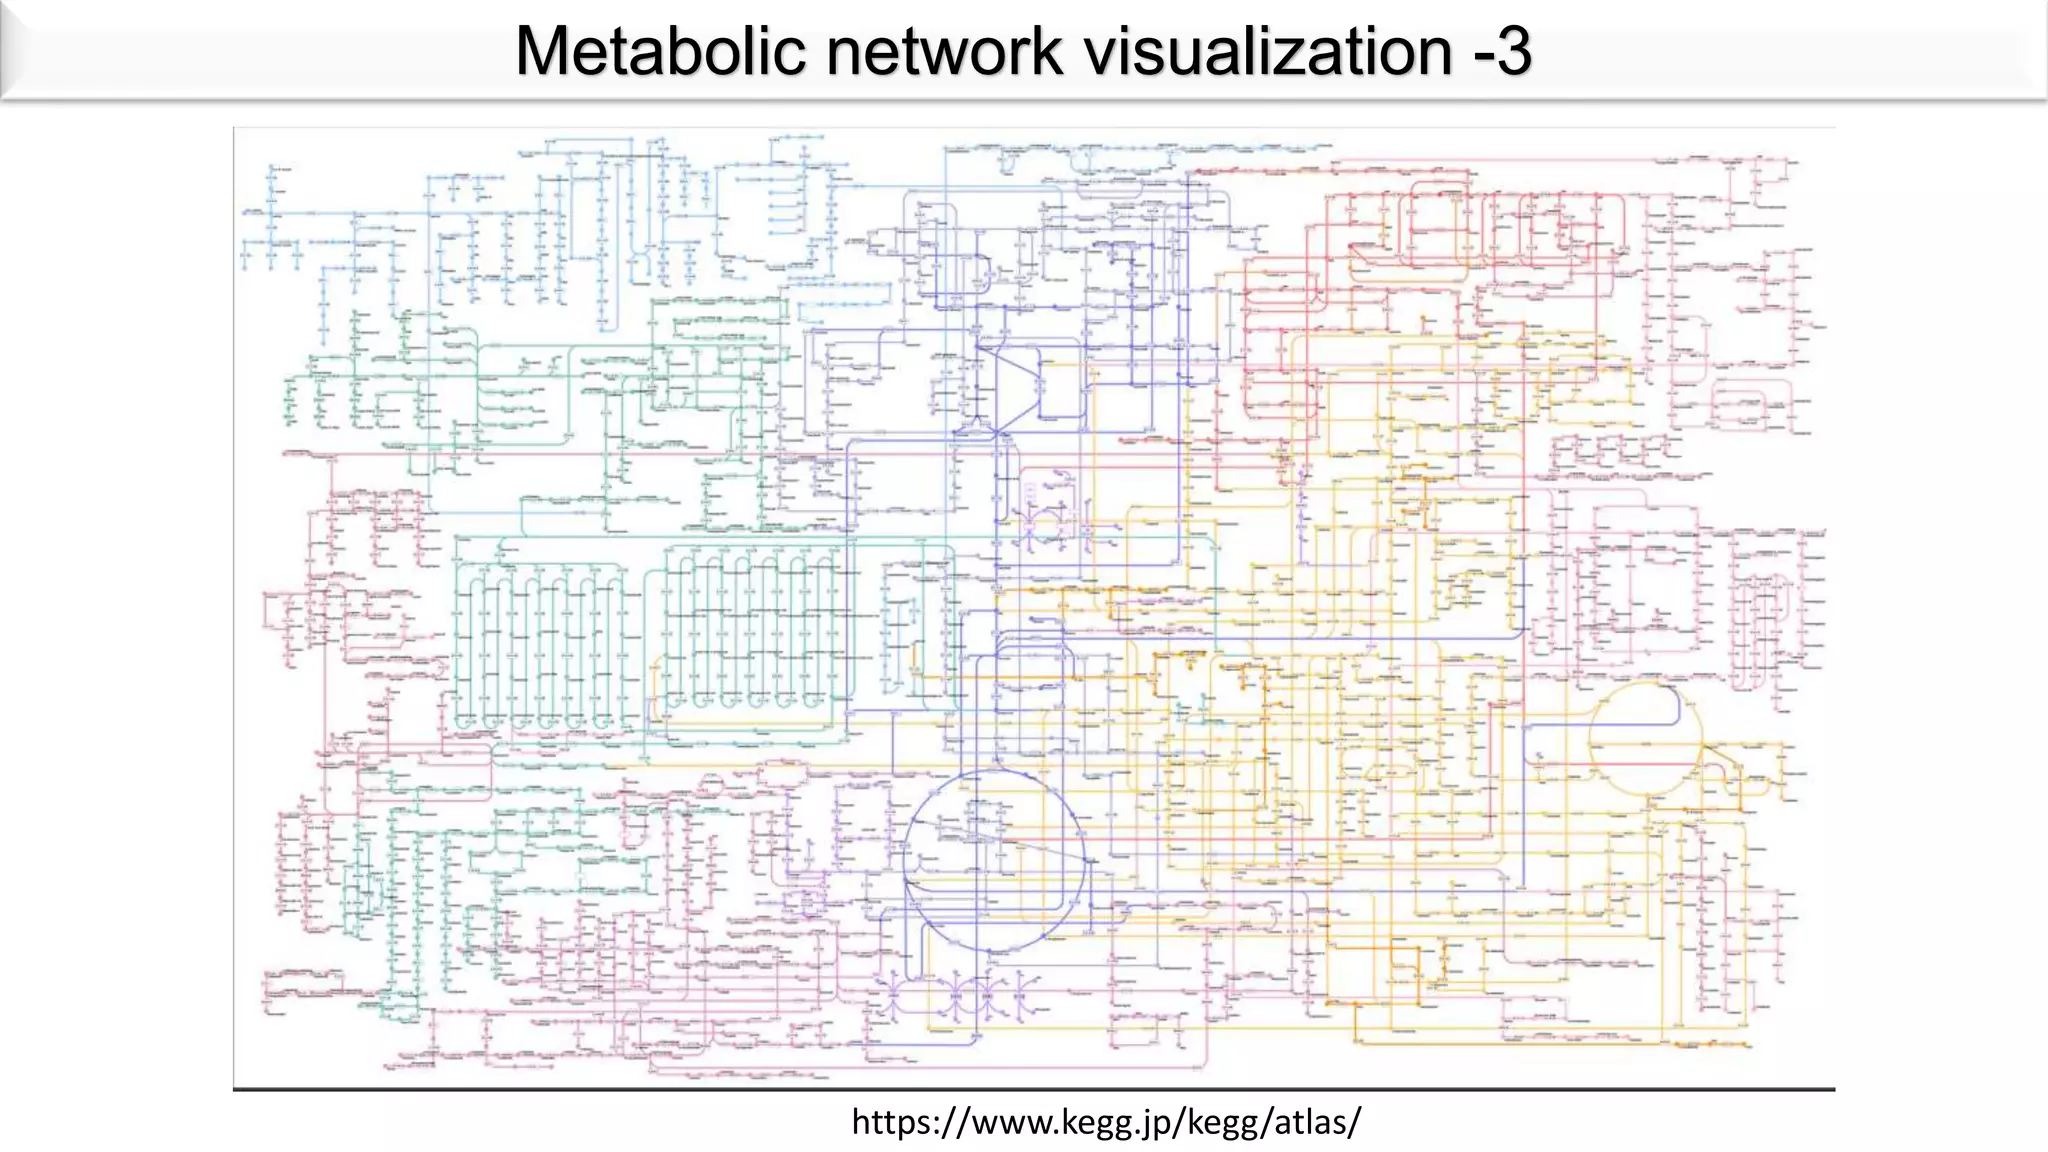
Metabolic network visualization -4
13.
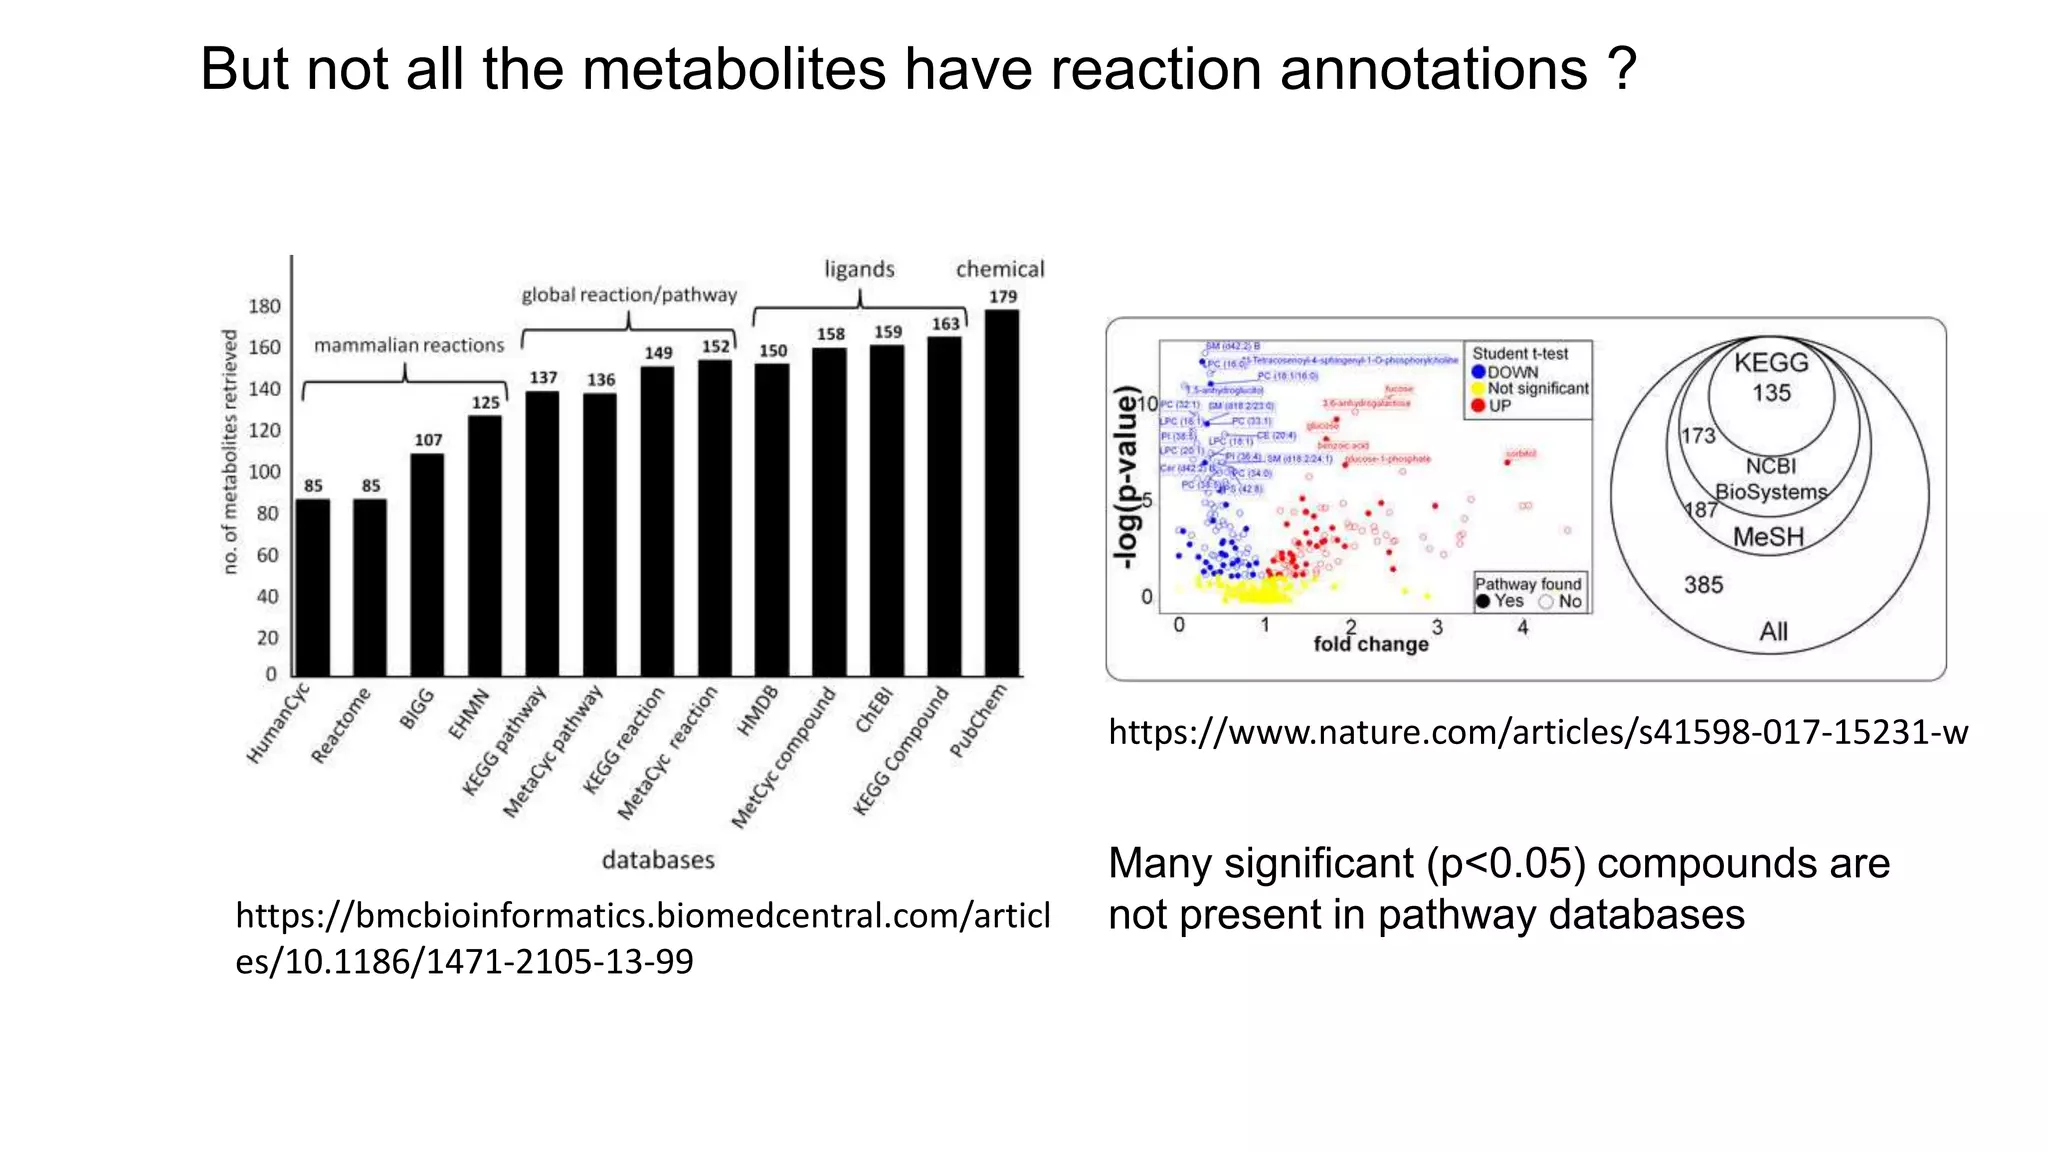
But not allthe metabolites have reaction annotations ?
https://bmcbioinformatics.biomedcentral.com/articl
es/10.1186/1471-2105-13-99
https://www.nature.com/articles/s41598-017-15231-w
Many significant (p<0.05) compounds are
not present in pathway databases
14.
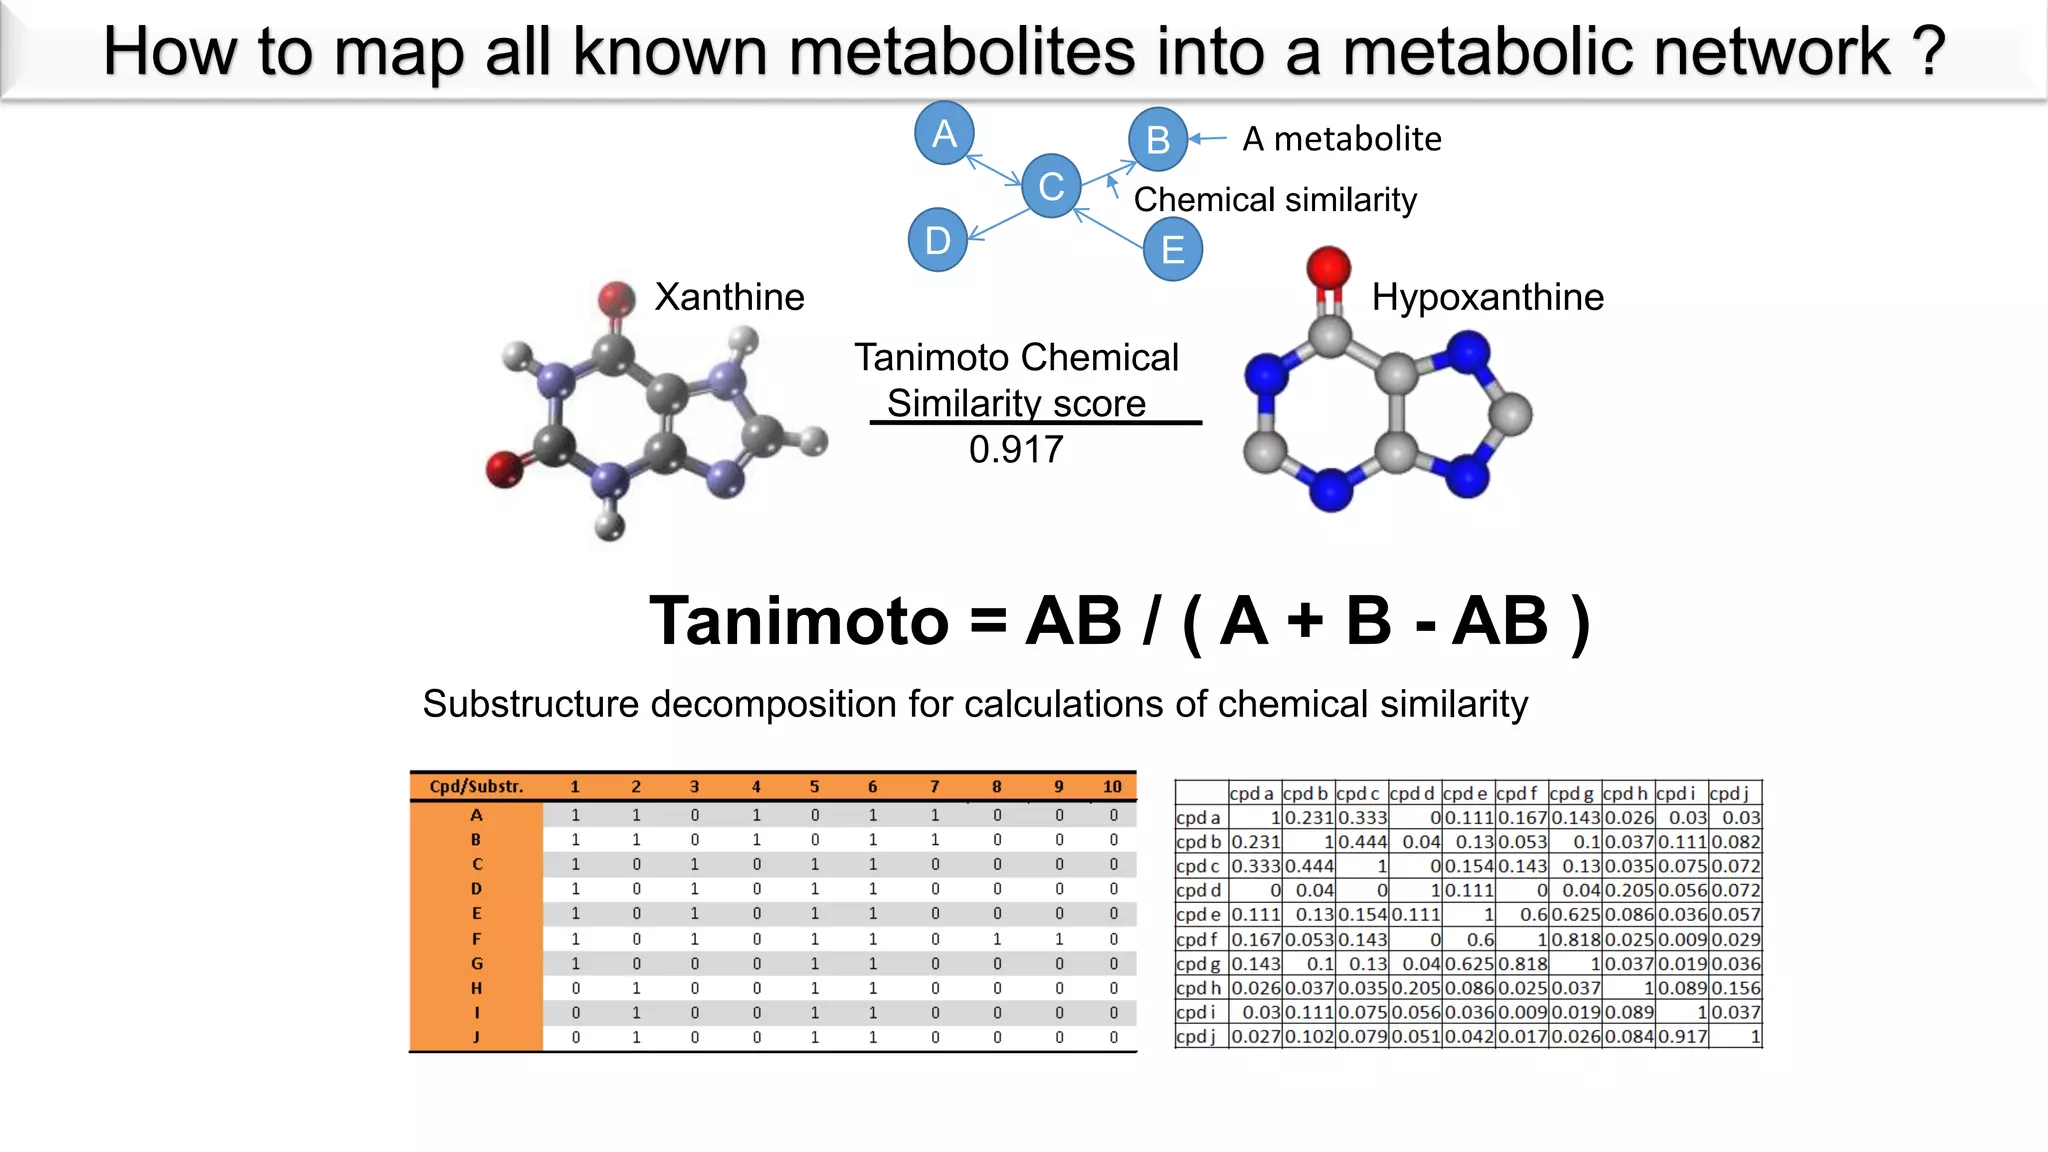
How to mapall known metabolites into a metabolic network ?
A
C
D
B
E
Chemical similarity
A metabolite
Xanthine Hypoxanthine
Tanimoto Chemical
Similarity score
0.917
Tanimoto = AB / ( A + B - AB )
Substructure decomposition for calculations of chemical similarity
15.
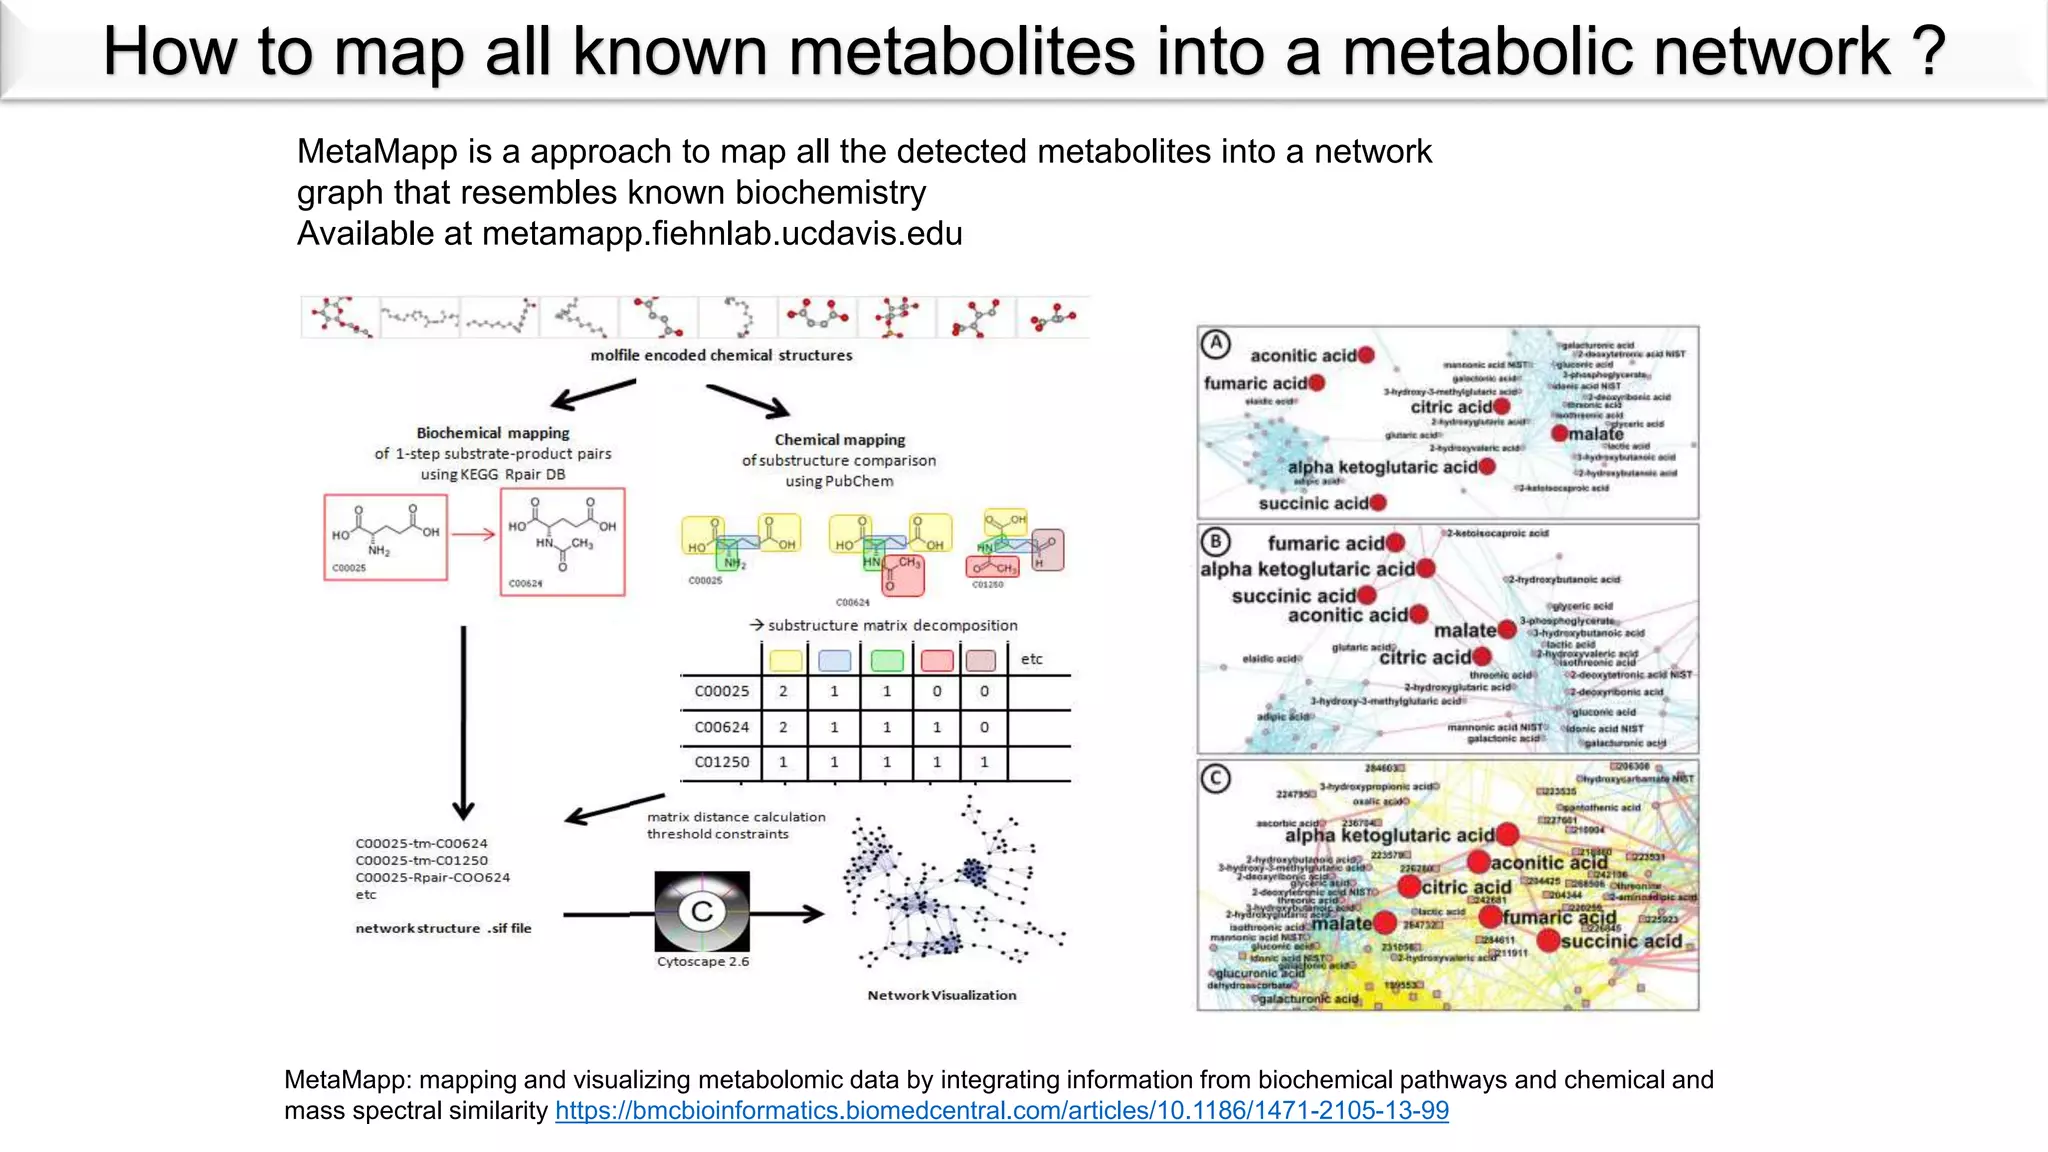
MetaMapp: mapping andvisualizing metabolomic data by integrating information from biochemical pathways and chemical and
mass spectral similarity https://bmcbioinformatics.biomedcentral.com/articles/10.1186/1471-2105-13-99
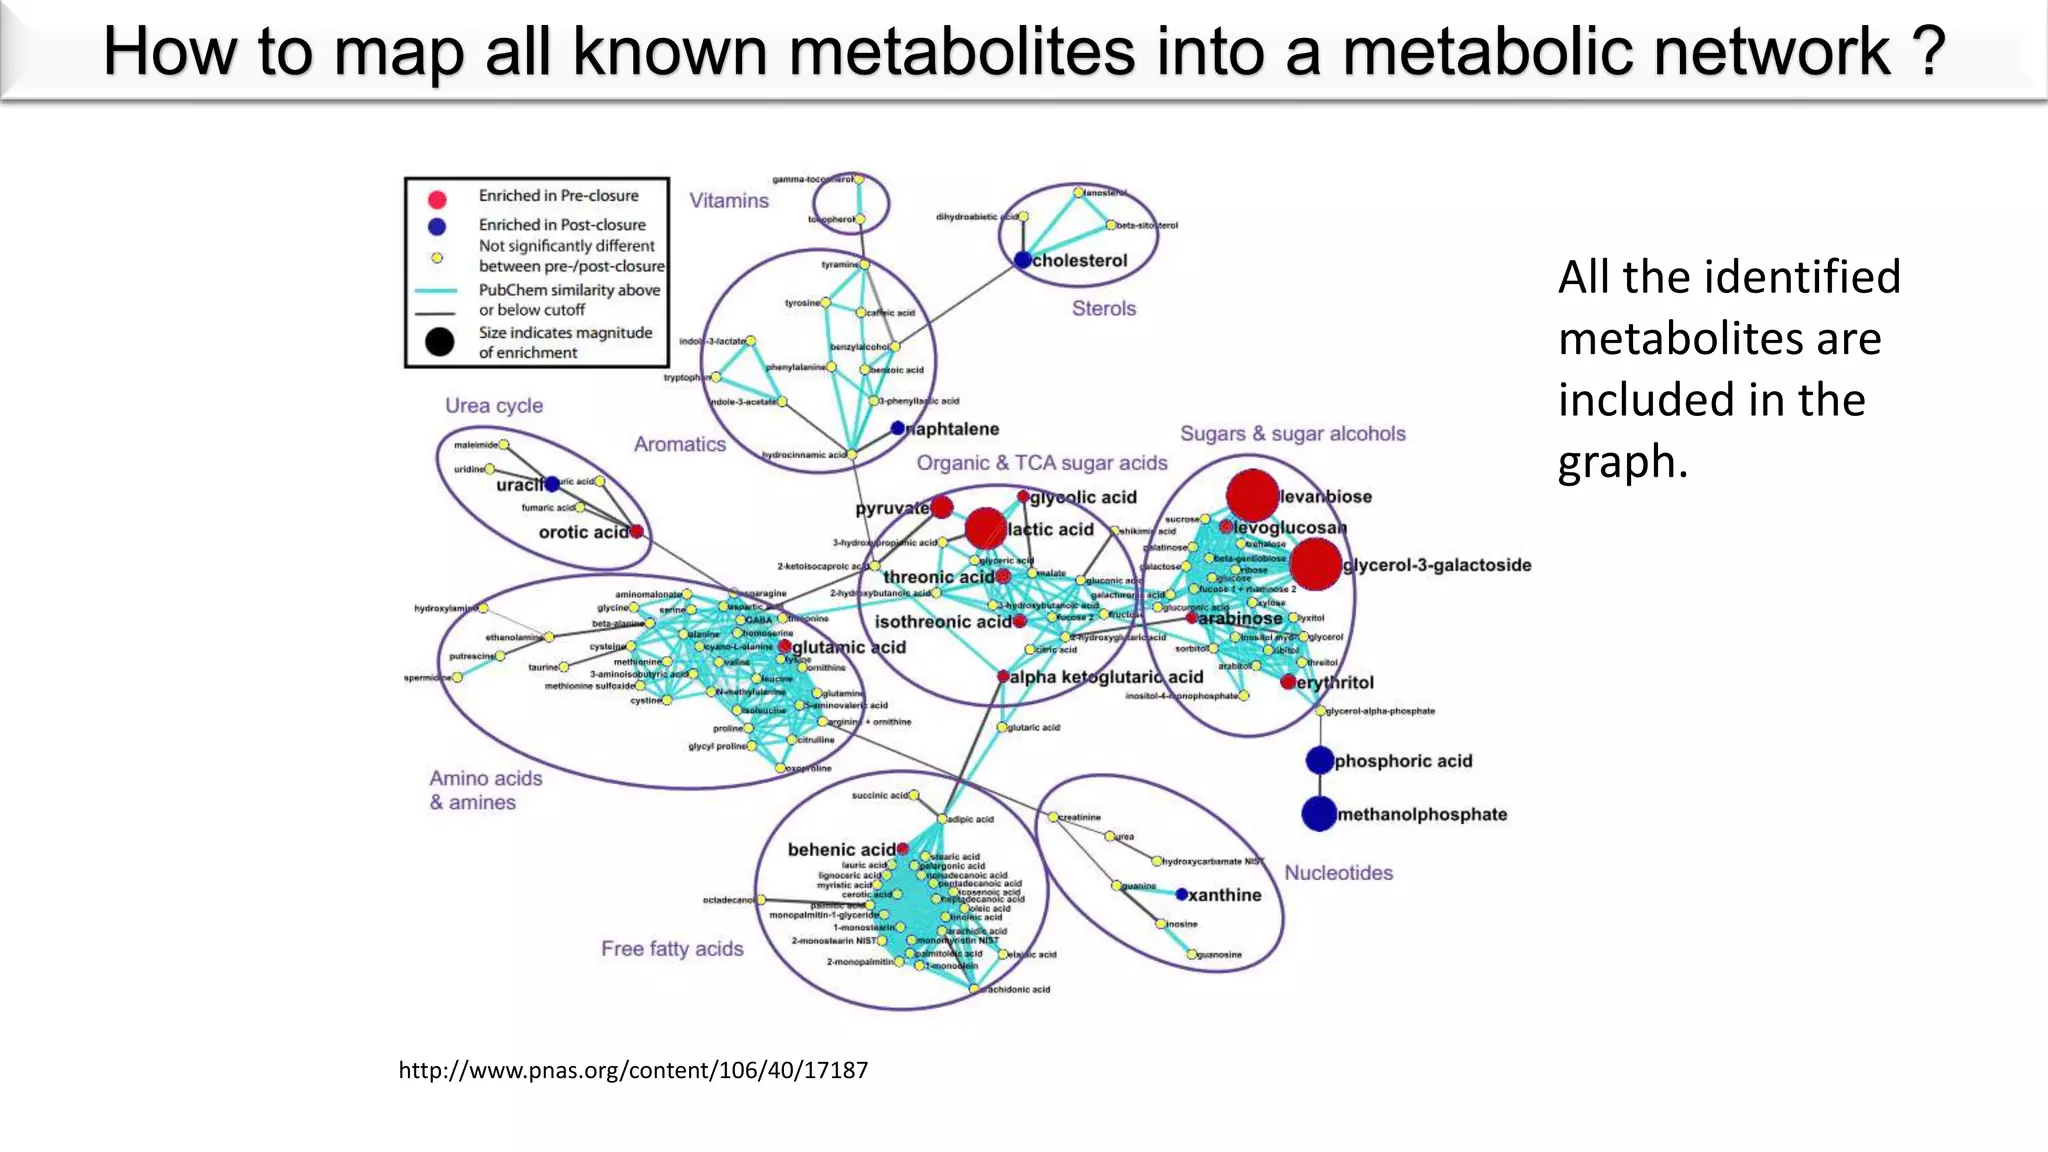
MetaMapp is a approach to map all the detected metabolites into a network
graph that resembles known biochemistry
Available at metamapp.fiehnlab.ucdavis.edu
How to map all known metabolites into a metabolic network ?
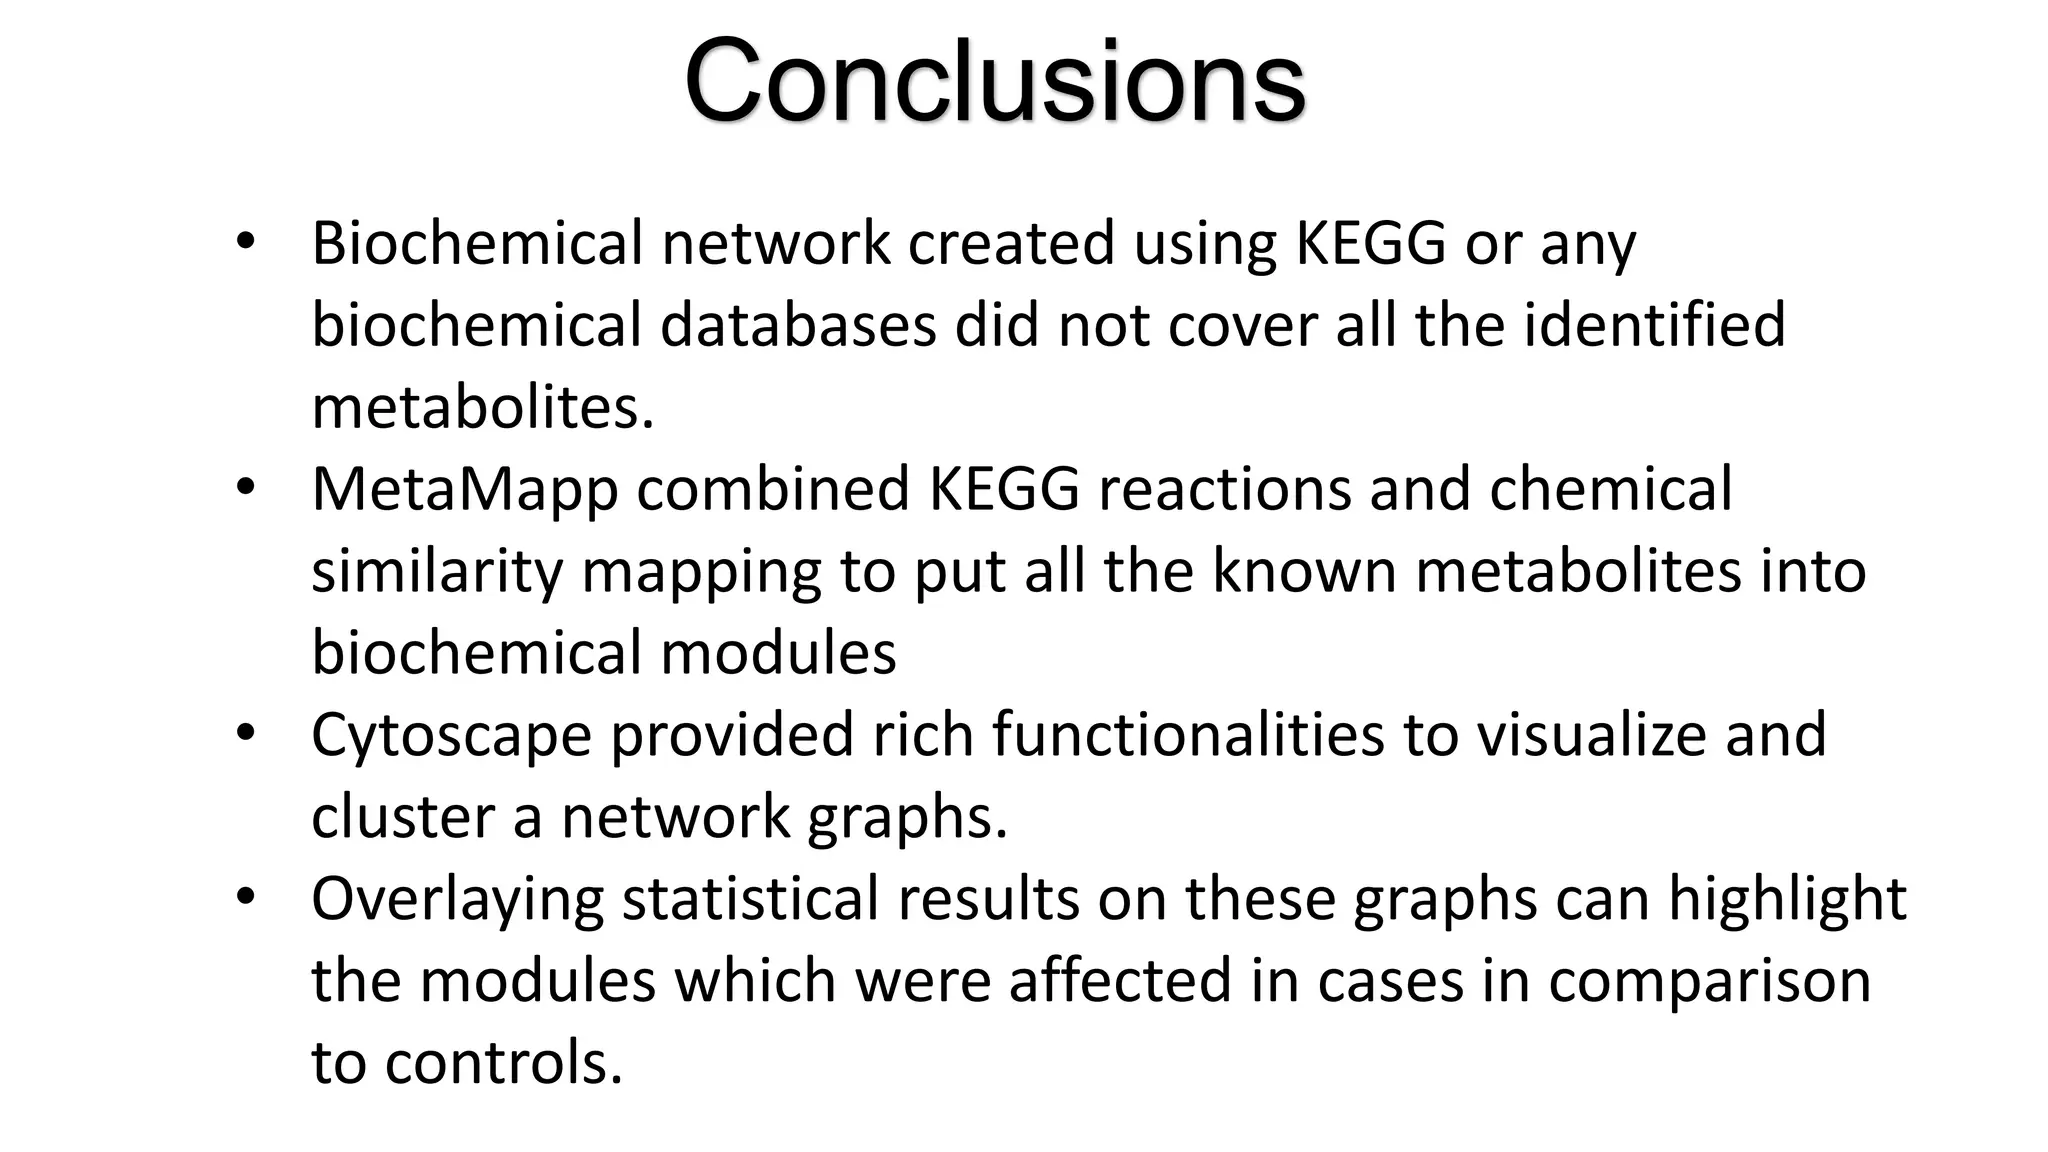
Conclusions
• Biochemical networkcreated using KEGG or any
biochemical databases did not cover all the identified
metabolites.
• MetaMapp combined KEGG reactions and chemical
similarity mapping to put all the known metabolites into
biochemical modules
• Cytoscape provided rich functionalities to visualize and
cluster a network graphs.
• Overlaying statistical results on these graphs can highlight
the modules which were affected in cases in comparison
to controls.
Editor's Notes
#8 Two representations of the EC 2.3.1.35 reaction. In this reaction, the acetyl moiety of N-acetyl l-ornithine is transferred to l-glutamate to form N-acetyl l-glutamate. (Lower Left) In the scheme of Jeong et al. (7), its two substrates and two products are equally linked to the object representing the EC number, irrespective of their structural changes. (Lower Right) In our scheme, conserved substructural moieties, coded by color, are computationally detected, and each link is associated with the information of which atom goes where.