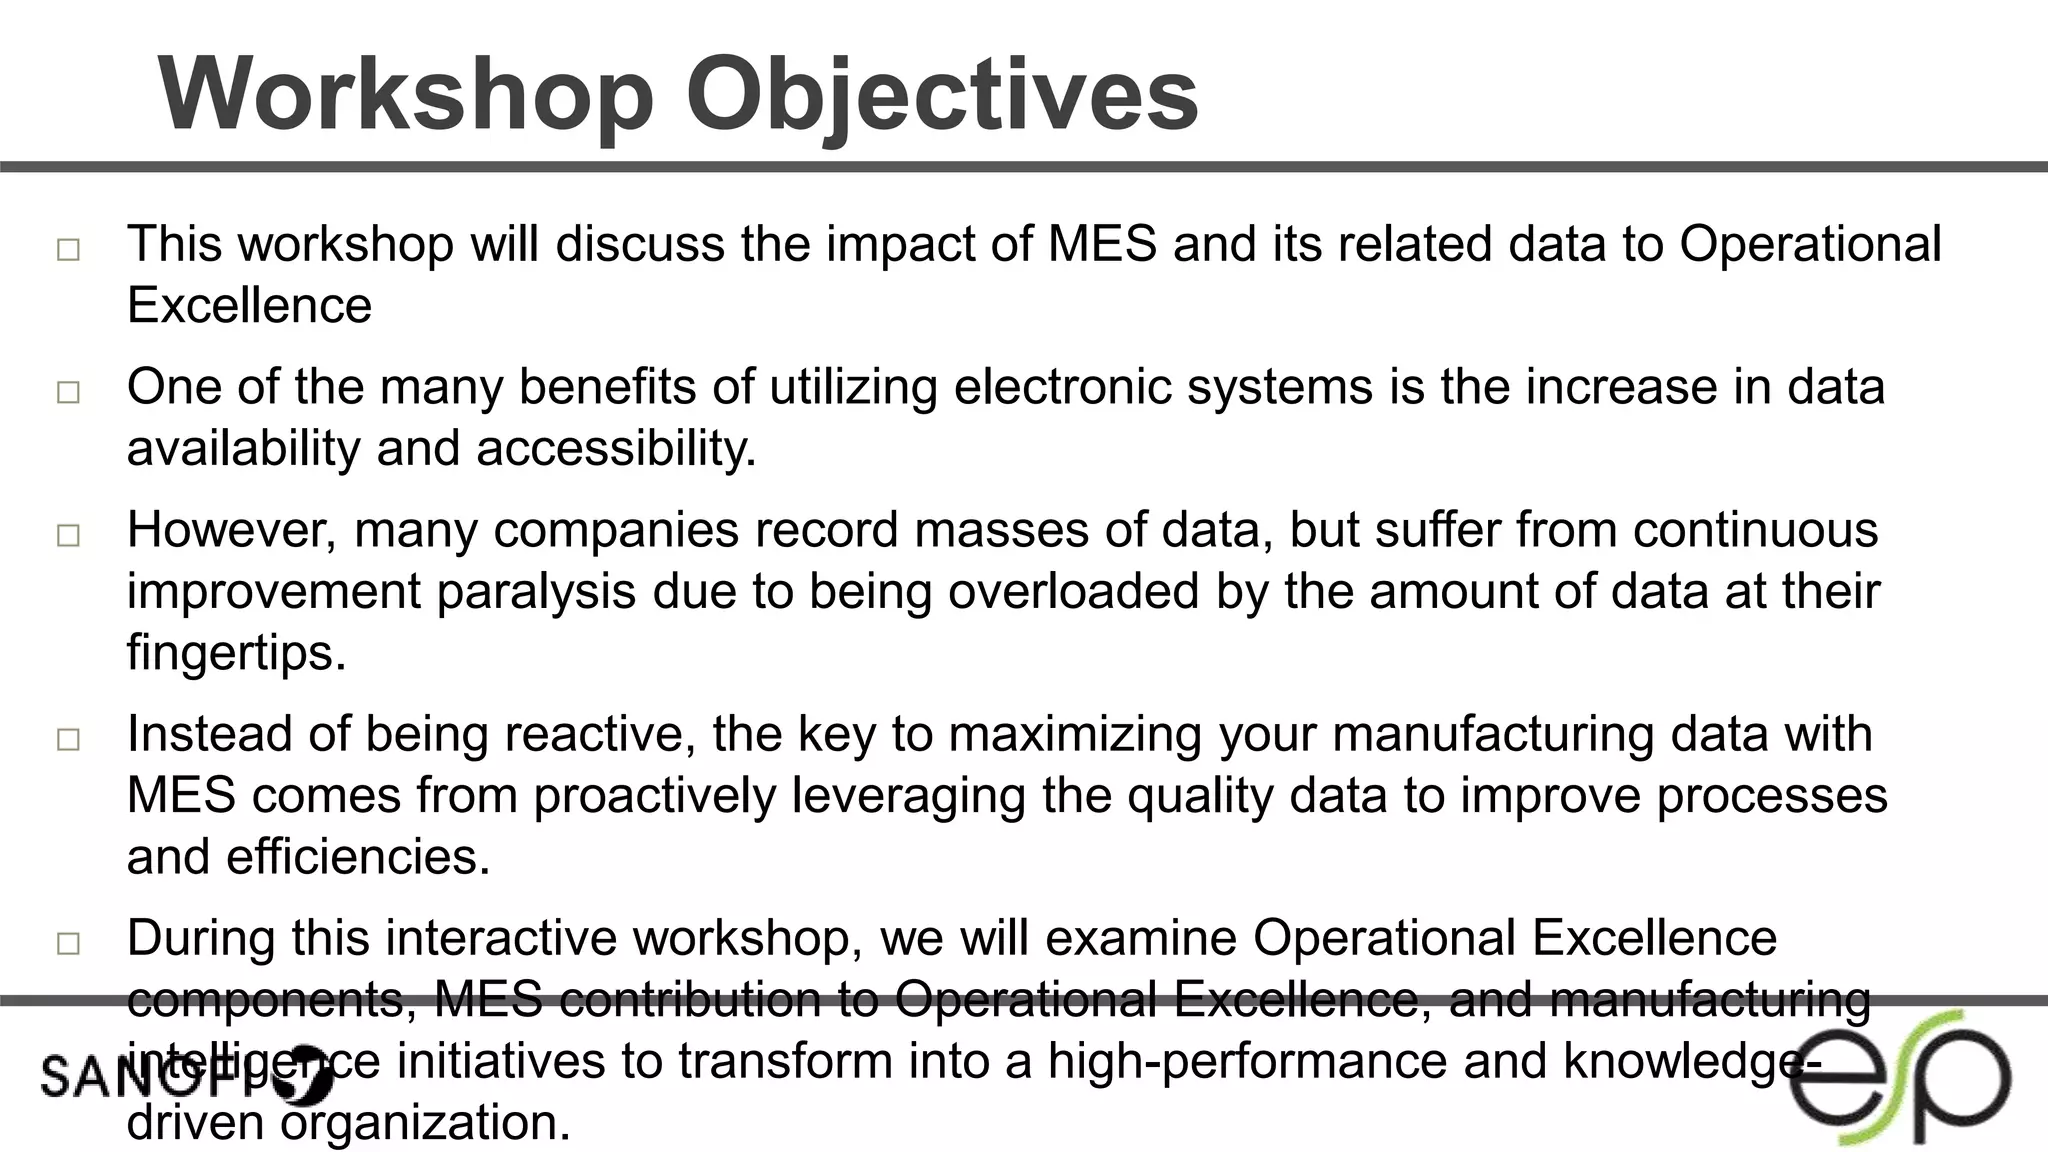
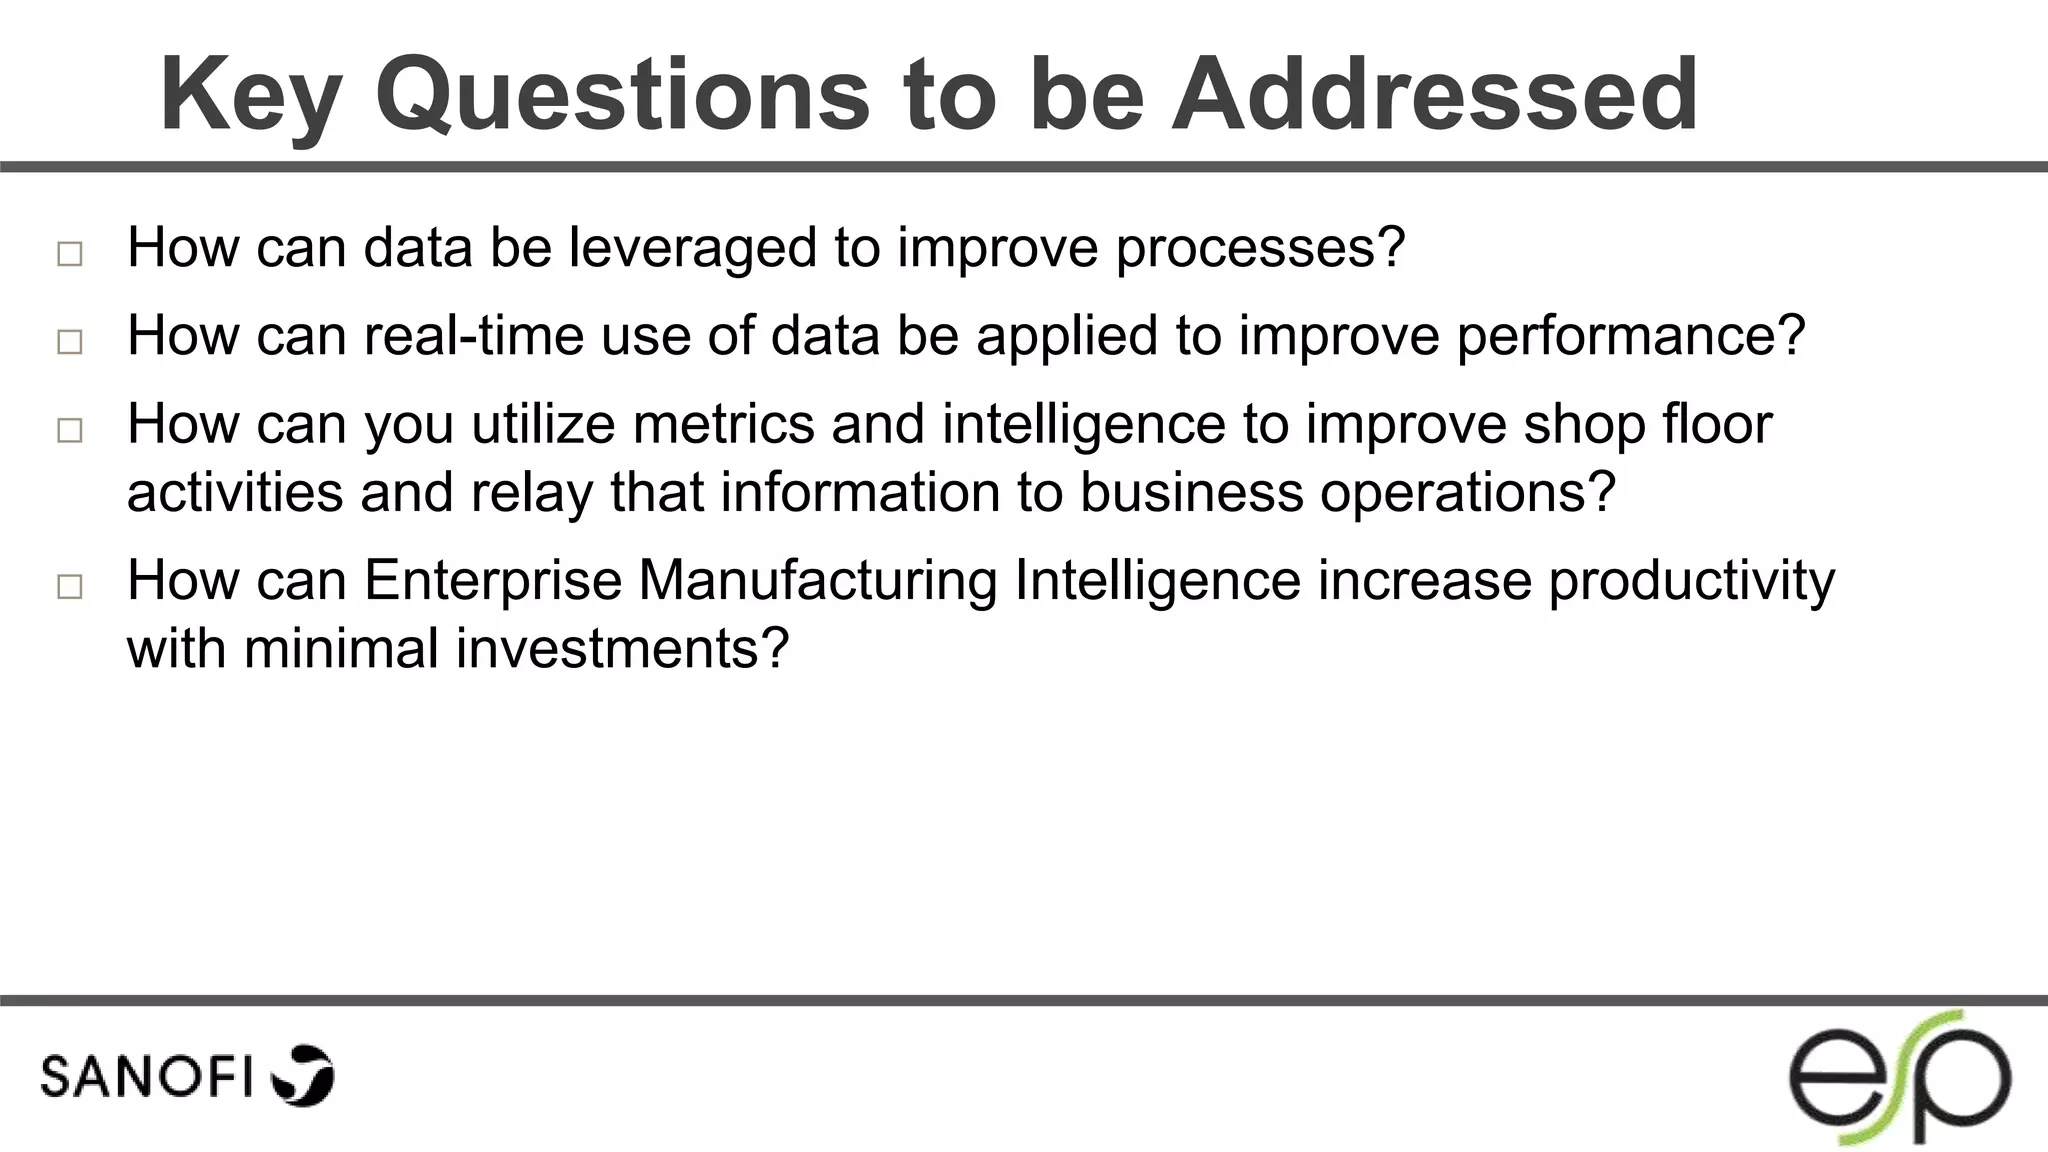
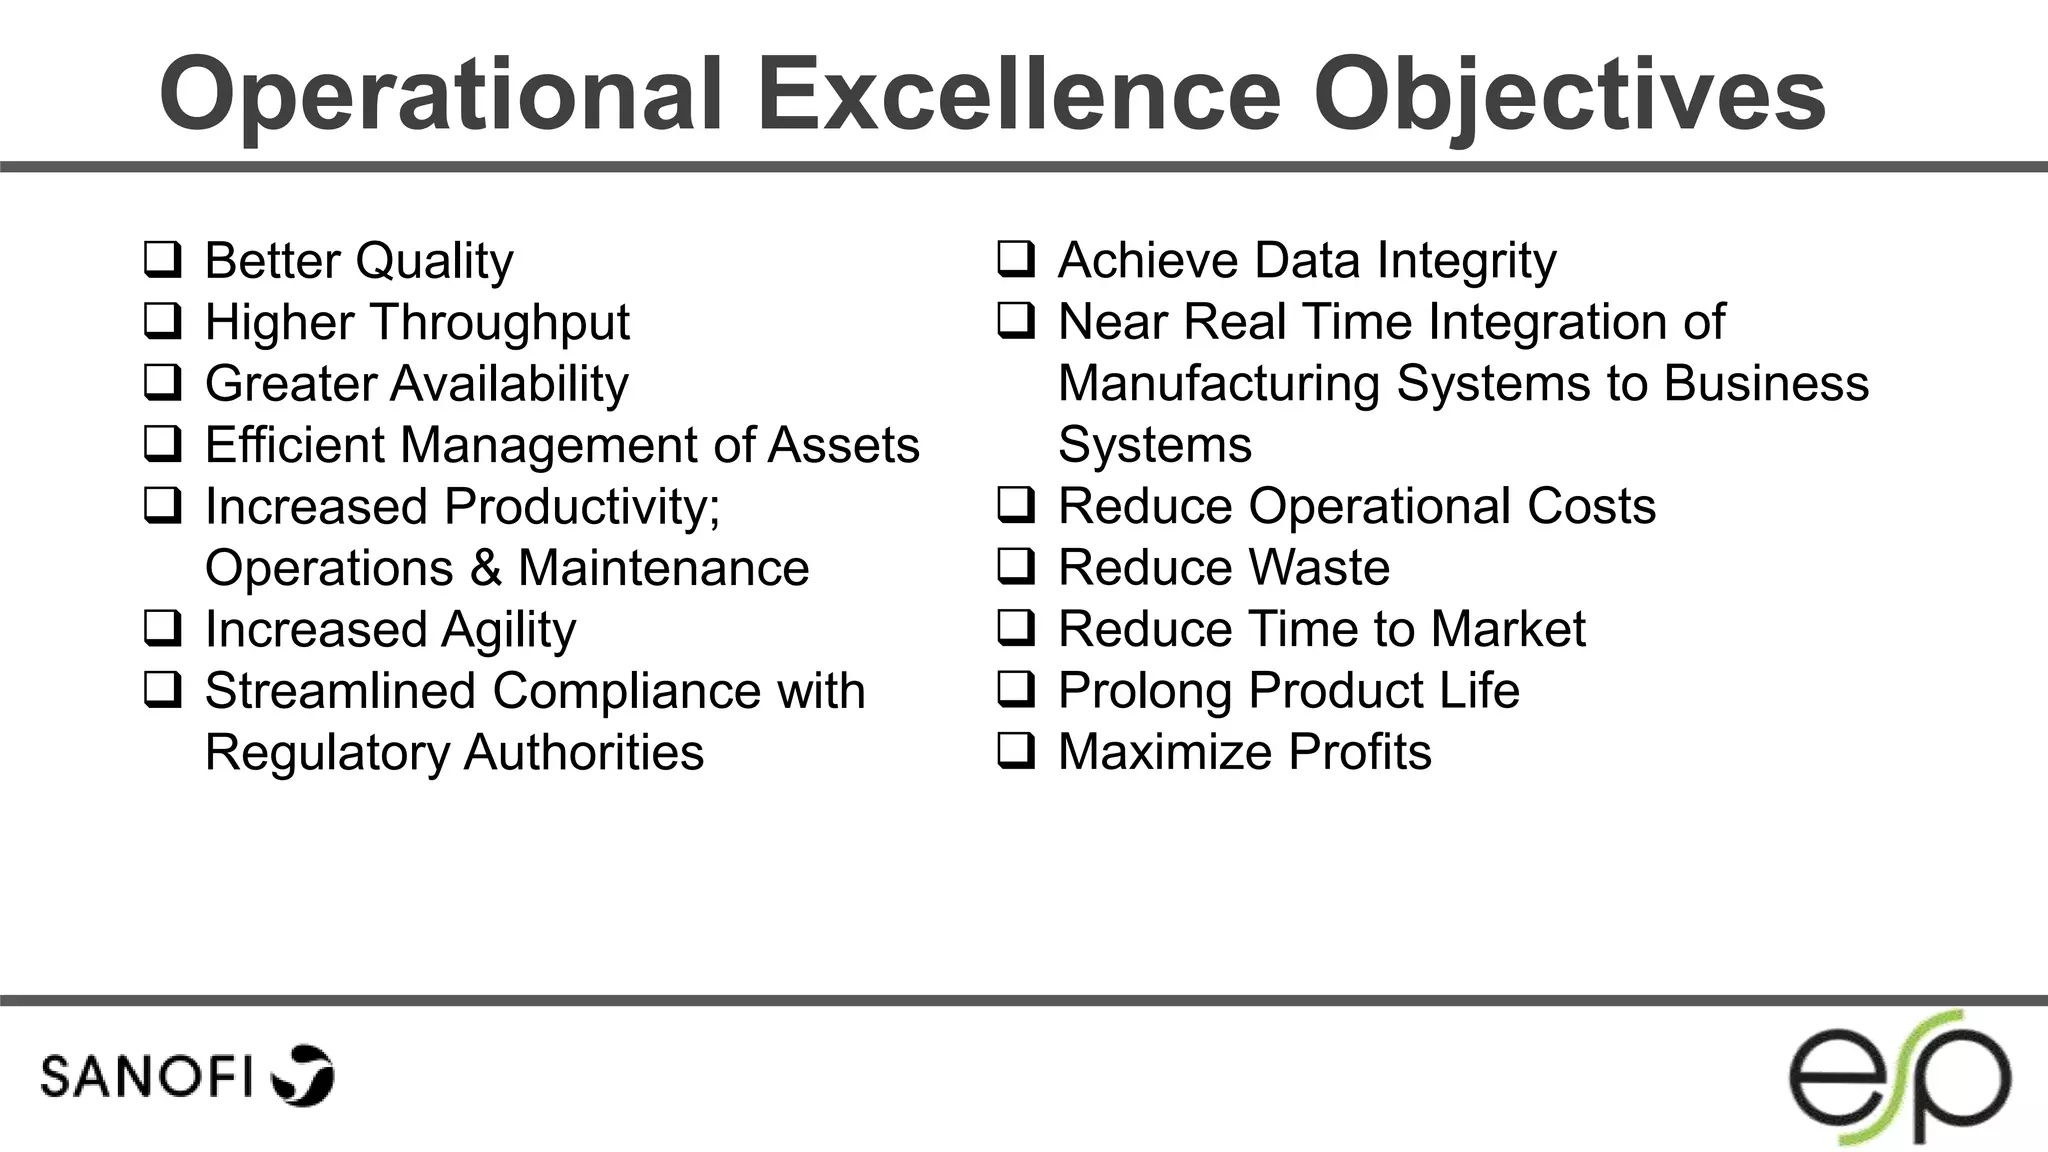
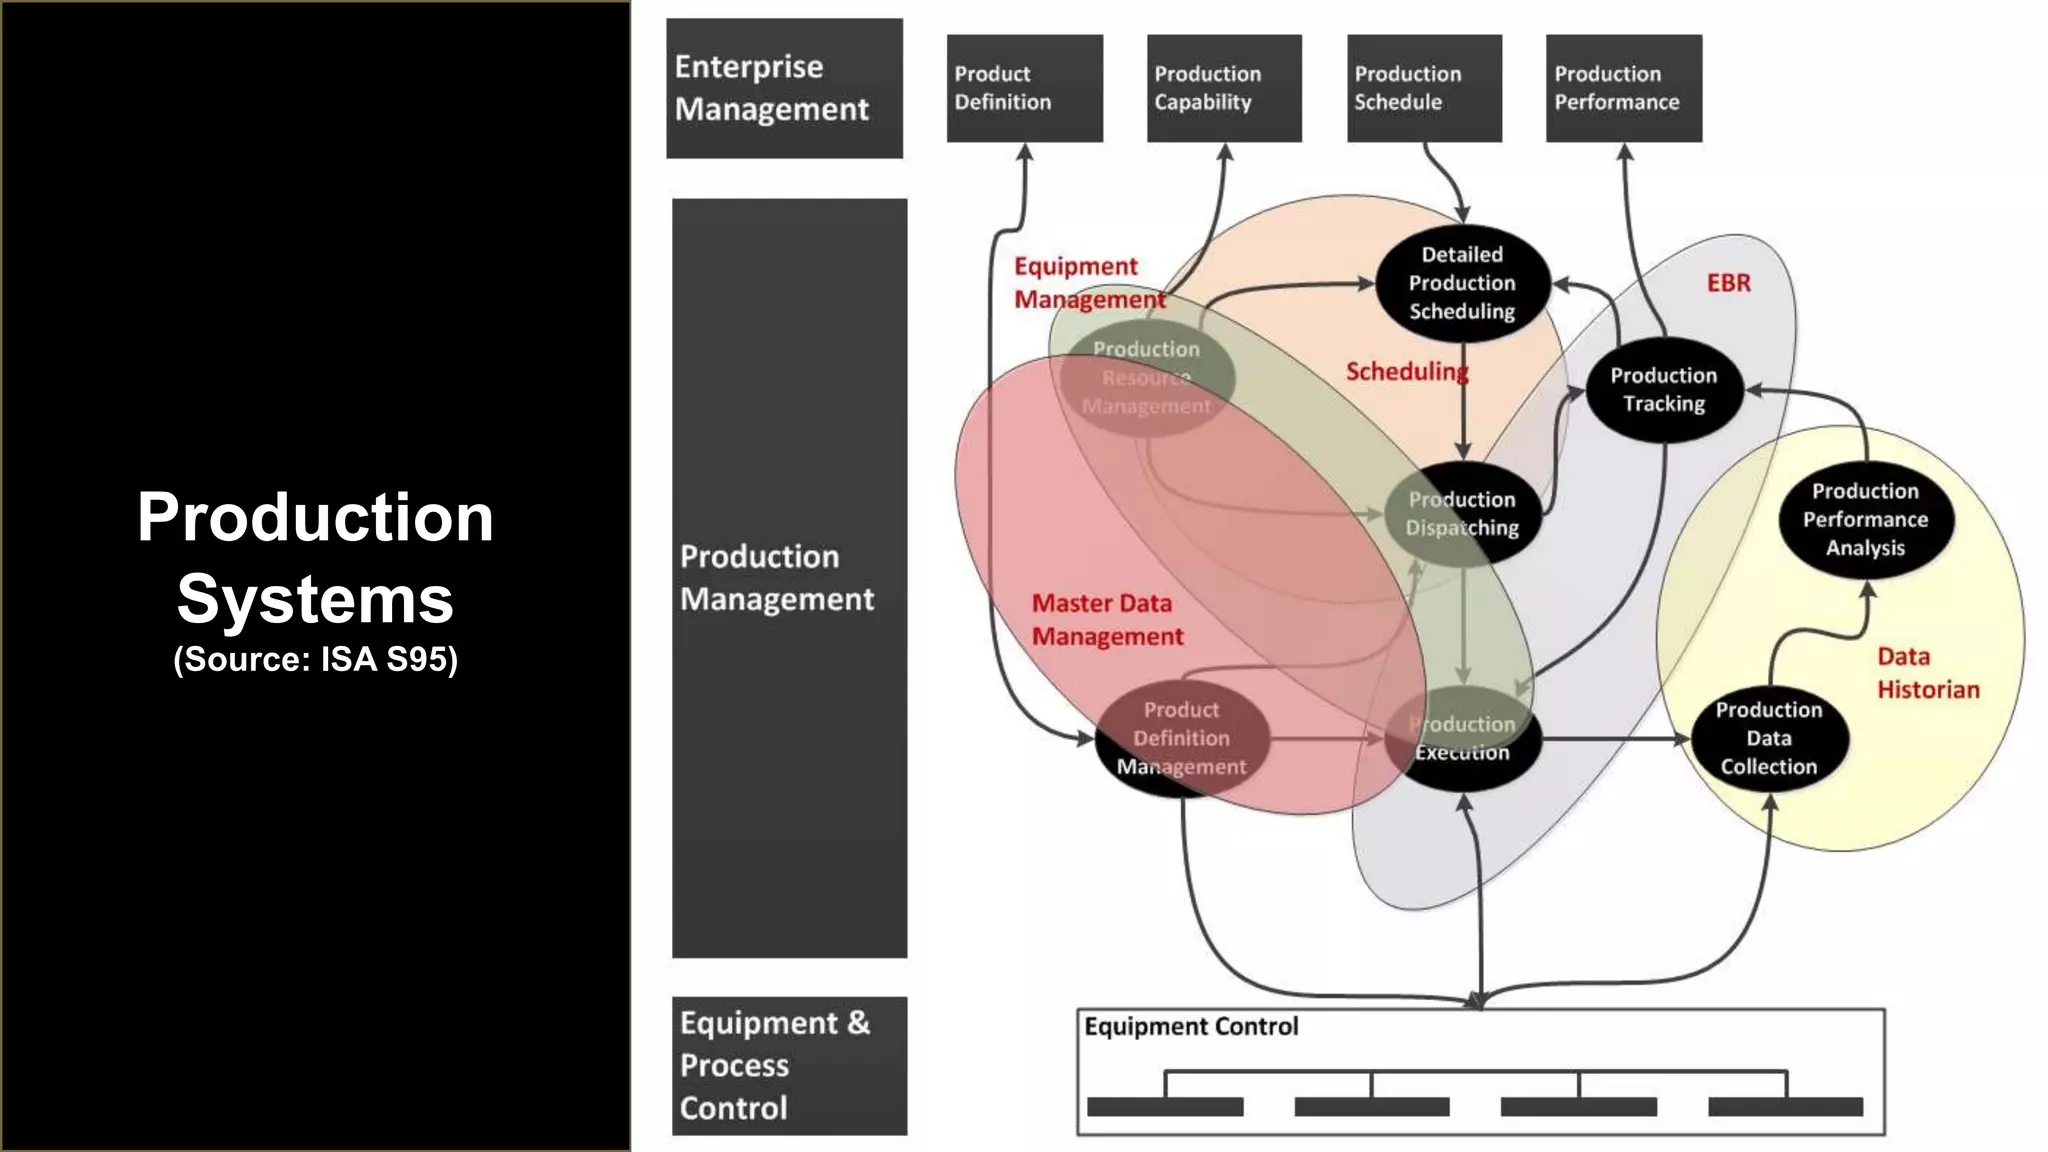
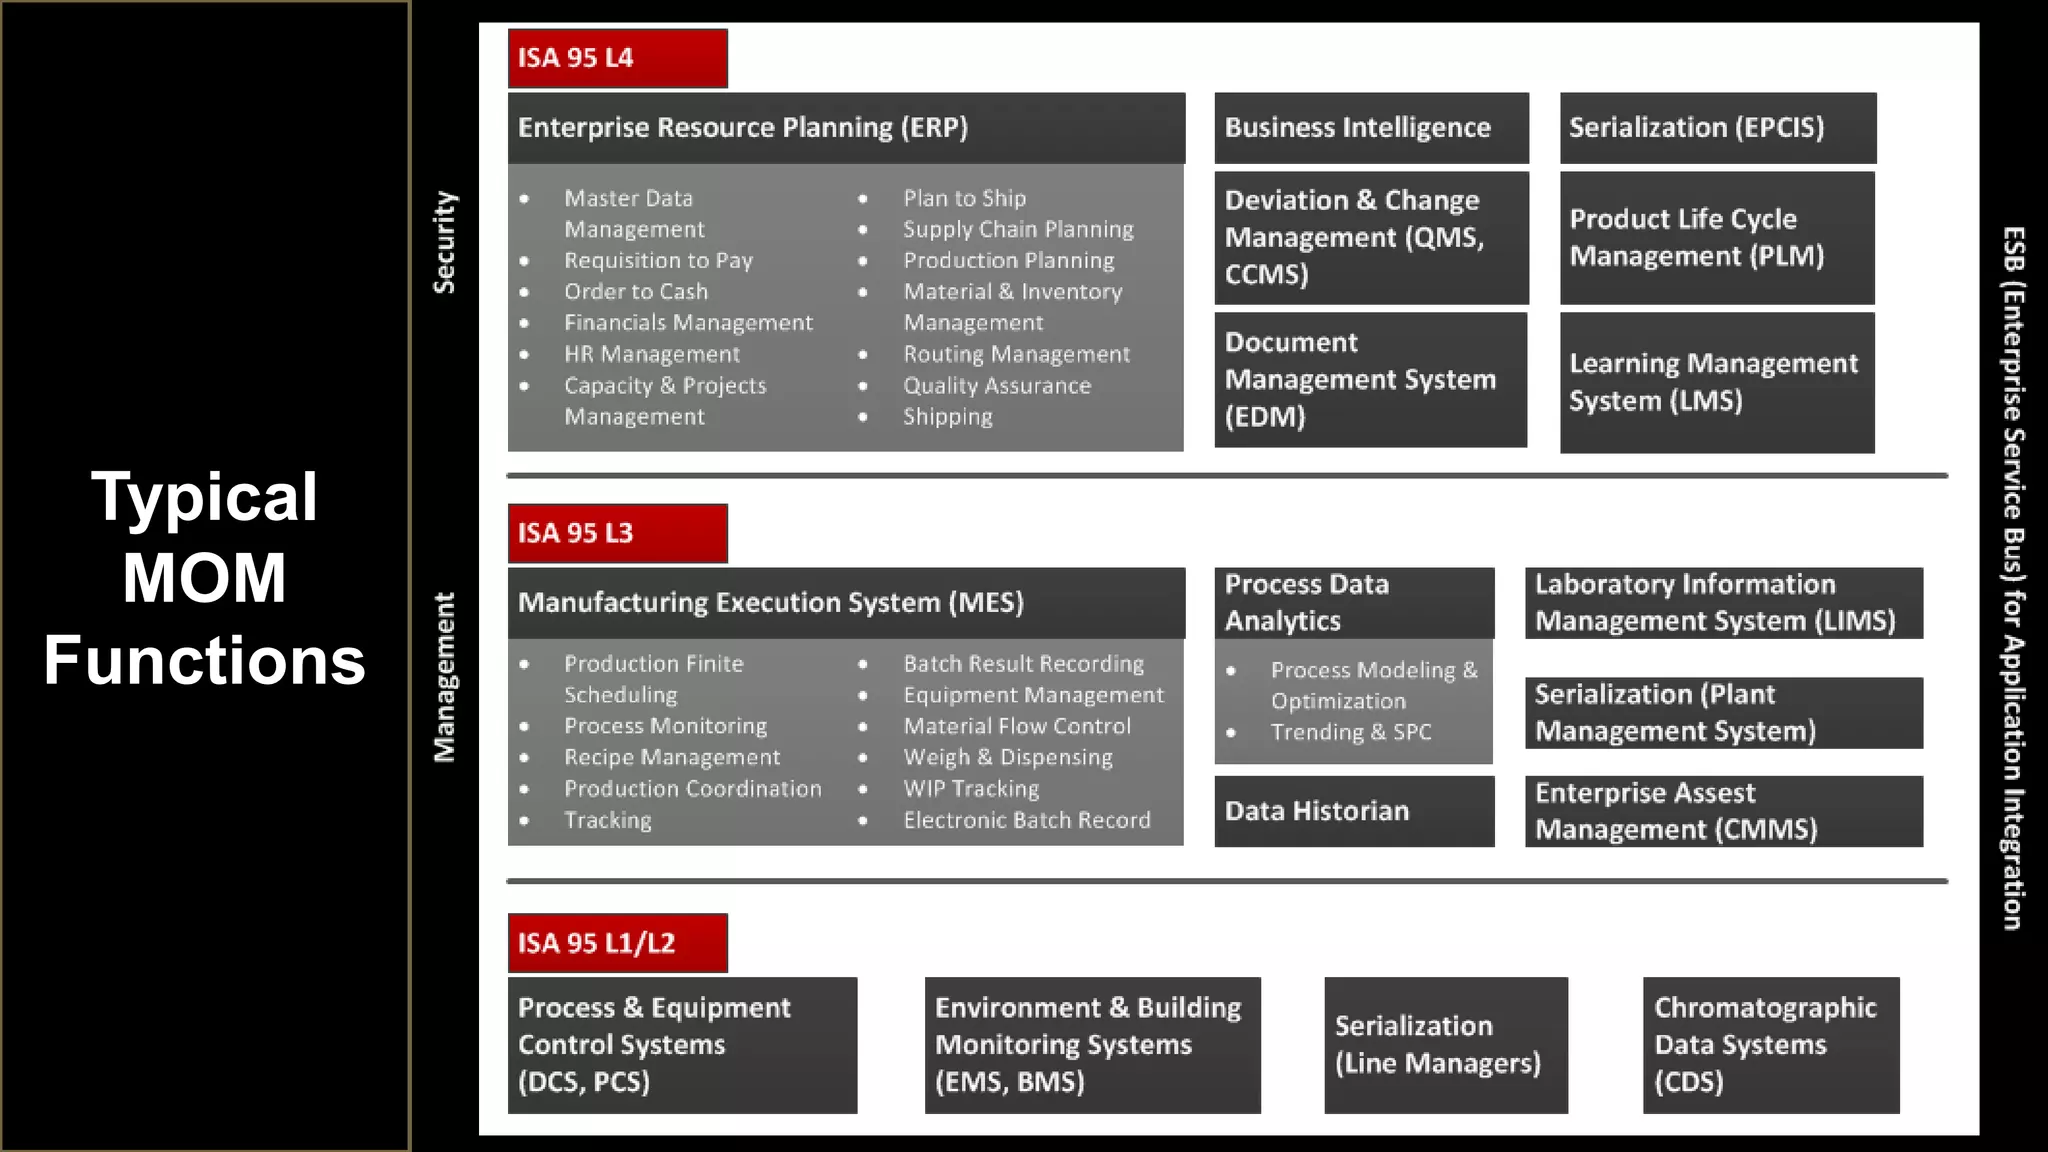
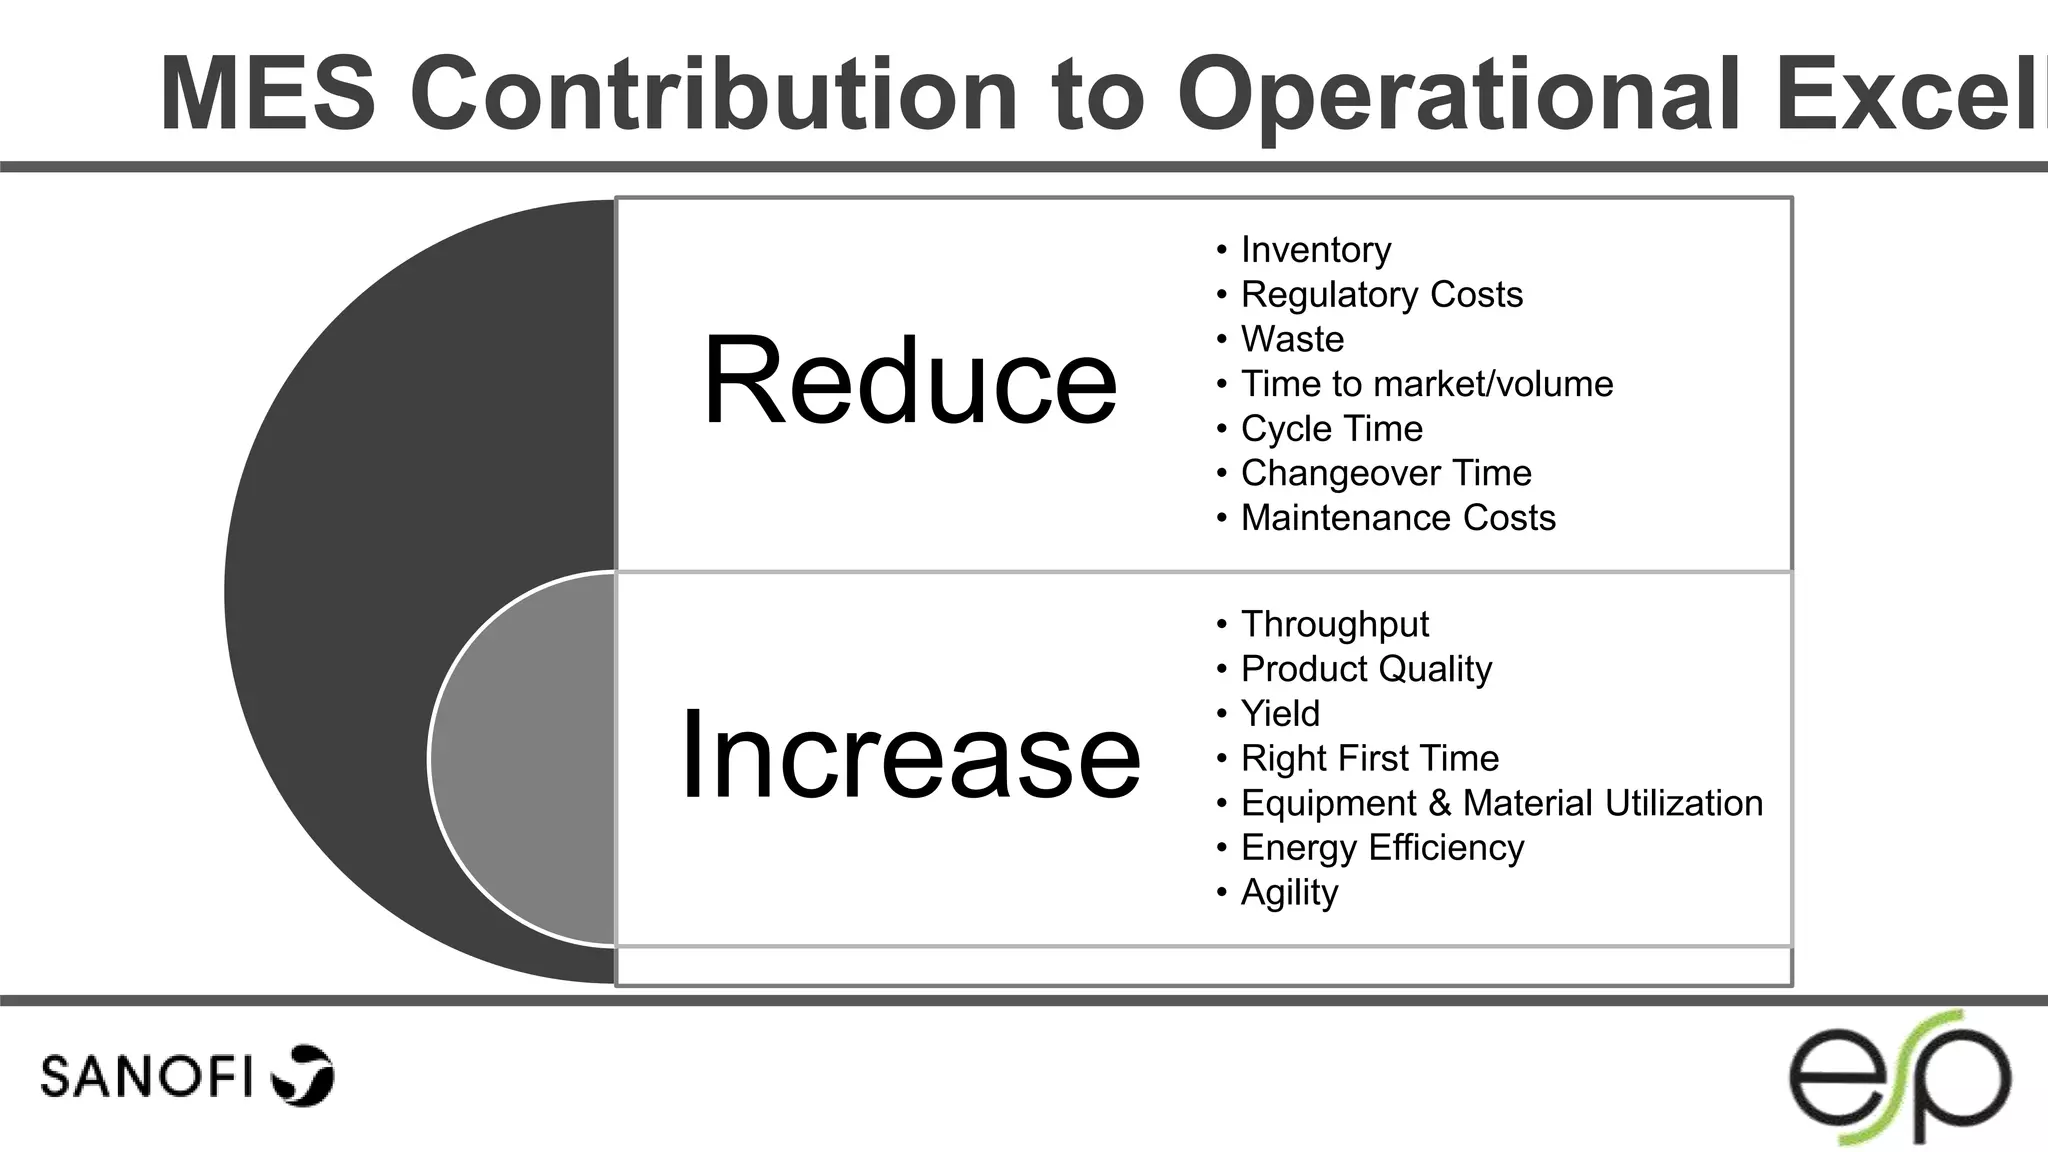
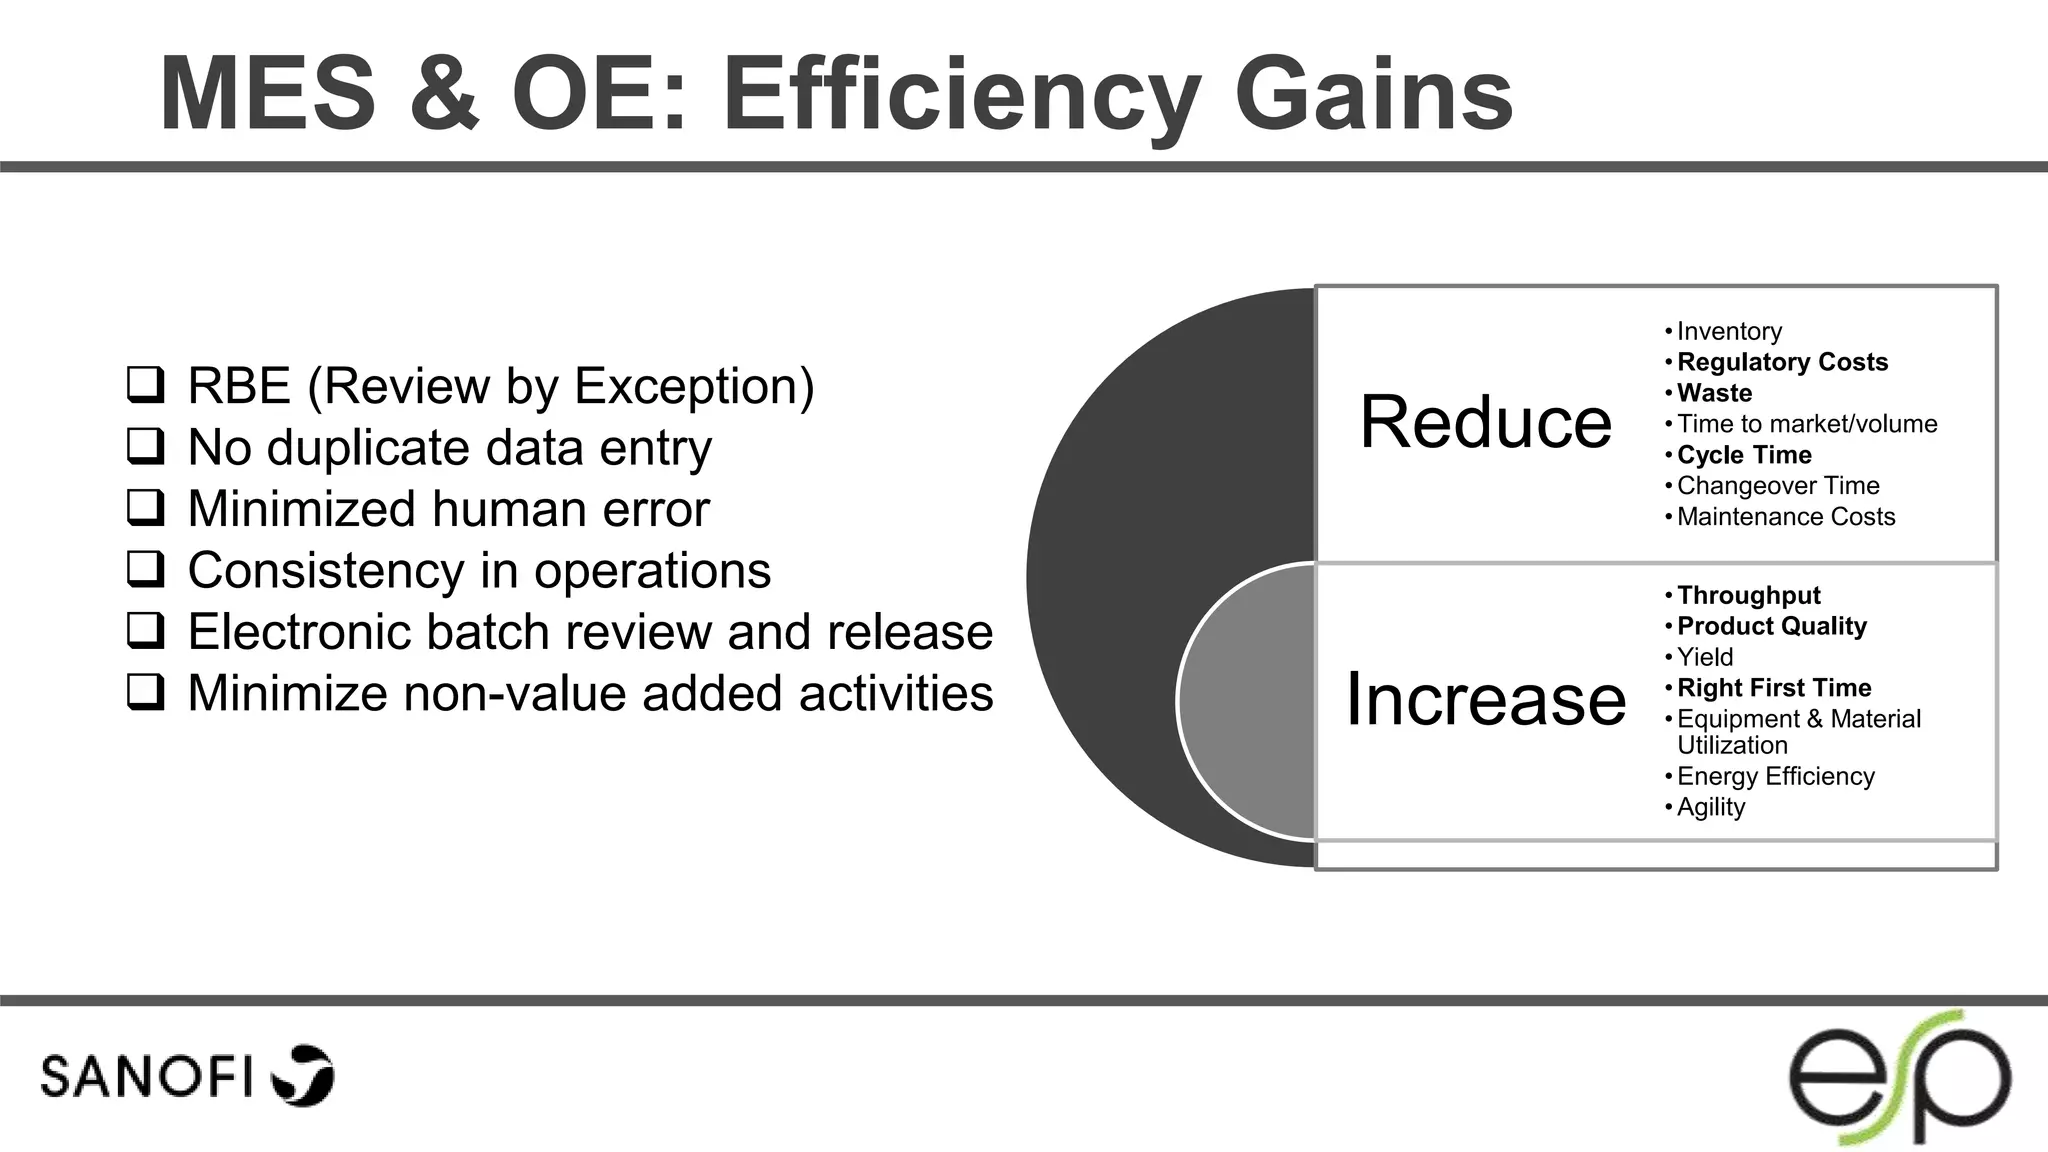
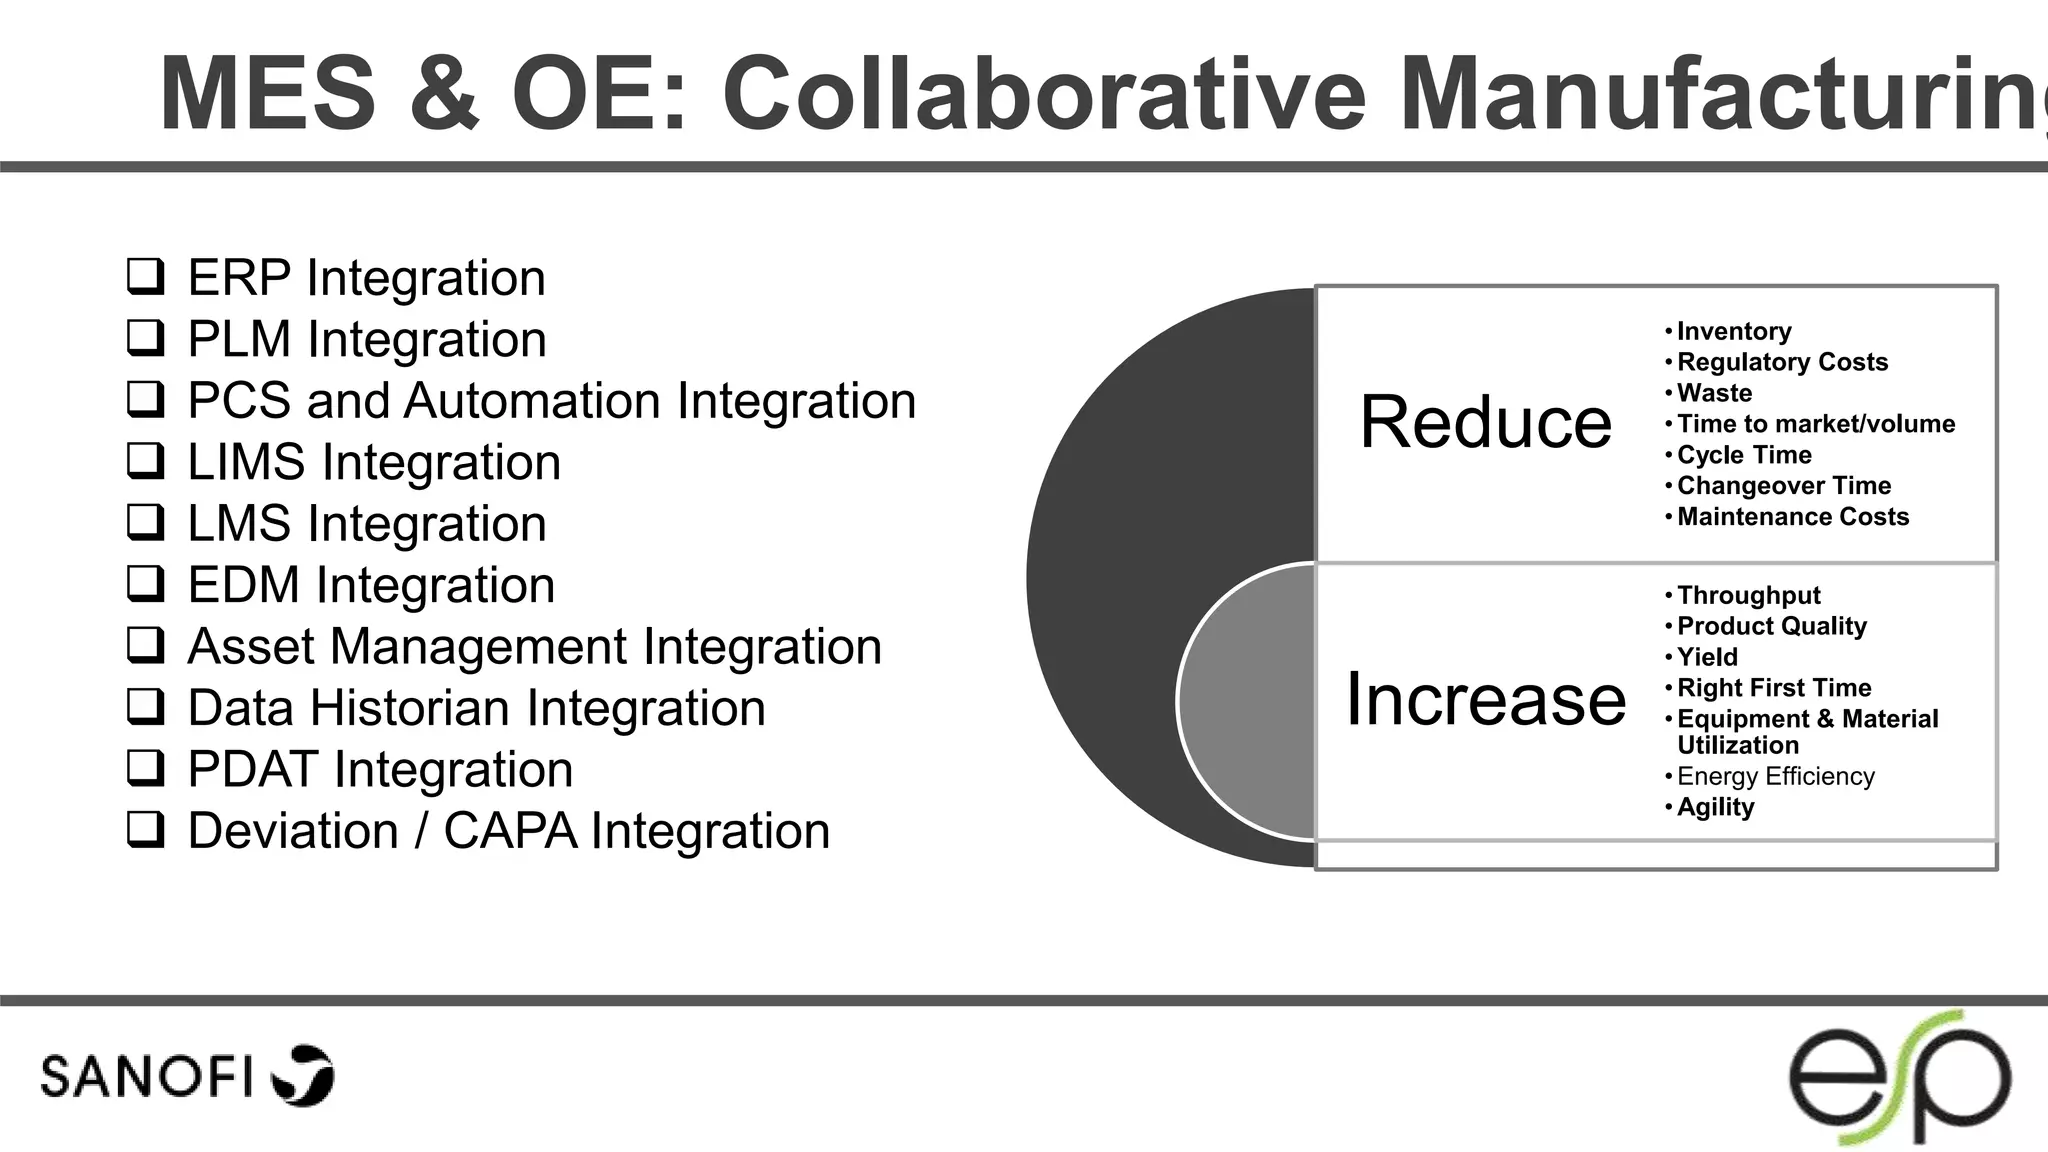
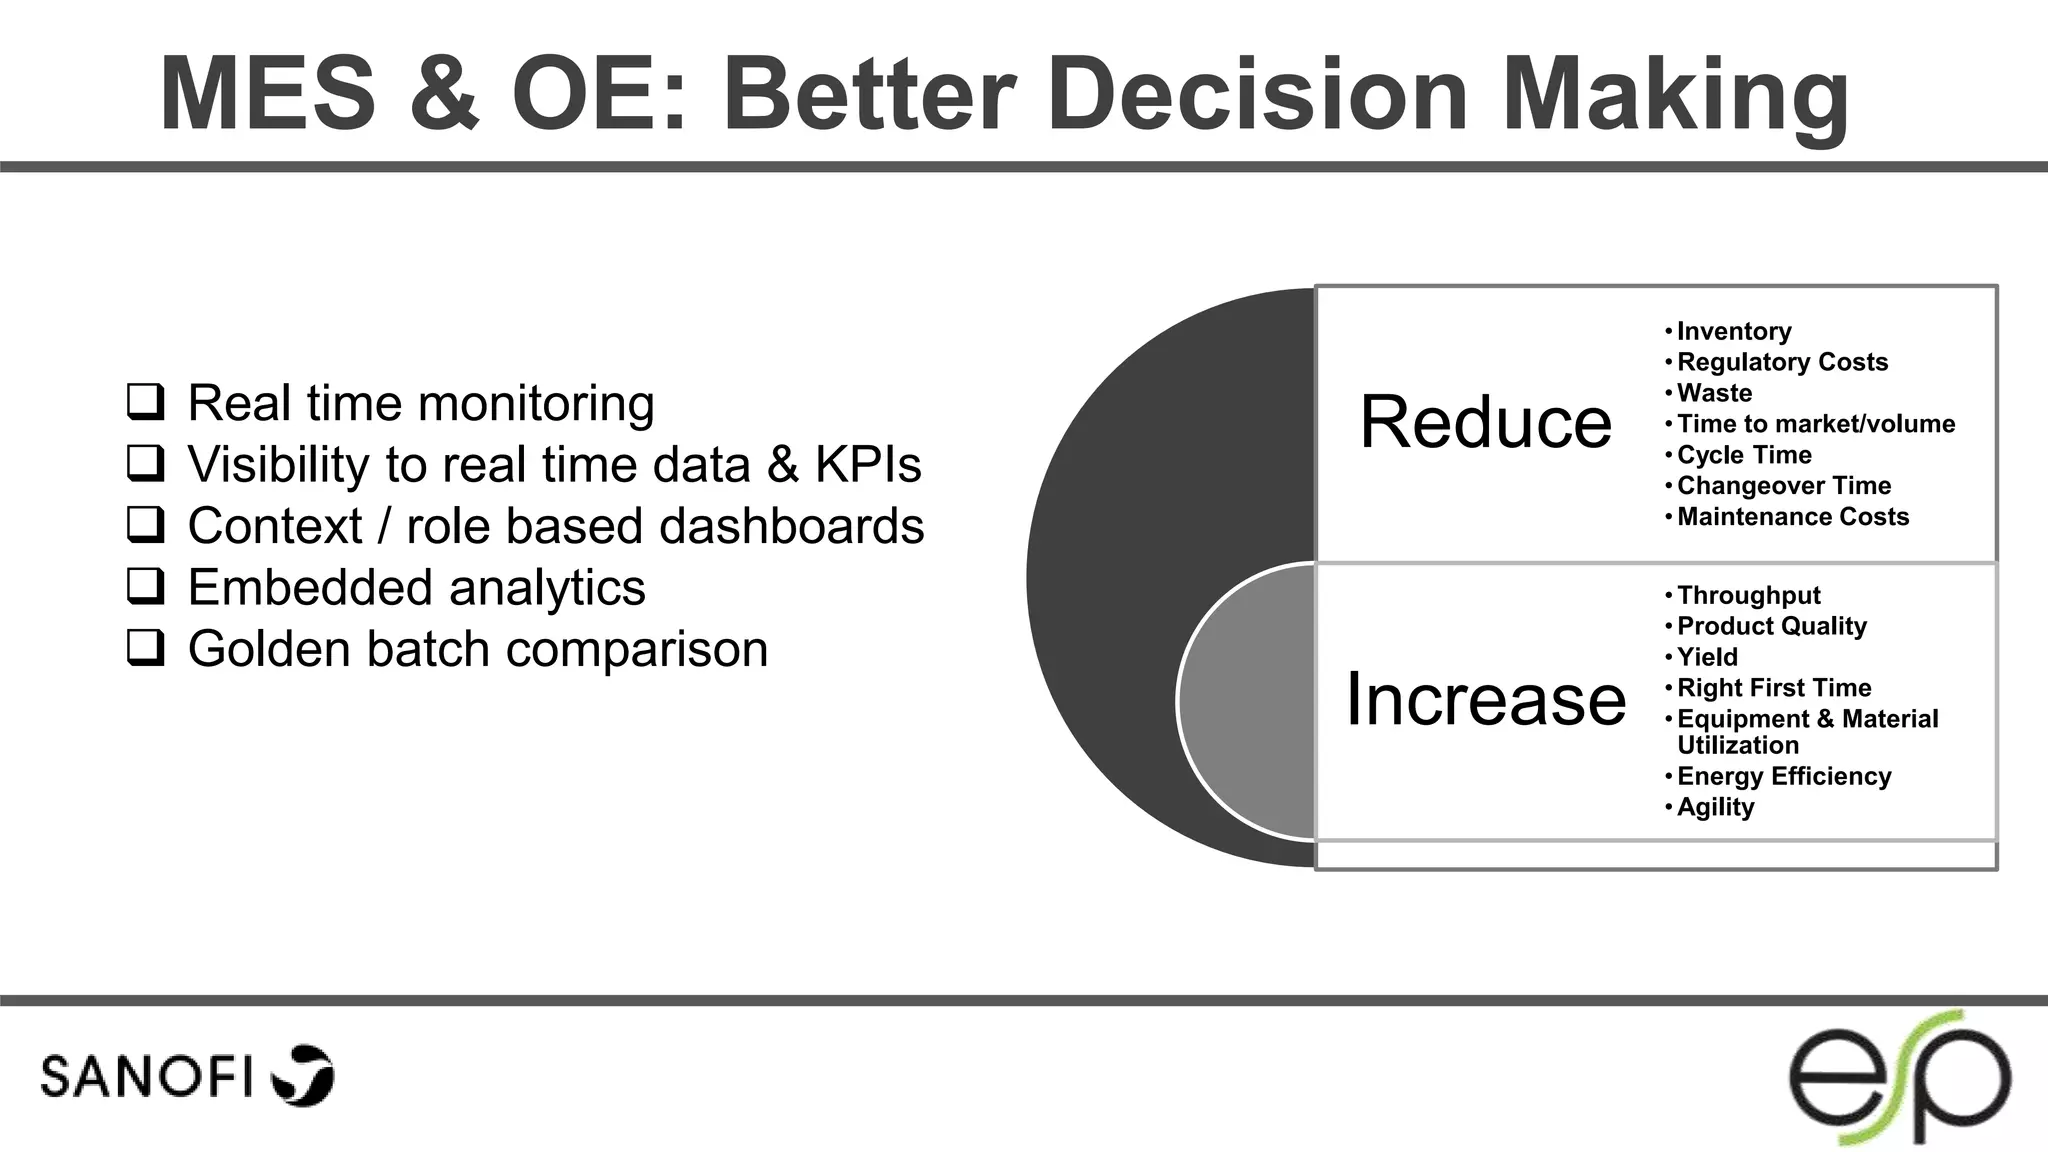
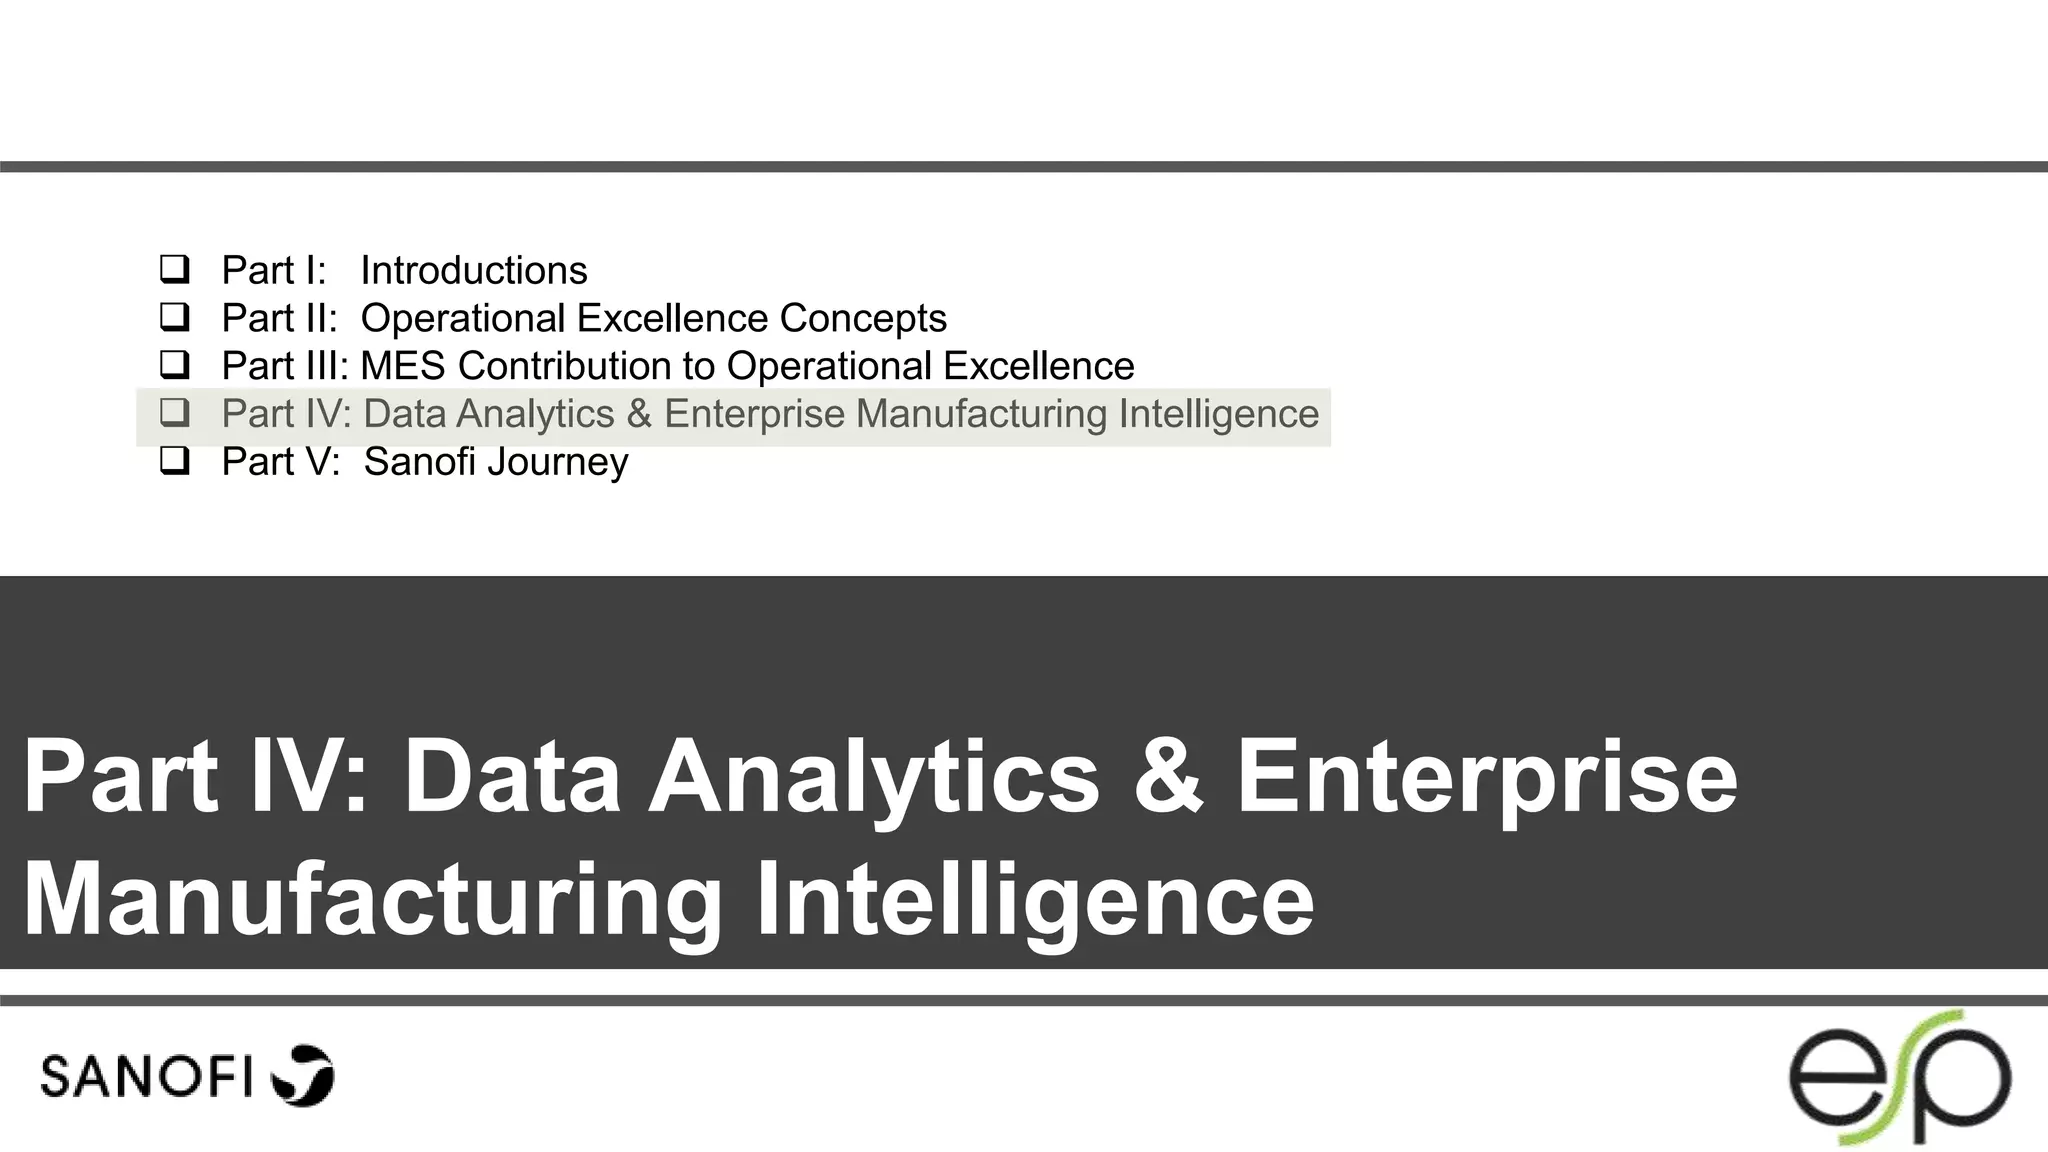
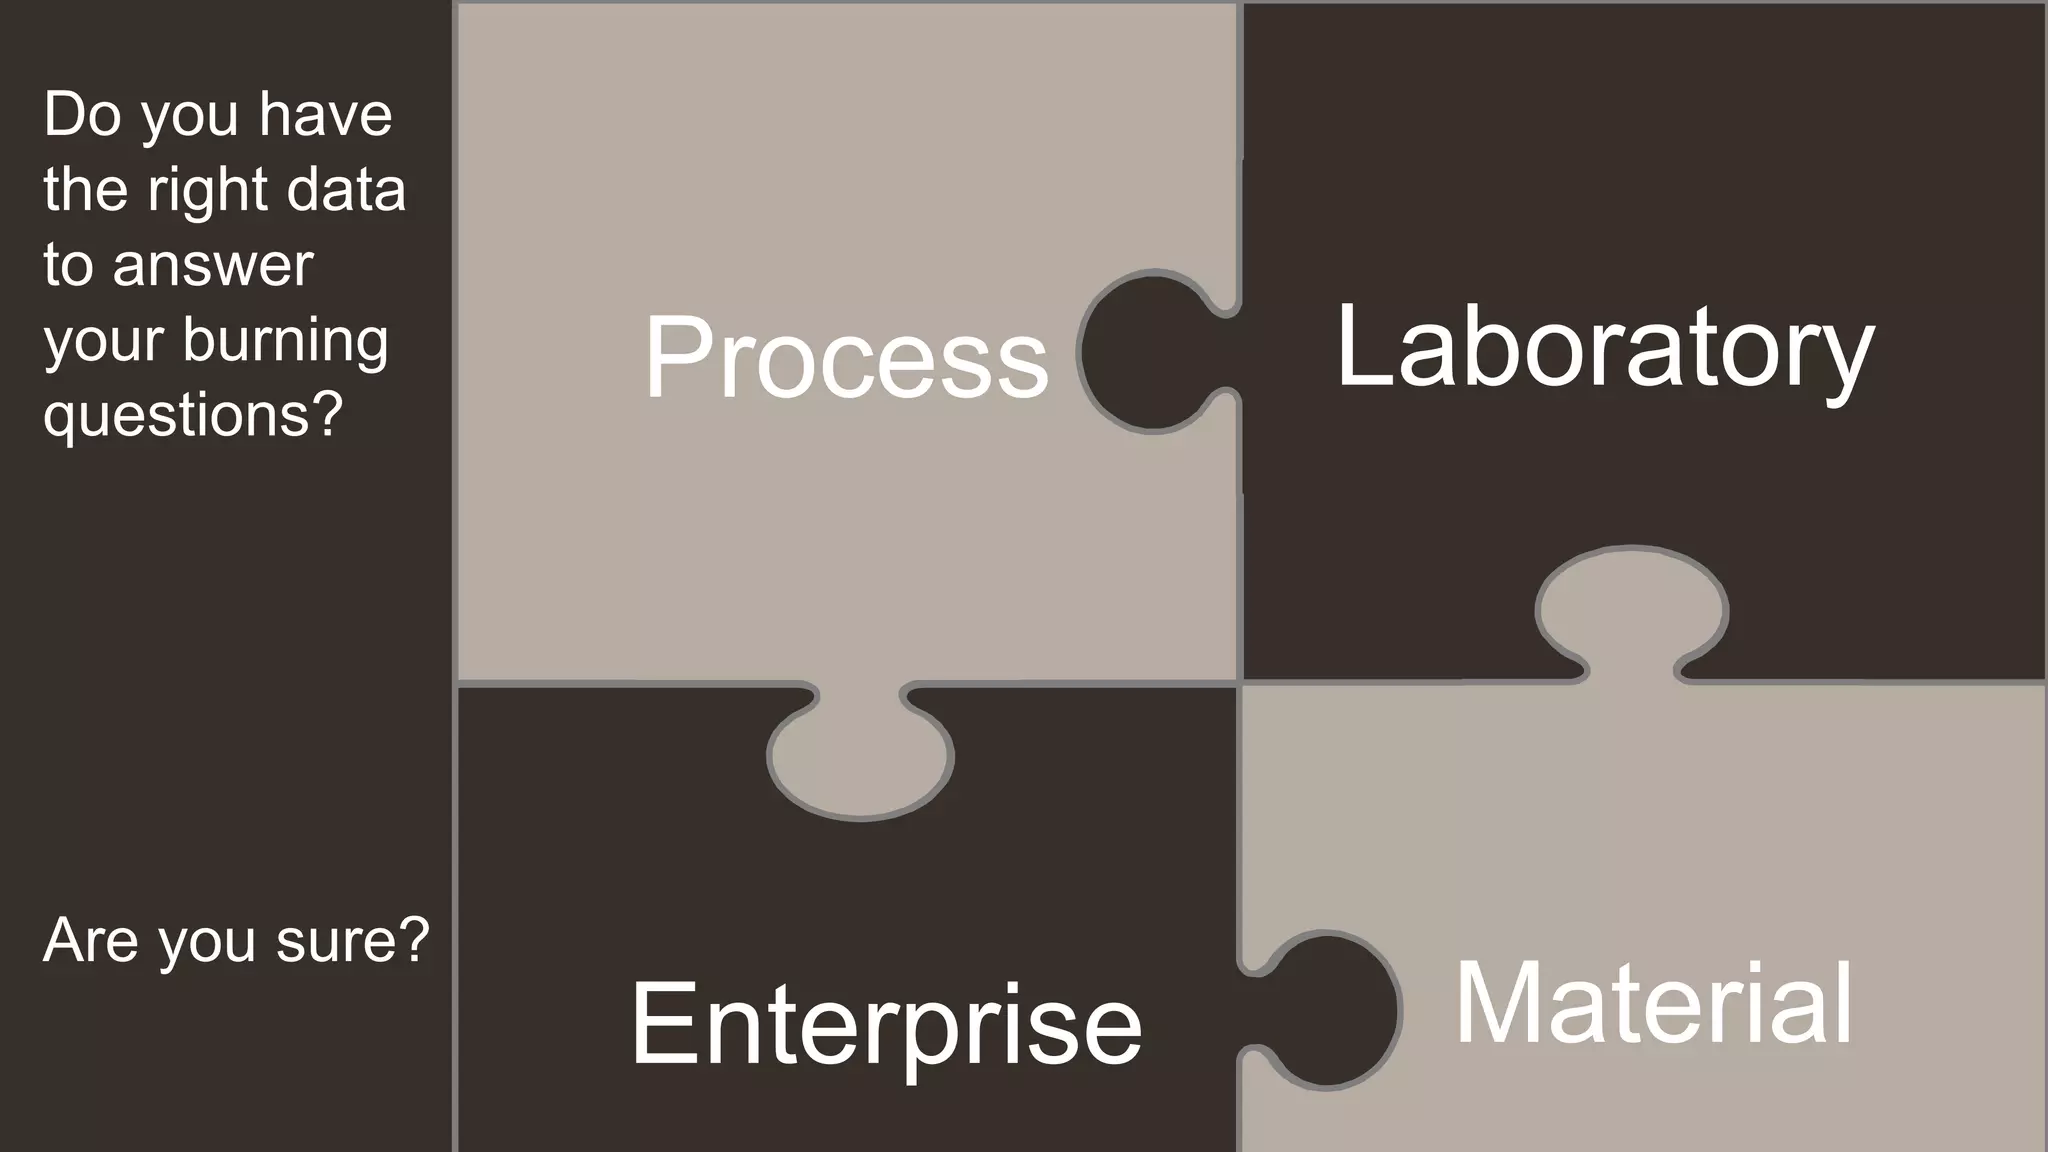
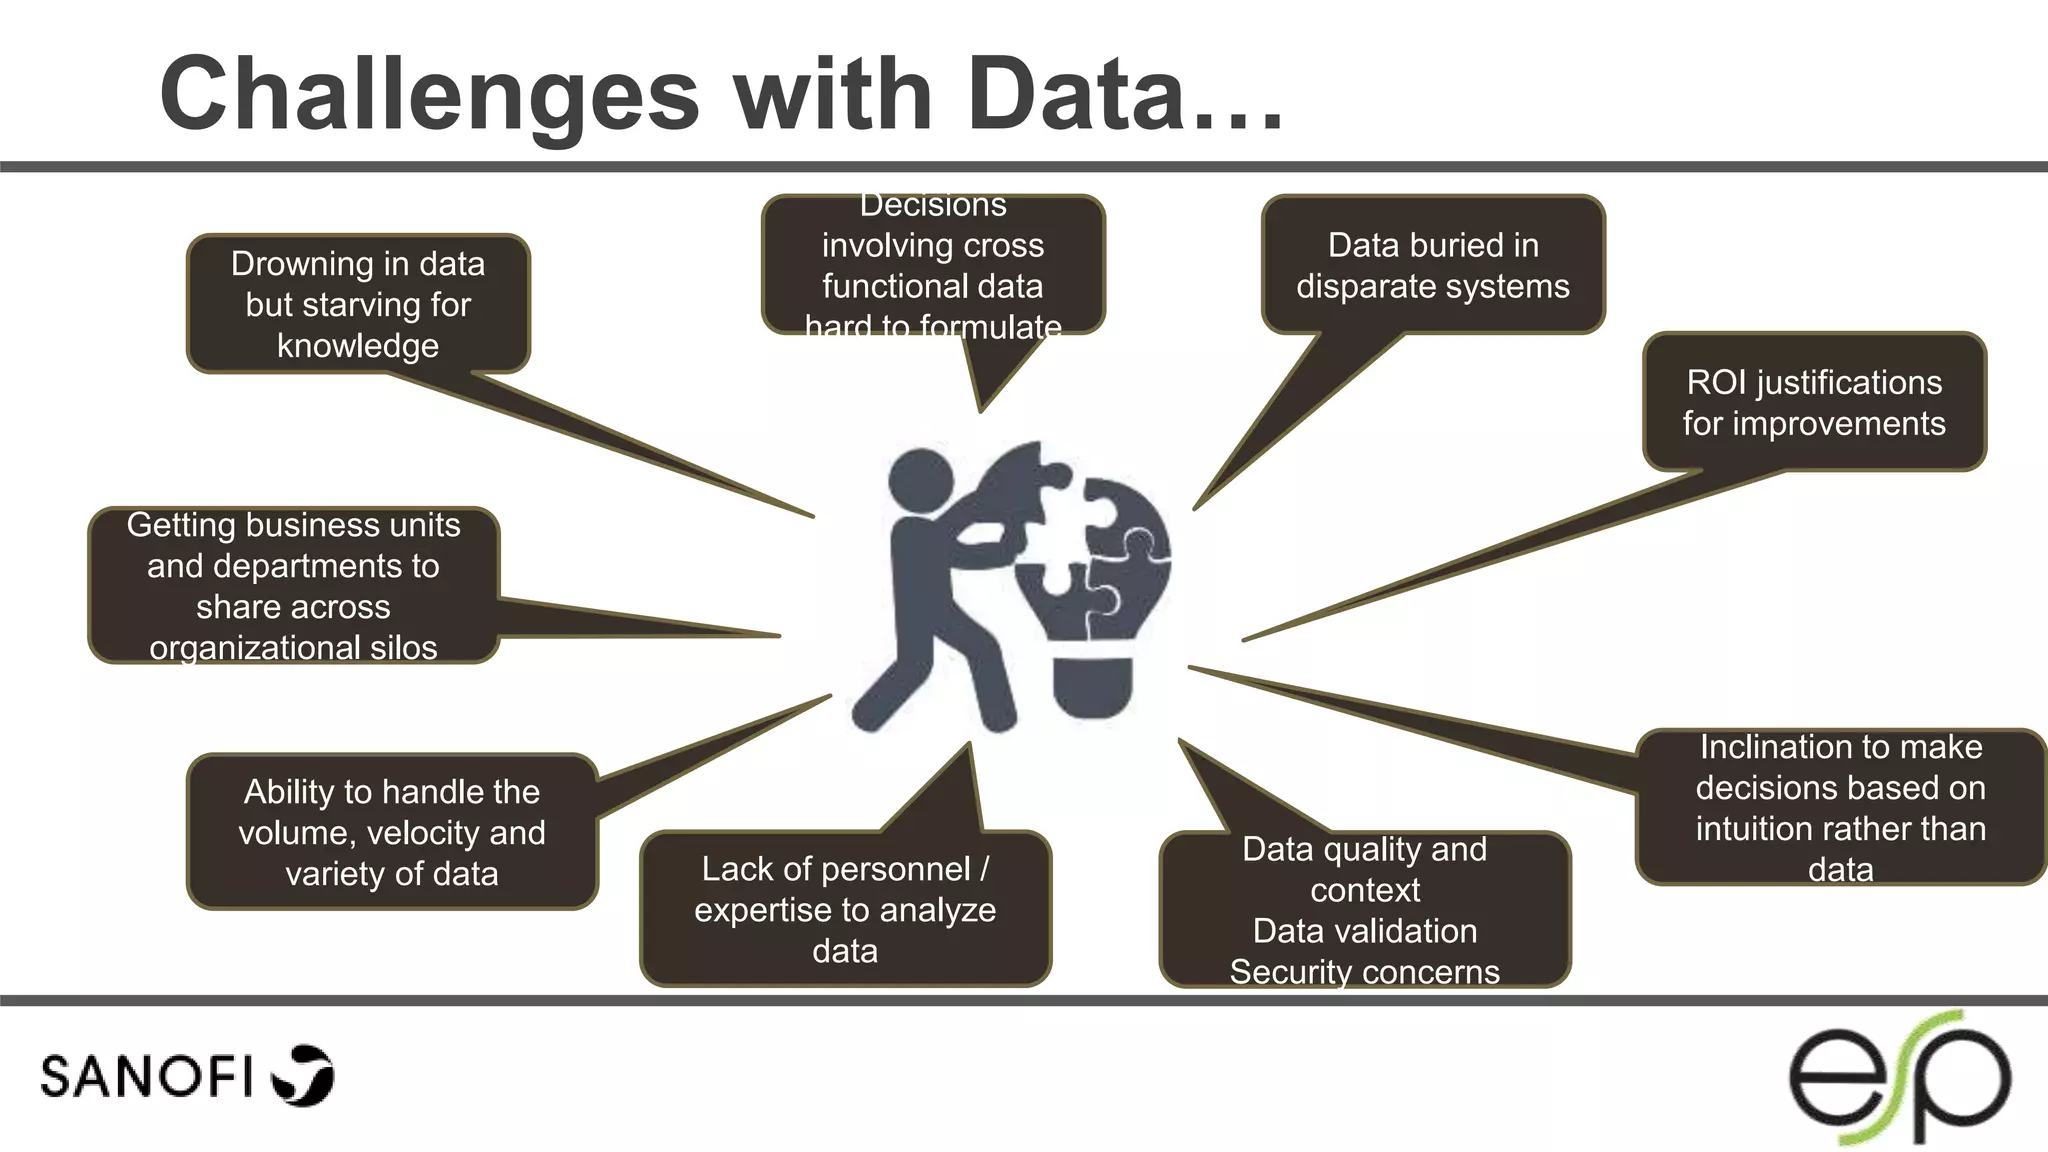
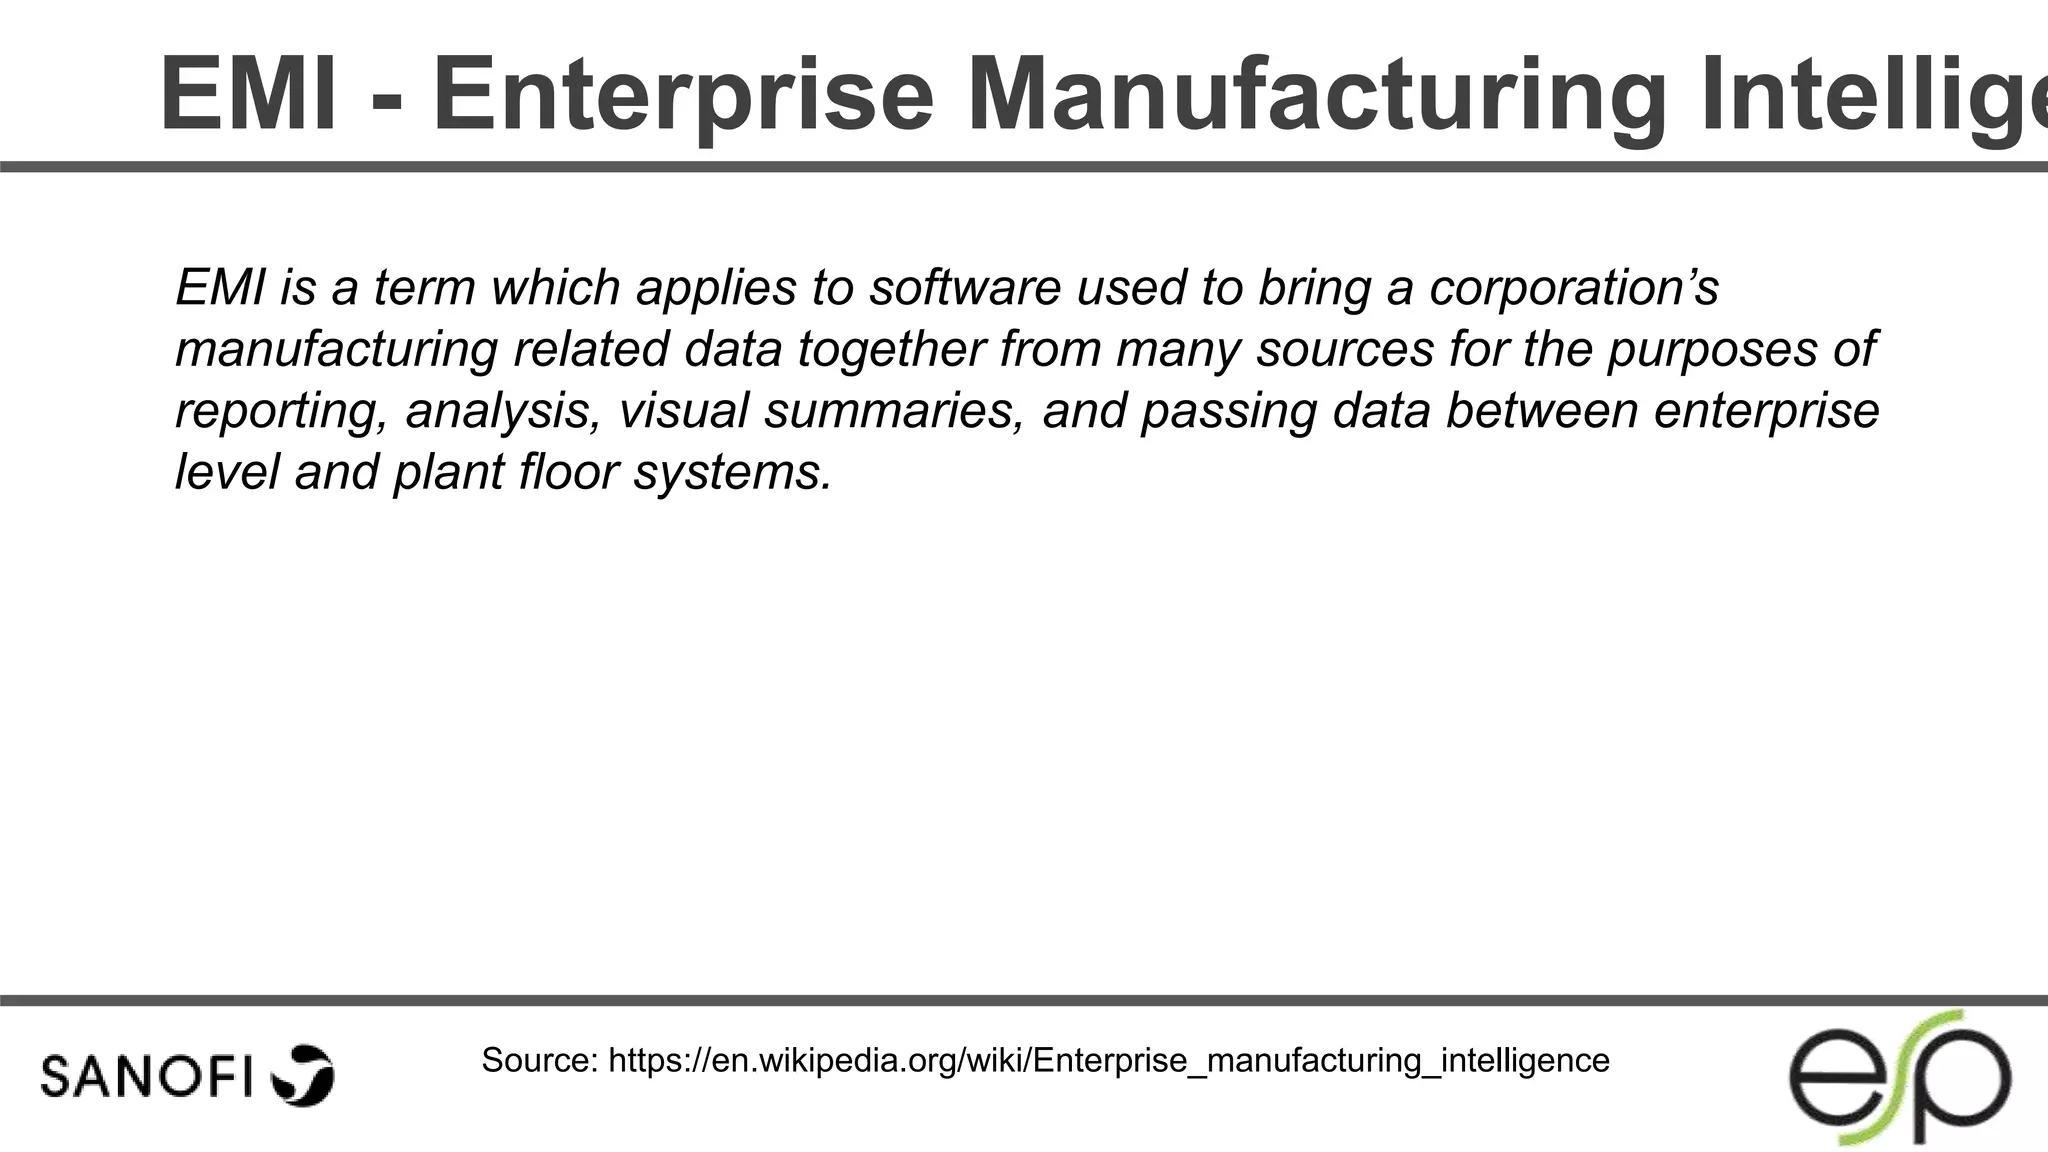
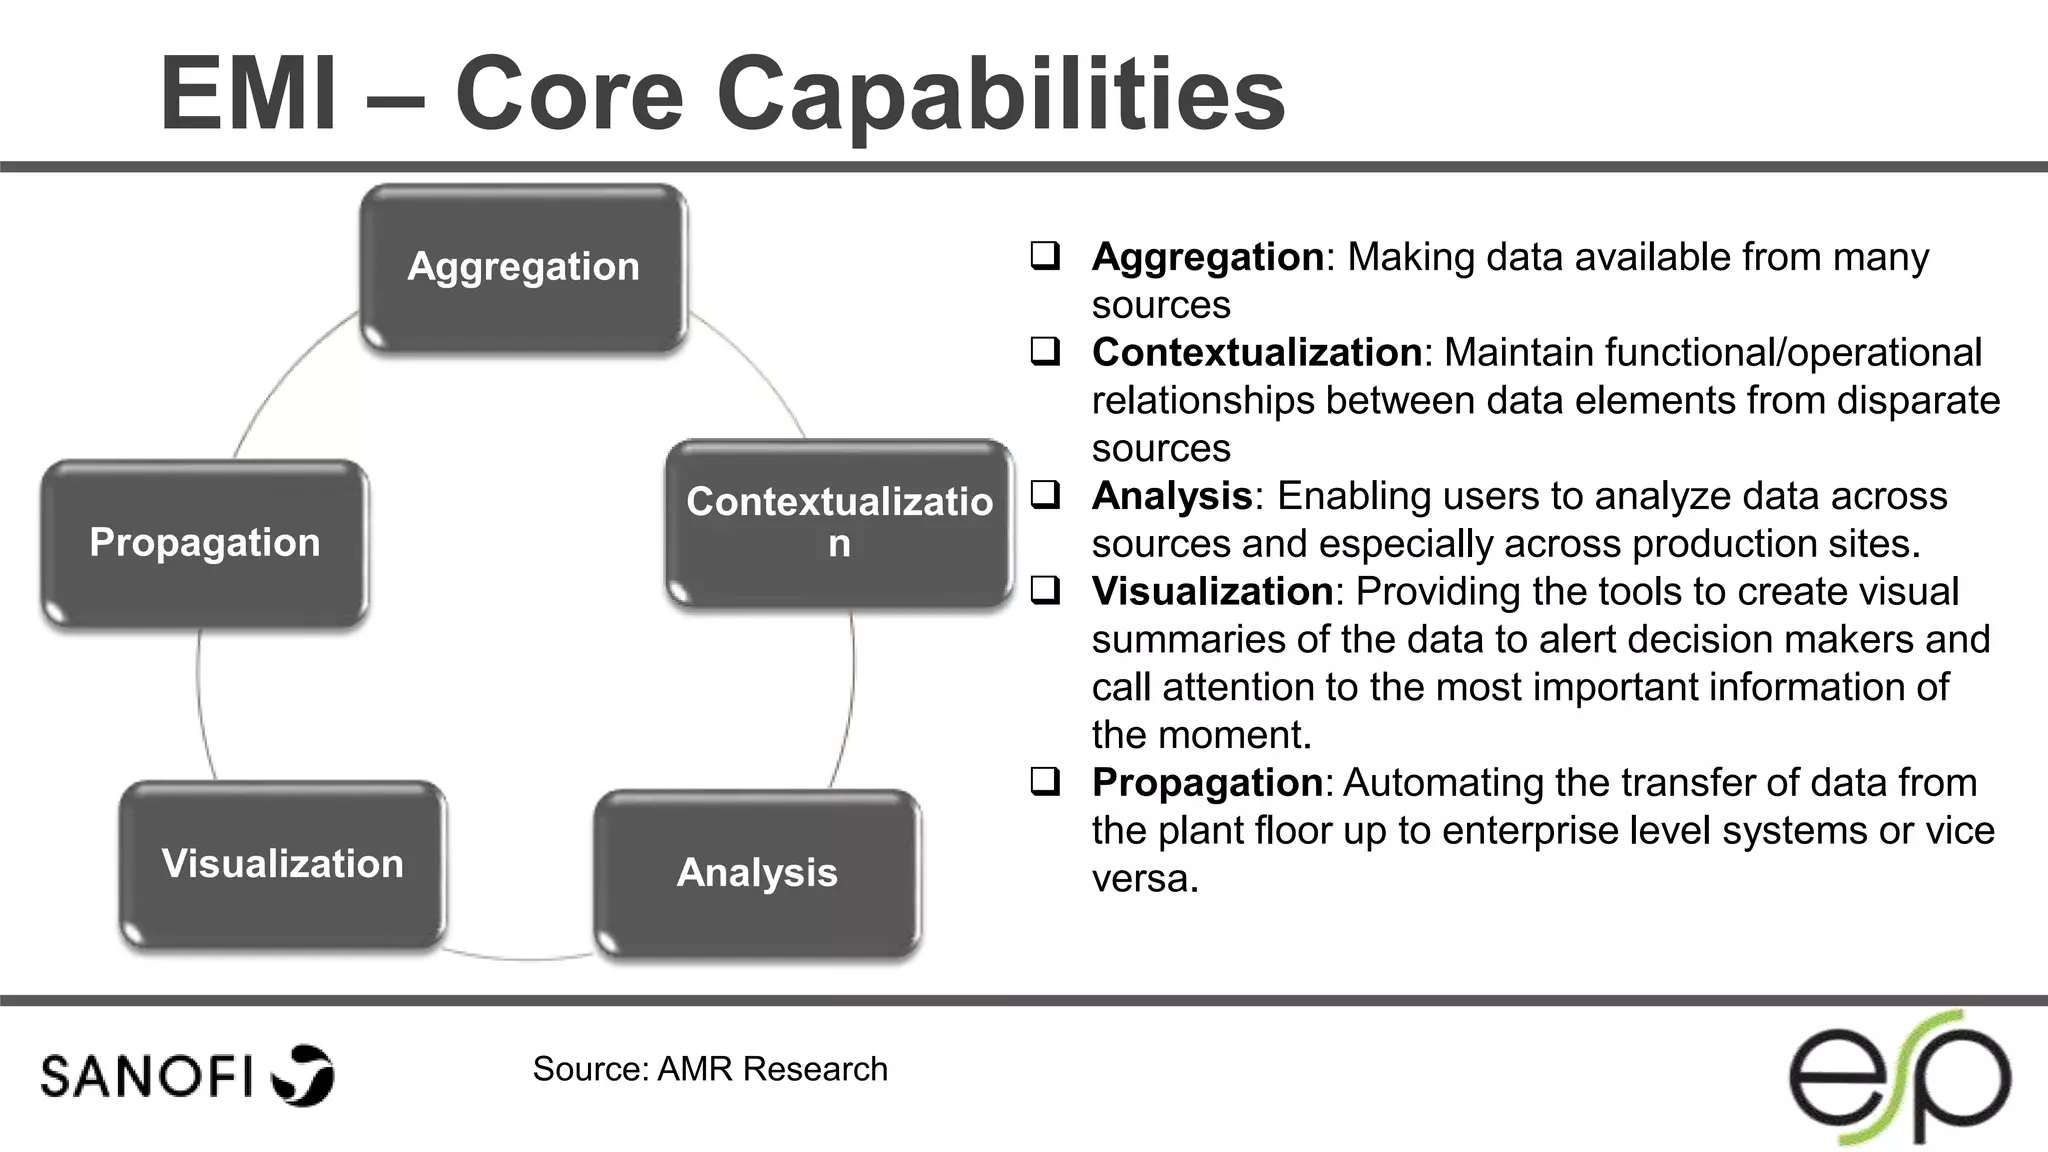
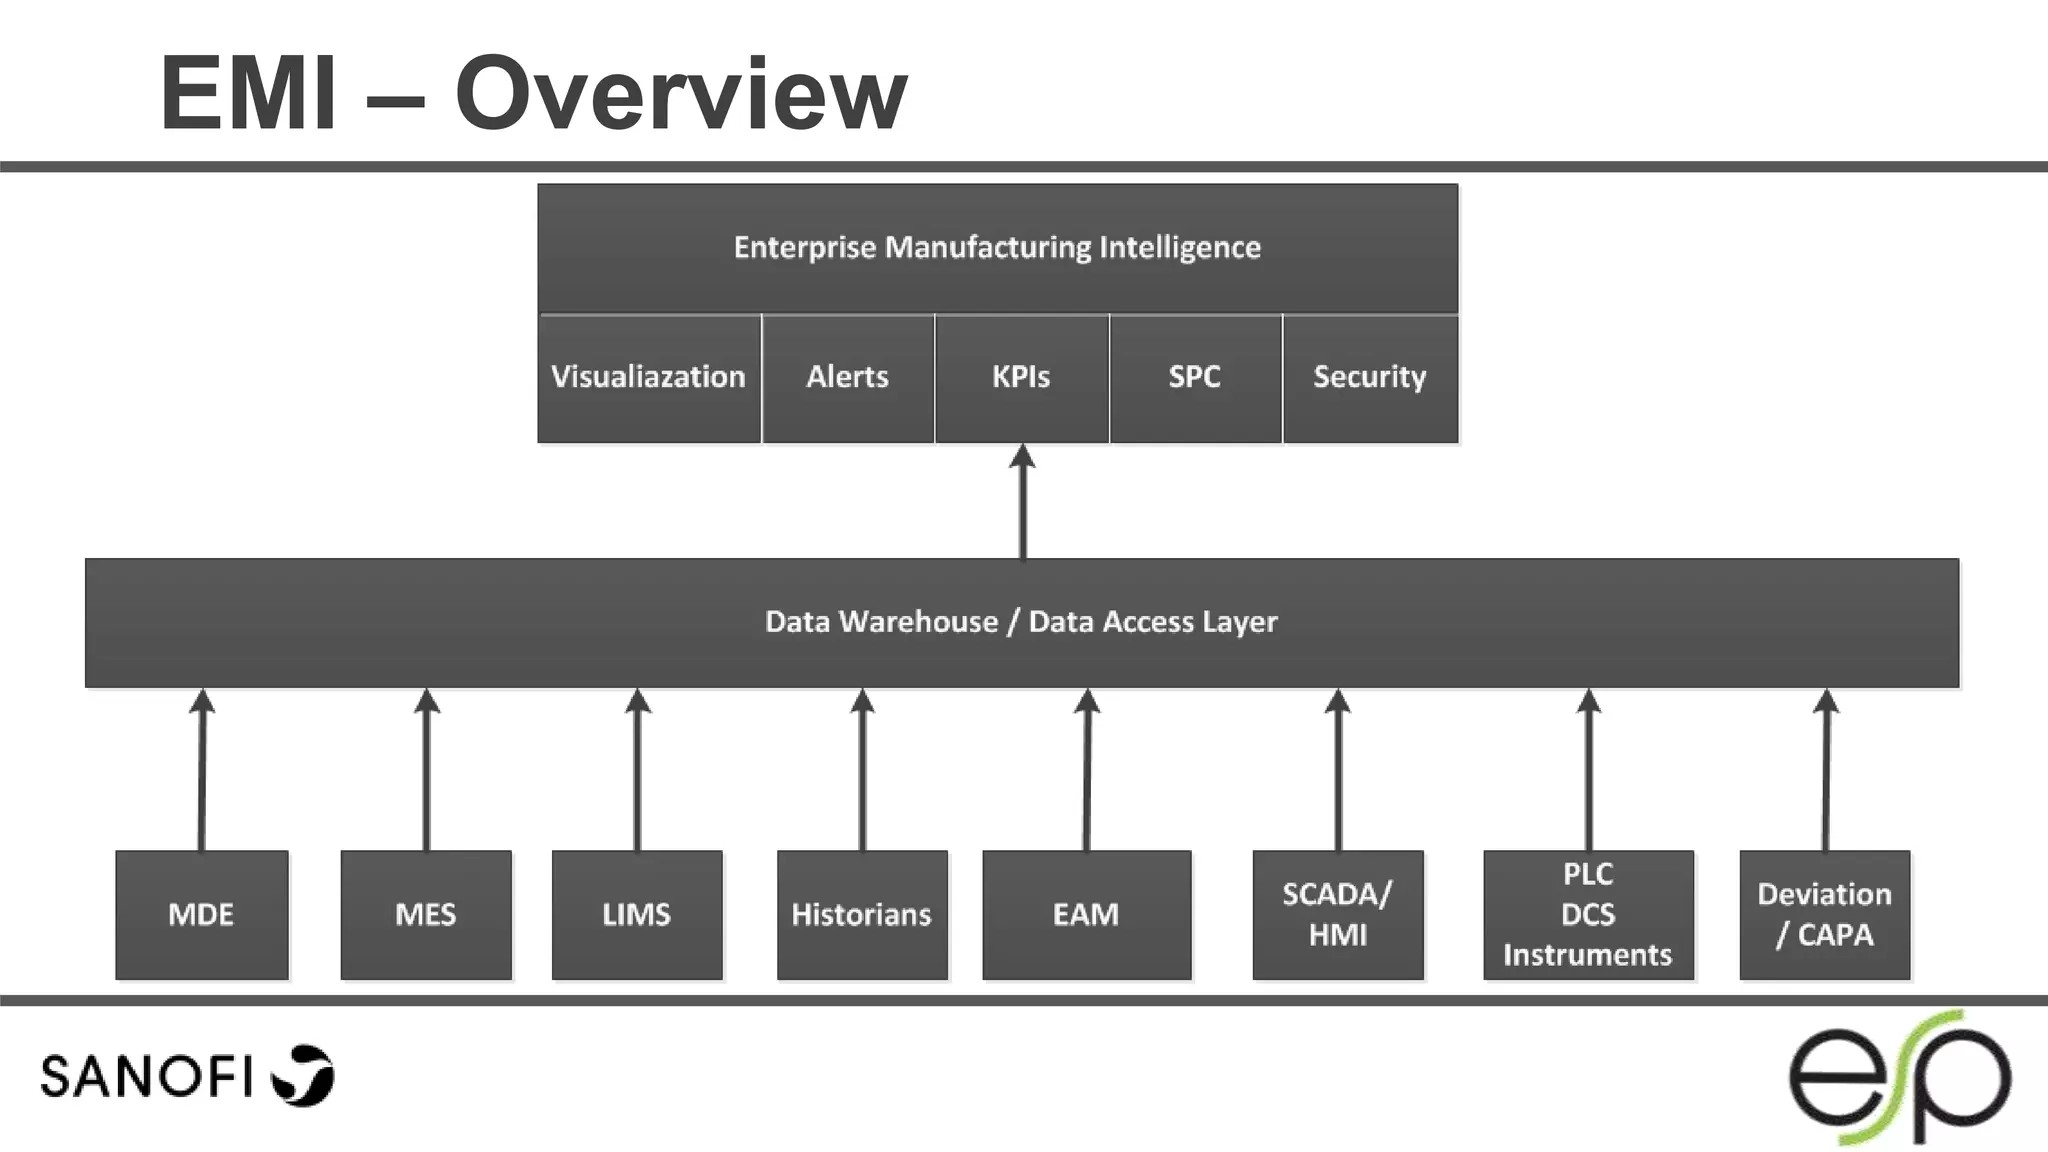
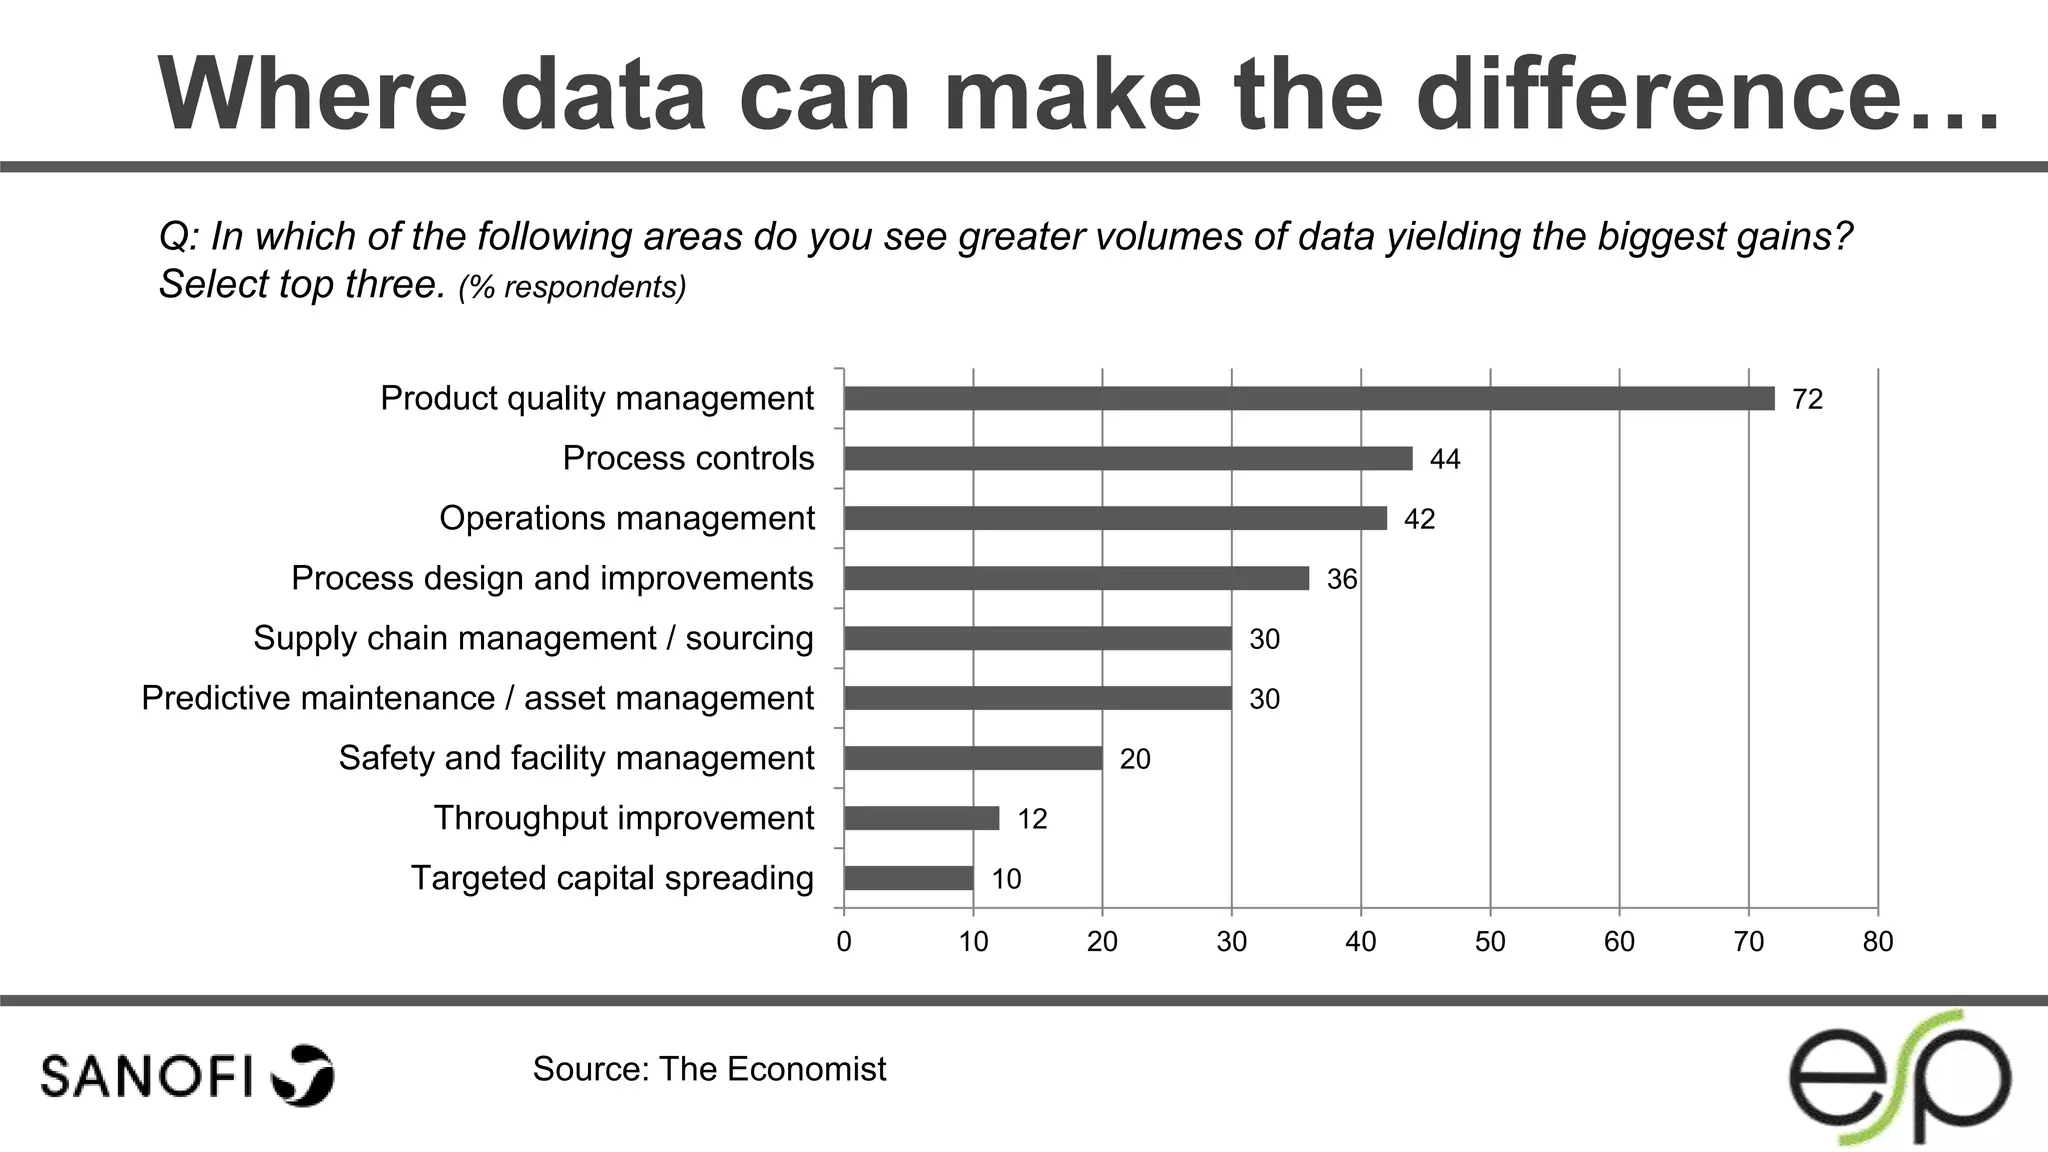
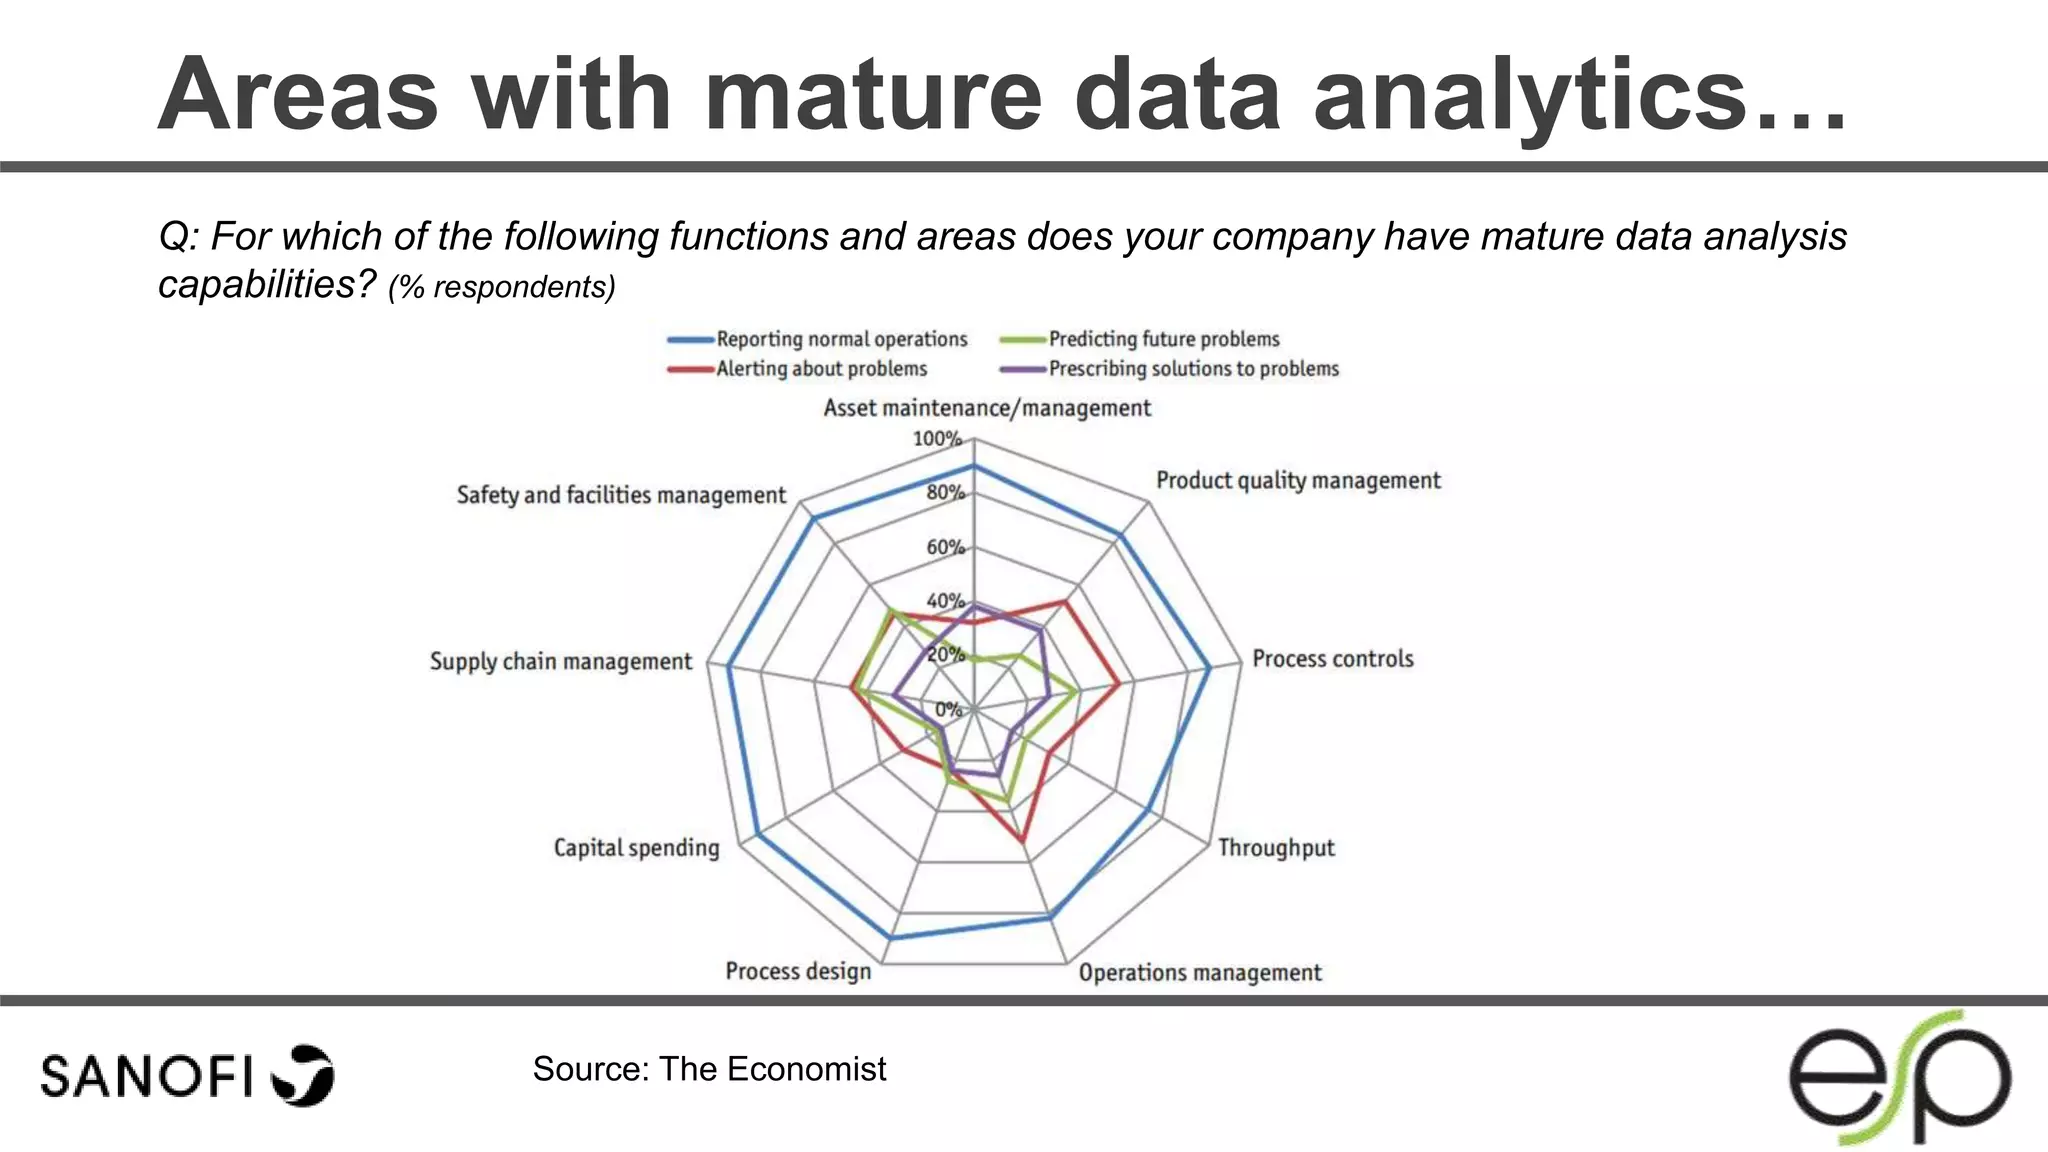
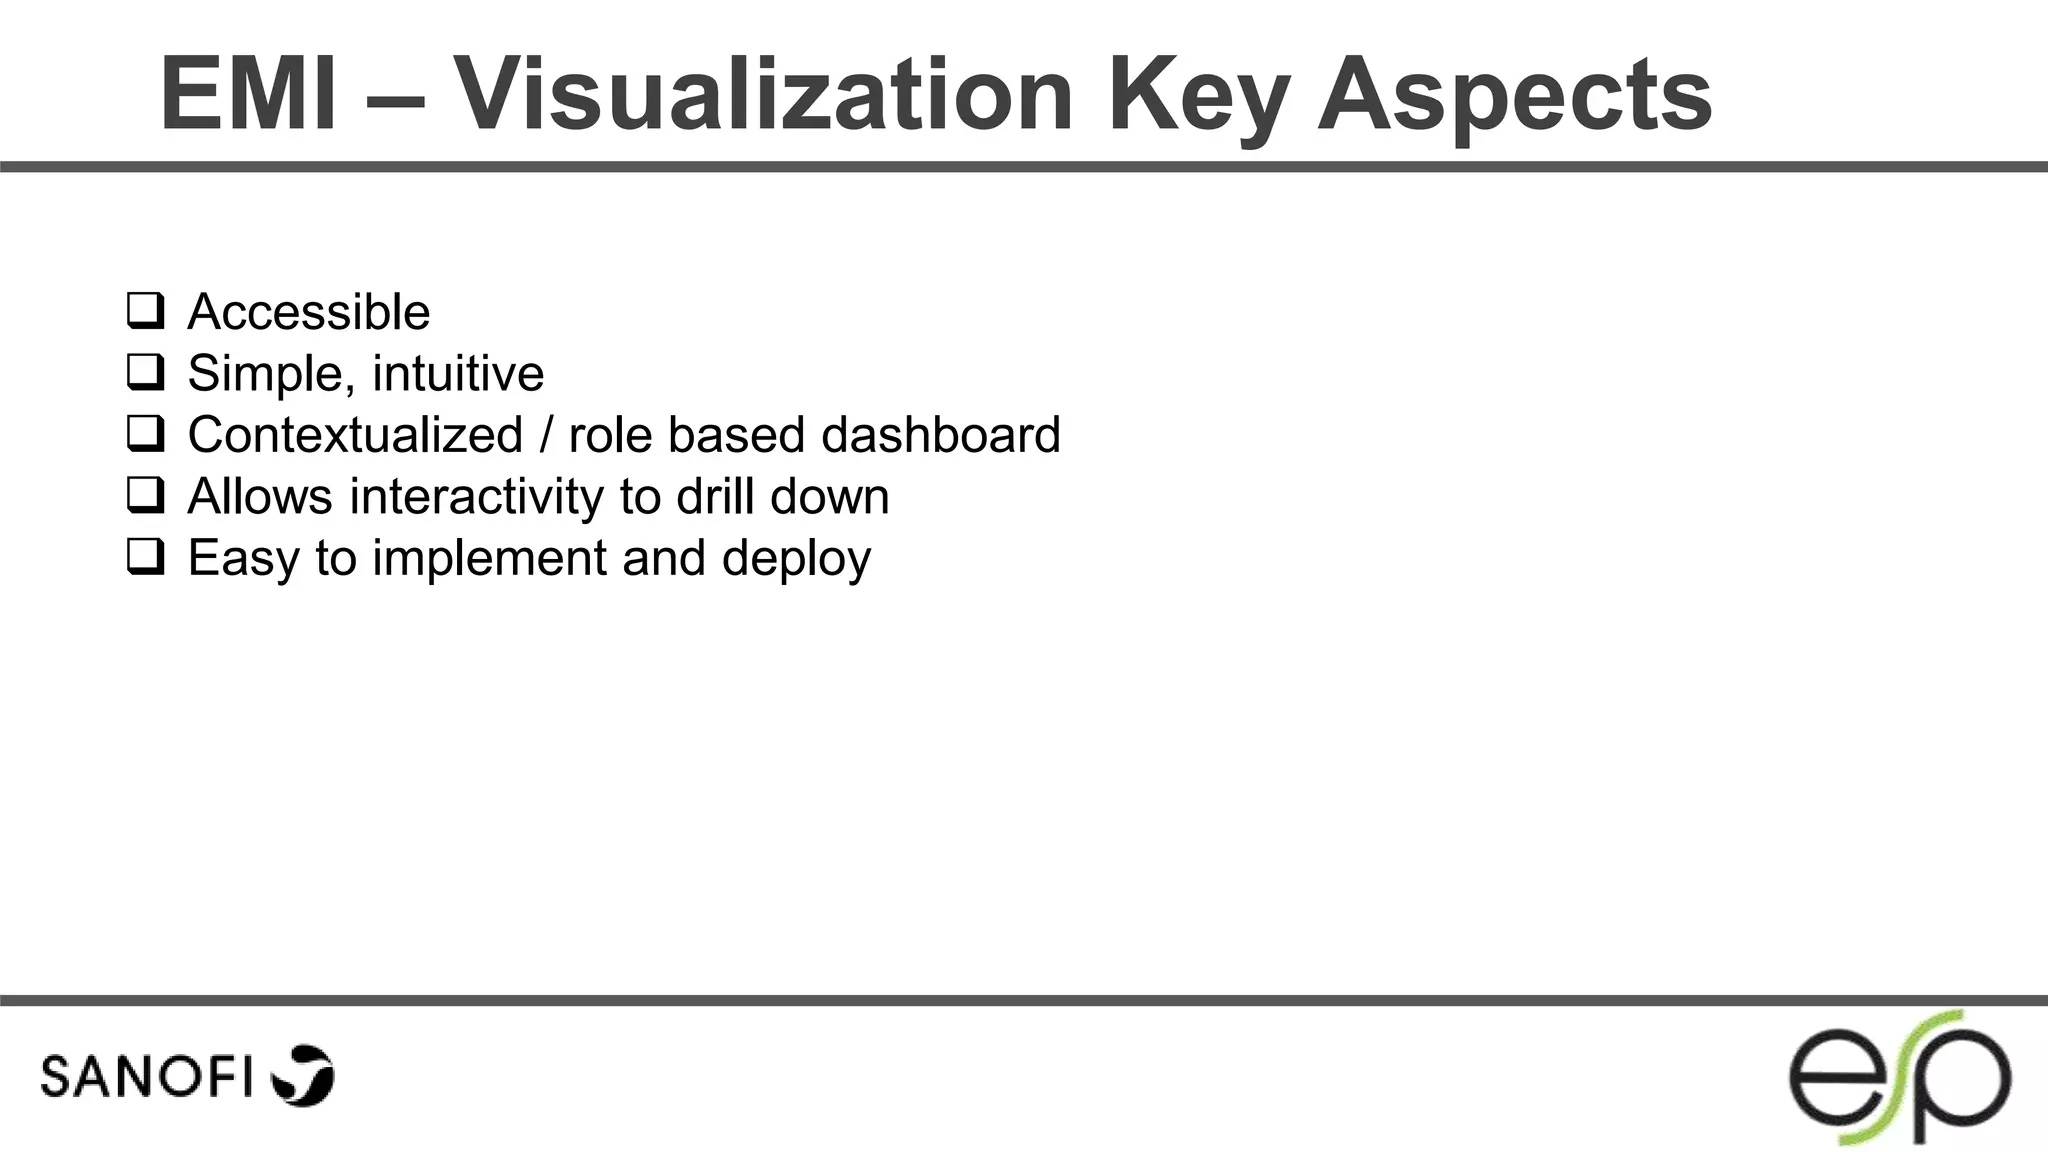
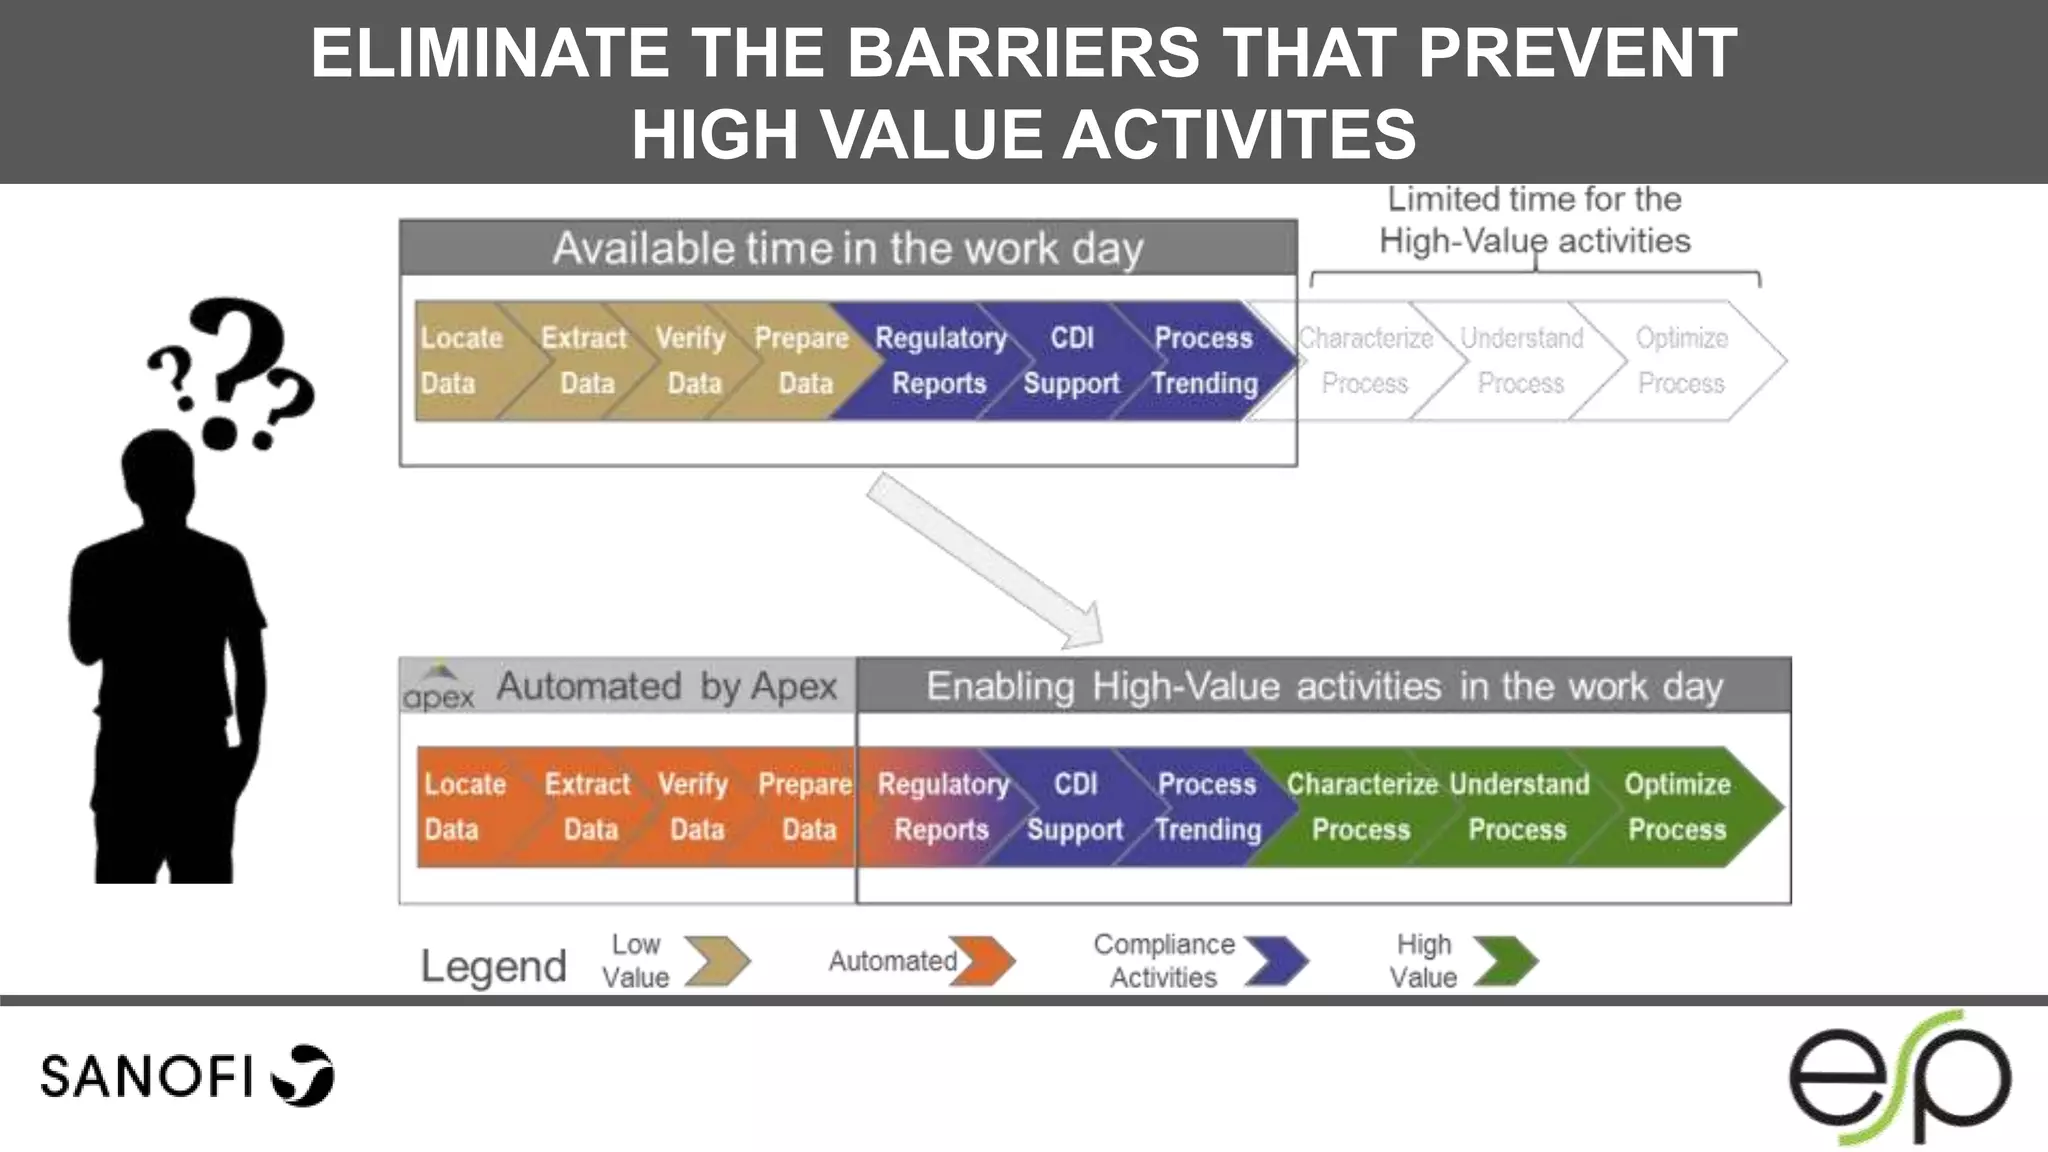
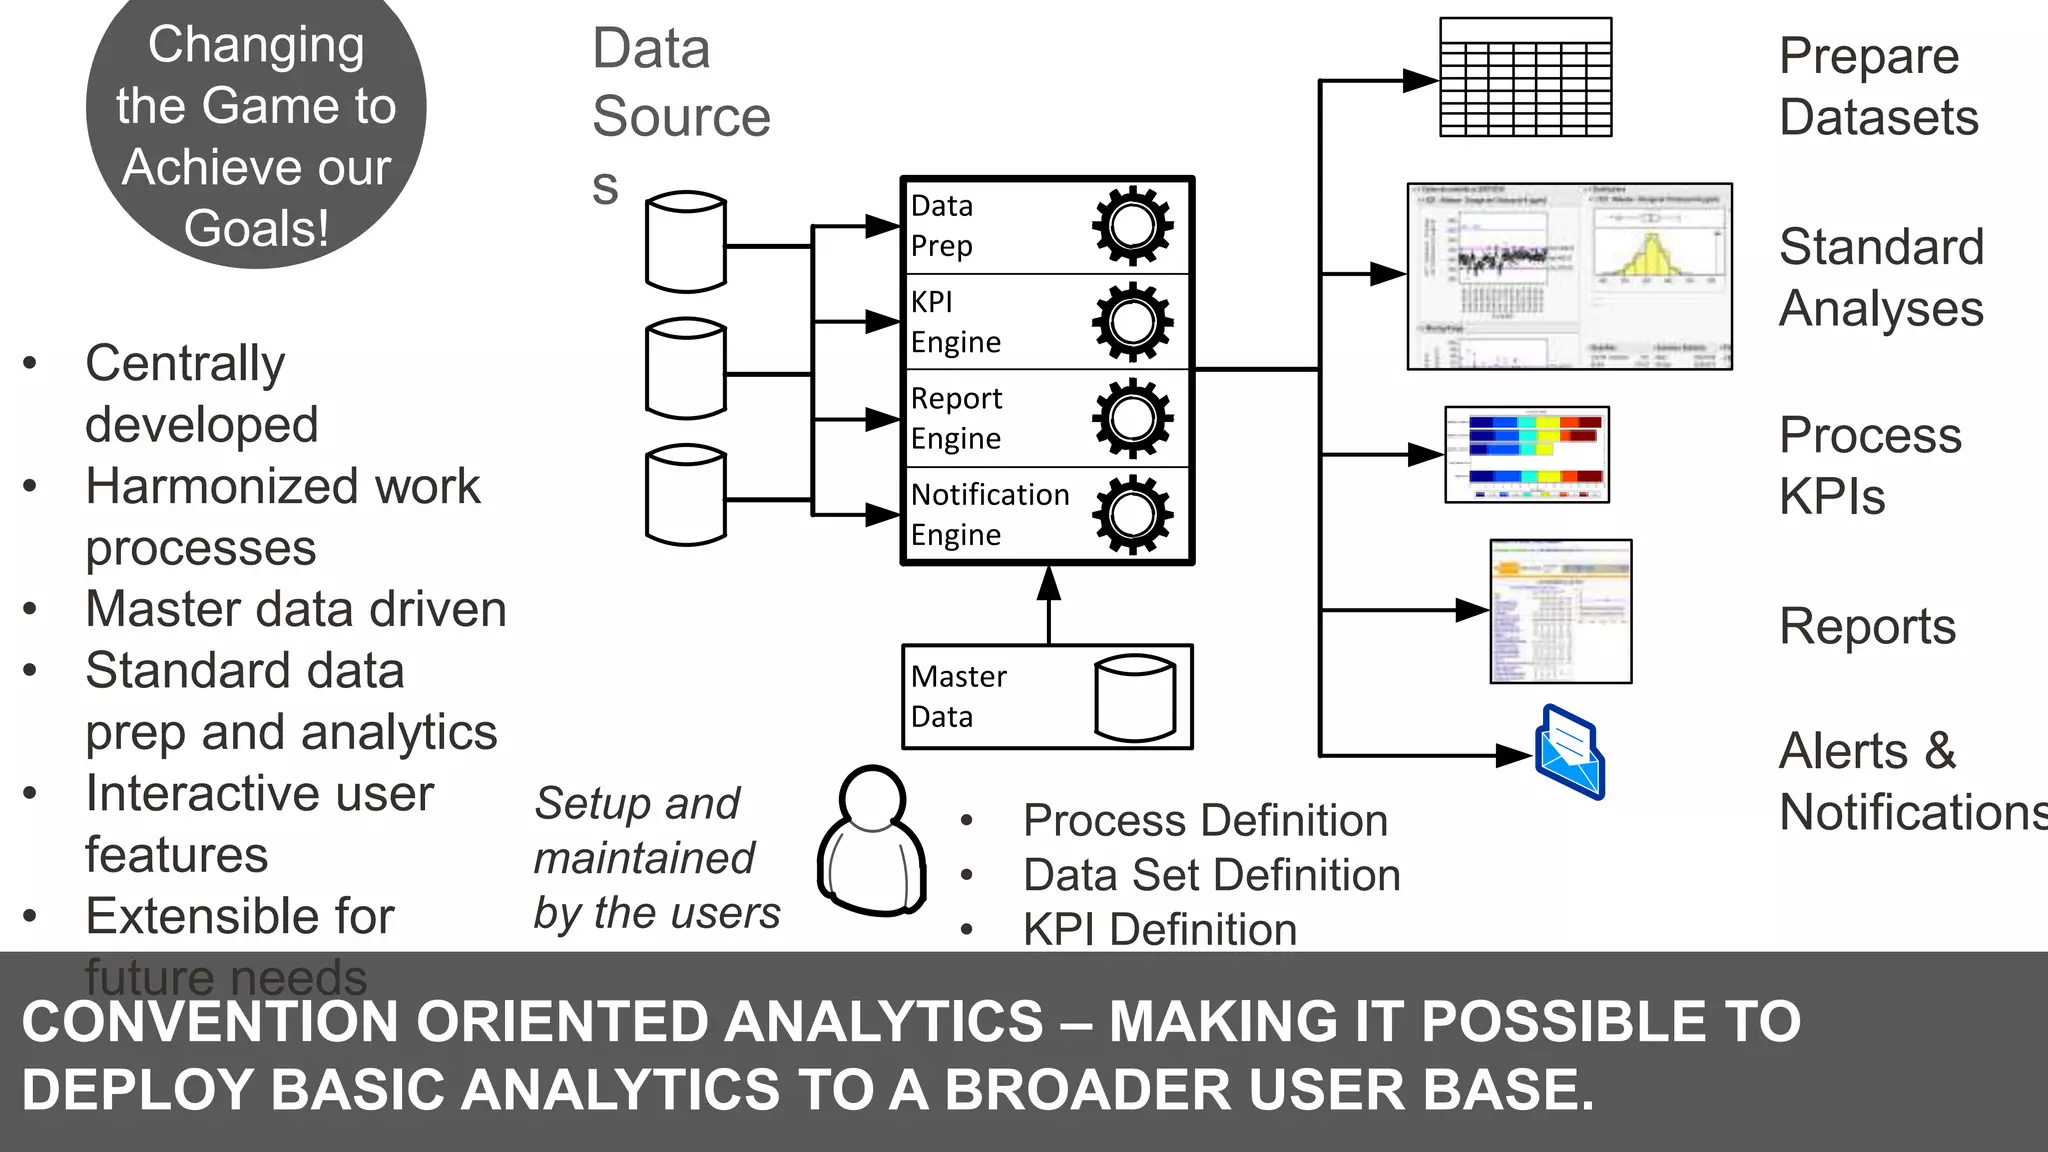
MES, Operational Excellence, Data Analytics and Manufacturing Intelligence
1. PROACTIVELY TAP MES DATA
FOR OPERATIONAL
EXCELLENCE
Tips and tools for creating and presenting wide format
slides
Bora Susmaz
Platform Manager, Data
Analytics
Sanofi
bora.susmaz@sanofi.com
Baha Korkmaz, PMP.
Senior VP Operations
North America
Baha.Korkmaz@esp.ie
MES 2016
11th Annual Forum on Manufacturing Execution Systems
Disclaimer: The views expressed in this presentation are those of the presenters and do
not necessarily reflect the opinions of Sanofi.
2. This workshop will discuss the impact of MES and its related data to Operational
Excellence
One of the many benefits of utilizing electronic systems is the increase in data
availability and accessibility.
However, many companies record masses of data, but suffer from continuous
improvement paralysis due to being overloaded by the amount of data at their
fingertips.
Instead of being reactive, the key to maximizing your manufacturing data with
MES comes from proactively leveraging the quality data to improve processes
and efficiencies.
During this interactive workshop, we will examine Operational Excellence
components, MES contribution to Operational Excellence, and manufacturing
intelligence initiatives to transform into a high-performance and knowledge-
driven organization.
Workshop Objectives
3. How can data be leveraged to improve processes?
How can real-time use of data be applied to improve performance?
How can you utilize metrics and intelligence to improve shop floor
activities and relay that information to business operations?
How can Enterprise Manufacturing Intelligence increase productivity
with minimal investments?
Key Questions to be Addressed
4. Part I: Introductions
Part II: Operational Excellence Concepts
Part III: MES Contribution to Operational Excellence
Part IV: Data Analytics & Enterprise Manufacturing Intelligence
Part V: Sanofi Journey
Agenda / Workshop Outline
5. Part I: Introductions
Part I: Introductions
Part II: Operational Excellence Concepts
Part III: MES Contribution to Operational Excellence
Part IV: Data Analytics & Enterprise Manufacturing Intelligence
Part V: Sanofi Journey
6. Introductions
Your name and background
Your function / role within the company
Do you have MES in your organization?
If yes, what are the key uses of MES data?
Do you have a Manufacturing Intelligence solution?
What are your expectations from this workshop?
7. Part II: Operational Excellence Concepts
Part I: Introductions
Part II: Operational Excellence Concepts
Part III: MES Contribution to Operational Excellence
Part IV: Data Analytics & Enterprise Manufacturing Intelligence
Part V: Sanofi Journey
8. Better Quality
Higher Throughput
Greater Availability
Efficient Management of Assets
Increased Productivity;
Operations & Maintenance
Increased Agility
Streamlined Compliance with
Regulatory Authorities
Operational Excellence Objectives
Achieve Data Integrity
Near Real Time Integration of
Manufacturing Systems to Business
Systems
Reduce Operational Costs
Reduce Waste
Reduce Time to Market
Prolong Product Life
Maximize Profits
9. OE: Optimize Resources
Deliver the highest
possible output of
products with the highest
possible quality from a
given volume of
resources
Using the lowest possible
amount of resources,
deliver a particular output
with the highest possible
quality
10. Six Sigma
Lean Manufacturing
OEE – Overall Equipment Efficiency
PAT – Process Analytical Technology
OE: Basic Tools & Techniques
11. Operational excellence impacts all phases of Product Life cycle by reducing time to
market, maximizing yield/profit, and prolonging the product life span.
OE Impact on Product Life Cycle
12. Part III: MES Contribution to Operational
Excellence
Part I: Introductions
Part II: Operational Excellence Concepts
Part III: MES Contribution to Operational Excellence
Part IV: Data Analytics & Enterprise Manufacturing Intelligence
Part V: Sanofi Journey
15. MES Contribution to Operational Excell
Reduce
Increase
• Inventory
• Regulatory Costs
• Waste
• Time to market/volume
• Cycle Time
• Changeover Time
• Maintenance Costs
• Throughput
• Product Quality
• Yield
• Right First Time
• Equipment & Material Utilization
• Energy Efficiency
• Agility
16. MES & OE: Efficiency Gains
RBE (Review by Exception)
No duplicate data entry
Minimized human error
Consistency in operations
Electronic batch review and release
Minimize non-value added activities
Reduce
Increase
• Inventory
• Regulatory Costs
• Waste
• Time to market/volume
• Cycle Time
• Changeover Time
• Maintenance Costs
• Throughput
• Product Quality
• Yield
• Right First Time
• Equipment & Material
Utilization
• Energy Efficiency
• Agility
17. MES & OE: Collaborative Manufacturing
ERP Integration
PLM Integration
PCS and Automation Integration
LIMS Integration
LMS Integration
EDM Integration
Asset Management Integration
Data Historian Integration
PDAT Integration
Deviation / CAPA Integration
Reduce
Increase
• Inventory
• Regulatory Costs
• Waste
• Time to market/volume
• Cycle Time
• Changeover Time
• Maintenance Costs
• Throughput
• Product Quality
• Yield
• Right First Time
• Equipment & Material
Utilization
• Energy Efficiency
• Agility
18. MES & OE: Better Decision Making
Real time monitoring
Visibility to real time data & KPIs
Context / role based dashboards
Embedded analytics
Golden batch comparison
Reduce
Increase
• Inventory
• Regulatory Costs
• Waste
• Time to market/volume
• Cycle Time
• Changeover Time
• Maintenance Costs
• Throughput
• Product Quality
• Yield
• Right First Time
• Equipment & Material
Utilization
• Energy Efficiency
• Agility
19. Open Discussion
How is your experience with your MES implementations?
Do you typically implement MES in green field plants only? How about
established facilities?
Are you achieving the intended benefits and ROI?
How do you think you can get more benefits from your MES investment?
What are the challenges in implementing these ideas?
20. Part IV: Data Analytics & Enterprise
Manufacturing Intelligence
Part I: Introductions
Part II: Operational Excellence Concepts
Part III: MES Contribution to Operational Excellence
Part IV: Data Analytics & Enterprise Manufacturing Intelligence
Part V: Sanofi Journey
21. Do you have
the right data
to answer
your burning
questions?
Are you sure?
Process
Enterprise
Laboratory
Material
22. MES & OE: What Kind of Data?
Maintenance schedules
Equipment failures
Machine downtime
OEE
Yield
Test results
Product genealogy
Cycle times
Exceptions
Changeover times
Scrap
Other process data (pH, temp, pressure,
duration, reactor,…)
23. MES & Analytics
MES generates data in coordinating and managing manufacturing processes;
but it is not designed to provide data analytics features.
MES typically is not a good fit for collecting all manufacturing data and
providing powerful analytical capabilities, predictive tools and techniques.
In fact, MES is just another data source for your manufacturing analytics
platform.
24. Data has a pace of its own…
Source: AMR Research
Sec Min Hr Day Week Month
Sensors
Logs
Batch Execution
In Process Controls
Lab Results Environmental
StabilityRaw Materials
Line Plot of multiple variables
0050 Remove Blank Rows - Breakdown Table of Descriptive Statistics (0180 Transformations of
Variables)
in N=32330 (No missing data in dep. var. list) 9v*101c
Breakdown Table of Descriptive Statistics (0180 Transformations of Variables)
N=32330 (No missing data in dep. var. list)
"17646275 - 2000 L Bioreactor | IS | Harvest Tank | Activity H0-H100"
Equipment ID=V-2501D
Value
Value_LCL
Value_UCL0 7 14 21 28 35 42 49 56 63 70 77 84 91 98
0
100
200
300
400
500
600
700
25. Challenges with Data…
Drowning in data
but starving for
knowledge
Decisions
involving cross
functional data
hard to formulate
Data buried in
disparate systems
Getting business units
and departments to
share across
organizational silos
Ability to handle the
volume, velocity and
variety of data
Inclination to make
decisions based on
intuition rather than
data
ROI justifications
for improvements
Data quality and
context
Data validation
Security concerns
Lack of personnel /
expertise to analyze
data
26. EMI - Enterprise Manufacturing Intellige
EMI is a term which applies to software used to bring a corporation’s
manufacturing related data together from many sources for the purposes of
reporting, analysis, visual summaries, and passing data between enterprise
level and plant floor systems.
Source: https://en.wikipedia.org/wiki/Enterprise_manufacturing_intelligence
27. EMI vs. BI
EMI Expectations
Real time manufacturing data;
including logistics, production,
process, quality, resources
24x7 availability / reliability
Context based KPIs and visualization
Data quality supports regulatory
compliance
BI Challenges
BI operates in data collected in
batch mode compared to real
time data needed by EMI
Data volume / granularity is too
much for BI systems to
manage
Reliability of BI is generally not
adequate for MI needs
Running your operations; where decisions
are made in seconds, minutes or hours.
Running your business; where decisions
are made in days, weeks or months.
28. EMI – Top 5 Drivers
Source: ARC Advisory Group
0% 2% 4% 6% 8% 10% 12% 14% 16%
implementing best practices
Reducing costs / increasing profits
Getting value from data already collected
Faster decision making / avoid abnormal behavior
Improving process visibility
29. EMI – Core Capabilities
Aggregation
Contextualizatio
n
AnalysisVisualization
Propagation
Aggregation: Making data available from many
sources
Contextualization: Maintain functional/operational
relationships between data elements from disparate
sources
Analysis: Enabling users to analyze data across
sources and especially across production sites.
Visualization: Providing the tools to create visual
summaries of the data to alert decision makers and
call attention to the most important information of
the moment.
Propagation: Automating the transfer of data from
the plant floor up to enterprise level systems or vice
versa.
Source: AMR Research
32. Four Types of Data Analytics
Descriptive
Analytics
Diagnostic
Analytics
Predictive
Analytics
Prescriptive
Analytics
What is happening now
based on incoming data?
Past performance of
what happened and why
Likely scenarios of
what might happen
Identify the best course of
action for any pre-
specified outcome
Source: Gartner
33. Where data can make the difference…
Source: The Economist
10
12
20
30
30
36
42
44
72
0 10 20 30 40 50 60 70 80
Targeted capital spreading
Throughput improvement
Safety and facility management
Predictive maintenance / asset management
Supply chain management / sourcing
Process design and improvements
Operations management
Process controls
Product quality management
Q: In which of the following areas do you see greater volumes of data yielding the biggest gains?
Select top three. (% respondents)
34. Areas with mature data analytics…
Source: The Economist
Q: For which of the following functions and areas does your company have mature data analysis
capabilities? (% respondents)
35. EMI – Visualization Key Aspects
Accessible
Simple, intuitive
Contextualized / role based dashboard
Allows interactivity to drill down
Easy to implement and deploy
37. Open Discussion
What are your experiences dealing with data?
What are the initiatives you have in your company to
make better use of your data?
Do you have initiatives around predictive and
prescriptive analytics? Preparation for Industry 4.0?
38. Part V: Sanofi Journey
Part I: Introductions
Part II: Operational Excellence Concepts
Part III: MES Contribution to Operational Excellence
Part IV: Data Analytics & Enterprise Manufacturing Intelligence
Part V: The Future
Part V: Sanofi Journey
41. Need to get
All the Data
For
All the Processes
To
All the Right People
When they need it!
GOAL:
MAKE PROCESS DATA
ANALYTICS PART OF
SANOFI’S CULTURE AND
INCORPORATE IT INTO
OUR DAY TO DAY
ACTIVITIES
42. In more than
100
countries
107
Industrial sites
in 40 countries
CLOSER TO OUR PATIENTS AND PARTNERS
EUROPE
48 Manufacturing sites
6 Development centers
33 Distribution Hubs
NORTH AMERICA
19 Manufacturing sites
2 Development centers
8 Distribution Hubs
ASIA-PACIFIC
20 Manufacturing sites
5 Development centers
30 Distribution Hubs
LATIN AMERICA
12 Manufacturing sites
3 Development centers
30 Distribution Hubs
AFRICA-MIDDLE-EAST
8 Manufacturing sites
1 Development center
58 Distribution Hubs
Sanofi’s
presence
WE ASPIRE TO DEPLOY
PROCESS DATA ANALYTICS
TO ALL OUR
MANUFACTURING
PROCESSES
OUR REALITY IS
CONSTRAINED BY
• BUDGET
• EXPERTISE
43. CONVENTION ORIENTED ANALYTICS – MAKING IT POSSIBLE TO
DEPLOY BASIC ANALYTICS TO A BROADER USER BASE.
Changing
the Game to
Achieve our
Goals!
Data
Prep
KPI
Engine
Report
Engine
Notification
Engine
Master
Data
Prepare
Datasets
Standard
Analyses
Process
KPIs
Reports
Alerts &
Notifications
Data
Source
s
• Process Definition
• Data Set Definition
• KPI Definition
Setup and
maintained
by the users
• Centrally
developed
• Harmonized work
processes
• Master data driven
• Standard data
prep and analytics
• Interactive user
features
• Extensible for
future needs
44. UNDERSTANDING HOW YOUR
USERS WILL INTERACT WITH
THE PLATFORM IS A KEY TO
SUCCESS
USERS GRAVITATE TO
DIFFERENT TOOLS BASED ON
THEIR NEEDS
Casual Use Web Portal
Completed Results
Published Reports
Published Analytics
Interactive Use Dynamic Dashboard
Predefined datasets
filters, analyses, and
charts based off of
master data definition
Exploratory Use Interactive Web
Environment
Predefined
Datasets with Ad-
Hoc capability
Power Use Full Feature client
Prepare Data and
Analysis. Publish
Results to others
Unattended Use Alerts & Notifications
Email Alerts
Mobile Alerts
Report Distribution
BRINGING
ANALYTICS TO
ALL THE PEOPLE
45. 45 Apex Process Data Analytics Platform
DataCapture
DataStorage&
Access
DataAnalytics&
UserTools
Enterprise
Historian
Process
Data
Warehouse
MESCAPA
LIMS
Data Access
Spread
sheet
Site 1 Site 2 Site 3
MDE
ERP
Site
Hist
Site
Hist
Site
Hist
History Aggregation Enterprise Integration (Tibco)
Web Portal
Interactive Web
Statistics Tool
Enterprise/Transactional
Data
Statistical
Analysis &
Notifications
TimeSeriesData
ManuallyEnteredData
Web
Form
Exploritory
User
Casual
User
Dynamic Analysis
and Charting
Master
Data
Management
Interactive
User
OUR STATUS
PLATFORM:
Enterprise Historian
Process Data
Warehouse
Statistica Enterprise
Web Portal
MDM and Dynamic
Dashboard under
construction
ADOPTION BY 2017:
900+ Users
300 Manufacturing
processes
20 Sites in all world
areas
Running manufacturing operations where decisions are made in minutes or hours versus running the business where decisions are made in days, weeks or months.
http://www.gtai.de/GTAI/Content/EN/Invest/_SharedDocs/Downloads/GTAI/Brochures/Industries/industrie4.0-smart-manufacturing-for-the-future-en.pdf
http://www.acatech.de/fileadmin/user_upload/Baumstruktur_nach_Website/Acatech/root/de/Material_fuer_Sonderseiten/Industrie_4.0/Final_report__Industrie_4.0_accessible.pdf
Sensor-driven data coupled with enterprise data will lead to a data explosion. According to market analyst firm IDC, the "digital universe" will grow from 2005 to 2020 by a factor of 300. This is driving the need for faster database technology to manage and analyze big data.