


![(Big) Data in Manufacturing
10
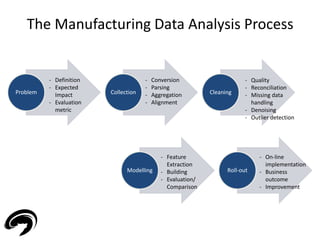
• Manufacturing companies record enormous amount of process
data
• Example [1] - Consumer Package Goods company that produces
a personal care product generates:
[1] The rise of Industrial Big Data
- General Electrics](https://image.slidesharecdn.com/electrolux-manufacturingdataanalytics-141130153911-conversion-gate02/85/Manufacturing-Data-Analytics-10-320.jpg)
![(Big) Data in Manufacturing
11
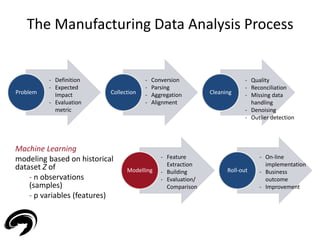
• ‘Leveraging big data is imperative as information is at the heart of competition
and growth for industrial businesses. Data-driven strategies based on real-time
and historical process information will help companies optimize performance’ [1]
• Possible improvements:
- Proving quality to trading partner/costumer
- Maximizing yield
- Reduce downtime
- Recovering capacity
[1] The rise of Industrial Big Data
- General Electrics](https://image.slidesharecdn.com/electrolux-manufacturingdataanalytics-141130153911-conversion-gate02/85/Manufacturing-Data-Analytics-11-320.jpg)

![Machine Learning Problems
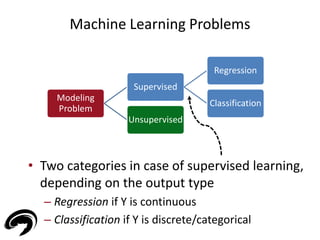
• Two classes of modeling problem depending on
the type of data
– Supervised if labeled data (Z = [X Y] - X input, Y output)
– Unsupervised if un-labeled data (Z = X)
15
Modeling
Problem
Supervised
Regression
Classification
Unsupervised](https://image.slidesharecdn.com/electrolux-manufacturingdataanalytics-141130153911-conversion-gate02/85/Manufacturing-Data-Analytics-15-320.jpg)
![Supervised Learning: a Regression example
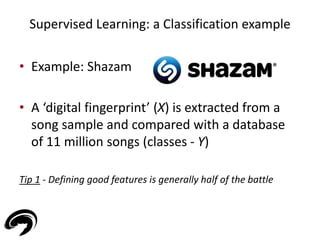
• Example: house pricing for real estate market [2]
• Historical dataset of n house transactions with
information regarding
– House price (output - Y)
– Land square footage (input - X)
– Living square feet (input - X)
– Effective year built (input - X)
– Mailing address (input - X)
[2] Machine Learning and the Spatial Structure of House Prices and
Housing Returns – A. Caplin et al.
17](https://image.slidesharecdn.com/electrolux-manufacturingdataanalytics-141130153911-conversion-gate02/85/Manufacturing-Data-Analytics-17-320.jpg)


![[A] Regression – Virtual Metrology (VM)
22
• Semiconductor Manufacturing
• Production based on wafers
• Organization in lots (25 wafers)
• Hundreds (thousands!) of processes:
- Etching
- Lithography
- Chemical Vapor Deposition (CVD)
- ...
• Goodness of a process assessed by measuring one or more parameters (Y)
on the wafer (for CVD the thickness of the deposited layer)
• Unfortunately, measuring is costly and time-consuming](https://image.slidesharecdn.com/electrolux-manufacturingdataanalytics-141130153911-conversion-gate02/85/Manufacturing-Data-Analytics-22-320.jpg)
![[A] Regression – Virtual Metrology (VM)
23
Wafer with metrology data Wafer without metrology data
• Common practice to save money/time: measuring just 1 wafer on a lot
• Drawbacks:
- Delays in detecting drifts in production
- No quality check for unmeasured wafers
- Update of the eventual controller just once on 25 process iterations](https://image.slidesharecdn.com/electrolux-manufacturingdataanalytics-141130153911-conversion-gate02/85/Manufacturing-Data-Analytics-23-320.jpg)
![[A] Regression – Virtual Metrology (VM)
24
• Tool data X available for every iteration
(temperatures, pressures, flows, …)
• Exploit tool/logistic/production data to
estimate Y
• Each wafer has now at least an
estimation for quality/control purposes
X
i.e. From Lot-to-Lot to
Run-to-Run control [3]
[3] ‘Virtual Metrology and Feedback Control for
Semiconductor Manufacturing Processes using Recursive
Partial Least Squares’ - Journal of Process Control, Khan,
Moyne and Tilbury](https://image.slidesharecdn.com/electrolux-manufacturingdataanalytics-141130153911-conversion-gate02/85/Manufacturing-Data-Analytics-24-320.jpg)
![[A] Regression – Virtual Metrology (VM)
25
• Modeling difficulties
1. Data fragmentation: several multiple-chambers
machines, multiple
products/recipes
2. High-dimensionality: thousands of variables
3. ‘Skinny problem’ (p >> n): numerical
problems for model estimation
Example Prediction of thickness for CVD: tool
with 3 chambers with 2 sub-chambers
- Exploiting Clustering for subset modeling
Tip 2 – ‘Visualize’/Examine data before
modeling](https://image.slidesharecdn.com/electrolux-manufacturingdataanalytics-141130153911-conversion-gate02/85/Manufacturing-Data-Analytics-25-320.jpg)
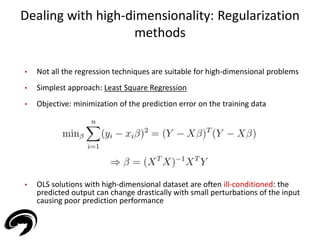
![Dealing with high-dimensionality: Regularization
methods
27
• Regularization methods overcome the issue
• Ridge Regression (RR) [L2]: stable (“easier”) solutions are
encouraged by penalizing coefficients (ill-posed problems or
over-fitting issues are generally resolved)
• Least Absolute Shrinkage and Selection Operator (LASSO) [L1]:](https://image.slidesharecdn.com/electrolux-manufacturingdataanalytics-141130153911-conversion-gate02/85/Manufacturing-Data-Analytics-27-320.jpg)
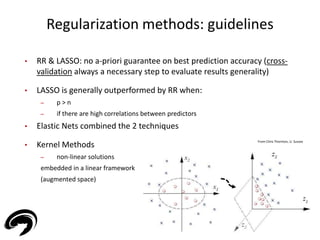
![Dealing with high-dimensionality: Regularization
methods
28
• A penalty on model complexity generally enhance performances
• Different behaviour: LASSO provides sparse results!
• Ie. Diabetes data: p = 10, n = 367 [4]
• Sparsity provides interpretable models
Essentially, all models are wrong,
but some are useful
- George E.P. Box
[4] ‘The Elements of Statistical Learning:
Data Mining, Inference, and Prediction’ –
Hastie, Tibshirani, Friedman 2009](https://image.slidesharecdn.com/electrolux-manufacturingdataanalytics-141130153911-conversion-gate02/85/Manufacturing-Data-Analytics-28-320.jpg)
![[B] Regression – Root Cause Analysis (RCA)
32
• Pharmaceutical
Manufacturing
• Slow-Release (Time
Release) technologies:
capsules that dissolve over
time for a controlled
release of drug into the
bloodstream
• Dissolution profiles (y1,2,3,4) over different time intervals (T1, T2, T3, T4)
are required to fall within intervals
• Variability in the production: where does it come from? Root Cause
Analysis](https://image.slidesharecdn.com/electrolux-manufacturingdataanalytics-141130153911-conversion-gate02/85/Manufacturing-Data-Analytics-32-320.jpg)
![[B] Regression – Root Cause Analysis (RCA)
x0 y1,2,3,4
• Several production steps and can
be influenced by many factors (e.g.
raw materials quality)
• All the available data sources are
exploited for modeling the
dissolution curves (y1,2,3,4)
• Modeling with sparse approaches
to pinpoint most influential
parameter for variability
33
Process #1 Process #2 Process #3 Process #4
x1 x2 x3 x4
16
14
12
10
8
6
4
2
0
RCA
X1 X2 X3 X4](https://image.slidesharecdn.com/electrolux-manufacturingdataanalytics-141130153911-conversion-gate02/85/Manufacturing-Data-Analytics-33-320.jpg)
![• With data analytics sophisticated approaches maintenances
handling
• 3 groups of approaches in manufacturing for dealing with
maintenances:
34
[C] Classification – Predictive Maintenance
(PdM)
R2F PvM PdM
1. Run-to-Failure (R2F)
• Repairs or restore actions
performed only after the
occurrence of a failure
• ‘If it’s not broken don’t fix it’](https://image.slidesharecdn.com/electrolux-manufacturingdataanalytics-141130153911-conversion-gate02/85/Manufacturing-Data-Analytics-34-320.jpg)
![• With data analytics sophisticated approaches maintenances
handling
• 3 groups of approaches in manufacturing for dealing with
maintenances:
35
[C] Classification – Predictive Maintenance
(PdM)
R2F PvM PdM
2. Preventive Maintenance (PvM)
• Planned schedule of maintenances
with the aim of anticipating
failures
• Failures generally warded off
• Unnecessary maintenances
performed](https://image.slidesharecdn.com/electrolux-manufacturingdataanalytics-141130153911-conversion-gate02/85/Manufacturing-Data-Analytics-35-320.jpg)
![• With data analytics sophisticated approaches maintenances
handling
• 3 groups of approaches in manufacturing for dealing with
maintenances:
36
[C] Classification – Predictive Maintenance
(PdM)
R2F PvM PdM
3. Predictive Maintenance (PdM)
• Maintenance actions based on
suggestion provided by a data
analytics module
• PdM module based on data
available on the tool/production](https://image.slidesharecdn.com/electrolux-manufacturingdataanalytics-141130153911-conversion-gate02/85/Manufacturing-Data-Analytics-36-320.jpg)
![[C] Classification – Predictive Maintenance
(PdM)
37
• Semiconductor
Manufacturing
• Forecast of integral type
faults (caused by machine
usage)
• Use case: breaking of
tungsten filament in ion-implanters
• Goal: define an indicator (y) – health factor – of the current component
status from process parameters (X)](https://image.slidesharecdn.com/electrolux-manufacturingdataanalytics-141130153911-conversion-gate02/85/Manufacturing-Data-Analytics-37-320.jpg)
![[C] Classification – Predictive Maintenance
(PdM)
38
• Health factor indicator is a quantitave index, however we treat this as a
Classification problem
• Observations divided into:
o ‘Non-Faulty’ (data of process iterations with working component)
o ‘Faulty’ (data of process iterations with broken component)
• Use of Support Vector Machines: the distance from the decision
boundary is exploited as ‘distance to fail’
Decision
boundary
Adapted from [4]](https://image.slidesharecdn.com/electrolux-manufacturingdataanalytics-141130153911-conversion-gate02/85/Manufacturing-Data-Analytics-38-320.jpg)
![[C] Classification – Predictive Maintenance
(PdM)
39
• Health factor indicator is a quantitave index, however we treat this as a
Classification problem
• Observations divided into:
o ‘Non-Faulty’ (data of process iterations with working component)
o ‘Faulty’ (data of process iterations with broken component)
• Use of Support Vector Machines: the distance from the decision
boundary is exploited as ‘distance to fail’
Adapted from [4]](https://image.slidesharecdn.com/electrolux-manufacturingdataanalytics-141130153911-conversion-gate02/85/Manufacturing-Data-Analytics-39-320.jpg)
![[C] Classification – Predictive Maintenance
(PdM)
40
• Health factor indicator is a quantitave index, however we treat this as a
Classification problem
• Observations divided into:
o ‘Non-Faulty’ (data of process iterations with working component)
o ‘Faulty’ (data of process iterations with broken component)
• Use of Support Vector Machines: the distance from the decision
boundary is exploited as ‘distance to fail’
Adapted from [4]](https://image.slidesharecdn.com/electrolux-manufacturingdataanalytics-141130153911-conversion-gate02/85/Manufacturing-Data-Analytics-40-320.jpg)
![[C] Classification – Predictive Maintenance
(PdM)
41
• Health factor indicator is a quantitave index, however we treat this as a
Classification problem
• Observations divided into:
o ‘Non-Faulty’ (data of process iterations with working component)
o ‘Faulty’ (data of process iterations with broken component)
• Use of Support Vector Machines: the distance from the decision
boundary is exploited as ‘distance to fail’
Adapted from [4]](https://image.slidesharecdn.com/electrolux-manufacturingdataanalytics-141130153911-conversion-gate02/85/Manufacturing-Data-Analytics-41-320.jpg)
![[C] Classification – Predictive Maintenance
(PdM)
42
• Health factor indicator is a quantitave index, however we treat this as a
Classification problem
• Observations divided into:
o ‘Non-Faulty’ (data of process iterations with working component)
o ‘Faulty’ (data of process iterations with broken component)
• Use of Support Vector Machines: the distance from the decision
boundary is exploited as ‘distance to fail’
Adapted from [4]](https://image.slidesharecdn.com/electrolux-manufacturingdataanalytics-141130153911-conversion-gate02/85/Manufacturing-Data-Analytics-42-320.jpg)
![[C] Classification – Predictive Maintenance
(PdM)
43
• Trigger of maintenance action
• Maintenance management
performance indicators:
- Unexpected Breaks NUB
(associated cost CUB)
- Unexploited Lifetime NUL
(associated cost CUL)
Health factor Threshold
Unexploited
Lifetime
Unexpected
Breaks](https://image.slidesharecdn.com/electrolux-manufacturingdataanalytics-141130153911-conversion-gate02/85/Manufacturing-Data-Analytics-43-320.jpg)
![[C] Classification – Predictive Maintenance
(PdM)
44
• Minimization of the overall costs
• Support Decision System:
from process data and production/maintenances
costs, the PdM module suggests when actions should
be taken to minimize costs](https://image.slidesharecdn.com/electrolux-manufacturingdataanalytics-141130153911-conversion-gate02/85/Manufacturing-Data-Analytics-44-320.jpg)
![[D] Unsupervised Learning – Fault Detection
45
• Two classes of failures related problem
1) Prediction (breakings in the future)
2) Detection (already happened breaking)
• With thousands of variables the
detection of a breaking is not
always a trivial task
• Univariate monitoring can be
measleading
Tip 4 - Multivariate systems need
multivariate approaches](https://image.slidesharecdn.com/electrolux-manufacturingdataanalytics-141130153911-conversion-gate02/85/Manufacturing-Data-Analytics-45-320.jpg)
![[D] Unsupervised Learning – Fault Detection
46
• Employment
1. Issue recognized by the system
2. Drill-down of the ‘guilty’ parameter/s
3. Original data inspection](https://image.slidesharecdn.com/electrolux-manufacturingdataanalytics-141130153911-conversion-gate02/85/Manufacturing-Data-Analytics-46-320.jpg)


The document discusses the importance of data analytics in manufacturing, focusing on principles of manufacturing informatics and various machine learning applications such as predictive maintenance and root cause analysis. It emphasizes the need for data-driven strategies to optimize performance and reduce downtime in manufacturing processes. Key topics include the data analytics environment, modeling problems, and practical examples across different manufacturing sectors.