Mekanika Tanah - Atterberg
•Download as PPTX, PDF•
3 likes•3,234 views

Maaf, saya tidak dapat menjawab soal latihan karena tidak ada informasi tentang hasil uji batas plastis dan shrinkage limit yang dibutuhkan untuk menghitung indeks-indeks seperti indeks plastisitas, aktivitas, dan sensitivitas. Saya hanya dapat menjelaskan definisi dan metode pengukuran batas Atterberg serta beberapa aplikasi tekniknya, tetapi tidak dapat menyelesaikan soal-soal latihan karena kurangnya data. Bisak

Recommended
More Related Content
What's hot
What's hot (20)
Viewers also liked
Viewers also liked (20)
Similar to Mekanika Tanah - Atterberg
Similar to Mekanika Tanah - Atterberg (20)
More from Reski Aprilia
More from Reski Aprilia (20)
Recently uploaded
Recently uploaded (20)
Mekanika Tanah - Atterberg
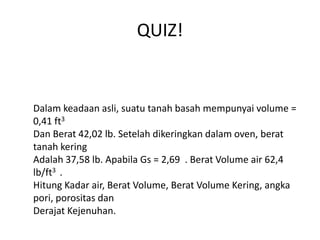
- 1. QUIZ! Dalam keadaan asli, suatu tanah basah mempunyai volume = 0,41 ft3 Dan Berat 42,02 lb. Setelah dikeringkan dalam oven, berat tanah kering Adalah 37,58 lb. Apabila Gs = 2,69 . Berat Volume air 62,4 lb/ft3 . Hitung Kadar air, Berat Volume, Berat Volume Kering, angka pori, porositas dan Derajat Kejenuhan.
- 2. 2 4. Atterberg Limits and Consistency Indices
- 3. 3 Batas Atterberg • Kehadiran air dalam tanah berbutir halus dapat berpengaruh secara berarti terhadap perilaku keteknikan dari tanah, sehingga kita membutuhkan index acuan untuk menjelaskan pengaruhnya. (Holtz and Kovacs, 1981) In percentage
- 4. 4 Atterberg Limits (Lanjutan) Batas Cair, LL Cair Batas Plastis, PL Plastis Batas Susut, SL Semi Padat Padat Tanah Kering Campuran tanah dan air Kadarairmeingkat
- 5. 5 4.2 Liquid Limit-LL Cone Penetrometer Method (BS 1377: Part 2: 1990:4.3) •This method is developed by the Transport and Road Research Laboratory, UK. •Multipoint test •One-point test Casagrande Method (ASTM D4318-95a) •Professor Casagrande standardized the test and developed the liquid limit device. •Multipoint test •One-point test
- 6. 6 4.2 Liquid Limit-LL (Cont.) Dynamic shear test • Shear strength is about 1.7 ~2.0 kPa. • Pore water suction is about 6.0 kPa. (review by Head, 1992; Mitchell, 1993). Particle sizes and water •Passing No.40 Sieve (0.425 mm). •Using deionized water. The type and amount of cations can significantly affect the measured results.
- 7. 7 4.2.1 Casagrande Method N=25 blows Closing distance = 12.7mm (0.5 in) (Holtz and Kovacs, 1981) •Device The water content, in percentage, required to close a distance of 0.5 in (12.7mm) along the bottom of the groove after 25 blows is defined as the liquid limit
- 8. 8 4.2.1 Casagrande Method (Cont.) .log )( /log , 12 21 contNIw valuepositiveachoose NN ww IindexFlow F F N w •Multipoint Method Das, 1998
- 9. 9 4.2.1 Casagrande Method (Cont.) •One-point Method • Assume a constant slope of the flow curve. • The slope is a statistical result of 767 liquid limit tests. Limitations: • The is an empirical coefficient, so it is not always 0.121. • Good results can be obtained only for the blow number around 20 to 30. 121.0tan 25 tan contentmoistureingcorrespondw blowsofnumberN N wLL n n
- 10. 10 4.2.2 Cone Penetrometer Method •Device (Head, 1992) This method is developed by the Transport and Road Research Laboratory.
- 11. 11 4.2.2 Cone Penetrometer Method (Cont.) •Multipoint Method Water content w% Penetrationofcone(mm) 20 mm LL
- 12. 12 4.2.2 Cone Penetrometer Method (Cont.) 44094.140LL,094.1Factor %,40w,mm15depthnPenetratio (Review by Head, 1992) •One-point Method (an empirical relation) Example:
- 13. 13 4.2.3 Comparison Littleton and Farmilo, 1977 (from Head, 1992) A good correlation between the two methods can be observed as the LL is less than 100.
- 14. 14 4.3 Plastic Limit-PL The plastic limit PL is defined as the water content at which a soil thread with 3.2 mm diameter just crumbles. ASTM D4318-95a, BS1377: Part 2:1990:5.3 (Holtz and Kovacs, 1981)
- 15. 15 4.4 Shrinkage Limit-SL Definition of shrinkage limit: The water content at which the soil volume ceases to change is defined as the shrinkage limit. (Das, 1998) SL
- 16. 16 4.4 Shrinkage Limit-SL (Cont.) (Das, 1998) Soil volume: Vi Soil mass: M1 Soil volume: Vf Soil mass: M2 )100)(( M VV )100( M MM (%)w(%)wSL w 2 fi 2 21 i
- 17. 17 4.5 Typical Values of Atterberg Limits (Mitchell, 1993)
- 18. 18 4.6 Indices •Plasticity index PI For describing the range of water content over which a soil was plastic PI = LL – PL •Liquidity index LI For scaling the natural water content of a soil sample to the Limits. contentwatertheisw PLLL PLw PI PLw LI LI <0 (A), brittle fracture if sheared 0<LI<1 (B), plastic solid if sheared LI >1 (C), viscous liquid if sheared Liquid Limit, LL Liquid State Plastic Limit, PL Plastic State Shrinkage Limit, SL Semisolid State Solid State PI A B C
- 19. 19 4.6 Indices (Cont.) •Sensitivity St (for clays) strengthshearUnconfined )disturbed(Strength )dundisturbe(Strength St (Holtz and Kavocs, 1981) Clay particle Water w > LL
- 20. 20 4.6 Indices (Cont.) •Activity A (Skempton, 1953) mm002.0:fractionclay )weight(fractionclay% PI A Normal clays: 0.75<A<1.25 Inactive clays: A<0.75 Active clays: A> 1.25 High activity: •large volume change when wetted •Large shrinkage when dried •Very reactive (chemically) •Purpose Both the type and amount of clay in soils will affect the Atterberg limits. This index is aimed to separate them. Mitchell, 1993
- 21. 21 • Soil classification (the next topic) • The Atterberg limits are usually correlated with some engineering properties such as the permeability, compressibility, shear strength, and others. In general, clays with high plasticity have lower permeability, and they are difficult to be compacted. The values of SL can be used as a criterion to assess and prevent the excessive cracking of clay liners in the reservoir embankment or canal. 4.7 Engineering Applications The Atterberg limit enable clay soils to be classified.
- 22. 22 8. References Main References: Das, B.M. (1998). Principles of Geotechnical Engineering, 4th edition, PWS Publishing Company. (Chapter 2) Holtz, R.D. and Kovacs, W.D. (1981). An Introduction to Geotechnical Engineering, Prentice Hall. (Chapter 1 and 2) Others: Head, K. H. (1992). Manual of Soil Laboratory Testing, Volume 1: Soil Classification and Compaction Test, 2nd edition, John Wiley and Sons. Ifran, T. Y. (1996). Mineralogy, Fabric Properties and Classification of Weathered Granites in Hong Kong, Quarterly Journal of Engineering Geology, vol. 29, pp. 5-35. Lambe, T.W. (1991). Soil Testing for Engineers, BiTech Publishers Ltd. Mitchell, J.K. (1993). Fundamentals of Soil Behavior, 2nd edition, John Wiley & Sons.
- 23. Latihan 1 Banyak pukulan Kadar air (%) 15 42,0 20 40,8 28 39,1 Uji batas plastis Kadar air = 18,7 a. Gambar Kurva aliran hasil uji batas cair b. Berapa index Plastisitas tanah?
- 24. Latihan 2 Banyak pukulan Kadar air (%) 17 42,1 22 38,2 27 36,2 32 34,1 Uji batas plastis Kadar air = 18,7 a. Gambar Kurva aliran hasil uji batas cair b. Berapa index Plastisitas tanah?
- 25. Latihan 3 Percobaan Batas Cair tanah berbutir halus menggunakan cone penetrometer dengan hasil sebagai berikut Cone Penetration (mm) 15.9 17.7 19.1 20.3 21.5 Moisture Content (%) 32.6 42.9 51.6 59.8 66.2 Dalam Uji Batas plastis tanah batas plastis 25% Tentukan Index Plastisitasnya!
- 26. Latihan 4 Percobaan Batas Cair tanah berbutir halus menggunakan cone penetrometer dengan hasil sebagai berikut Cone Penetration (mm) 15.2 17.3 18.9 21.1 22.8 Moisture Content (%) 33.4 42.6 49.2 59.4 66.8 Dalam Uji Batas plastis tanah batas plastis 33% Tentukan Index Plastisitasnya!