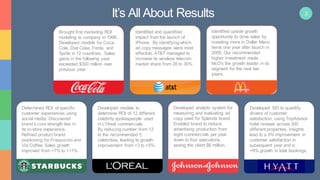
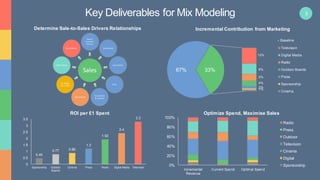
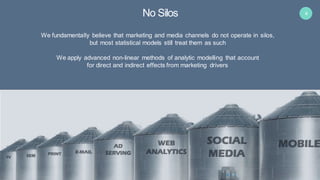
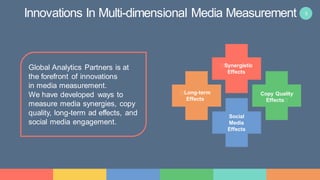
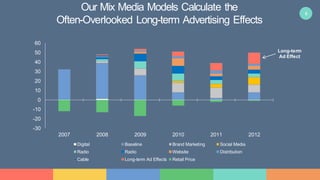
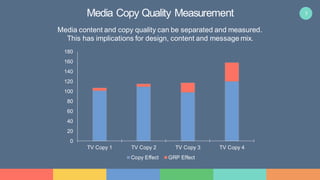
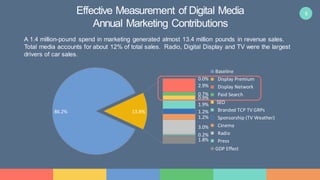
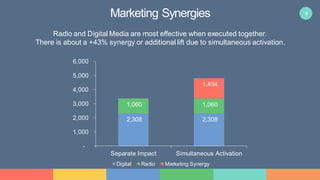
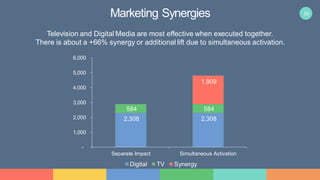
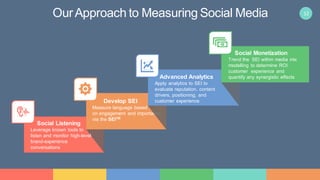
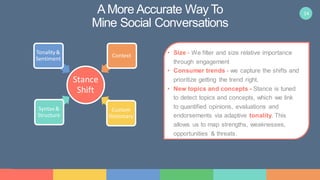
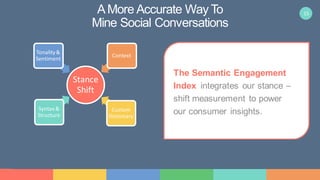
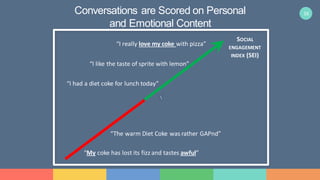
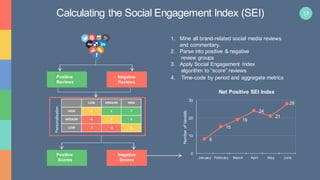
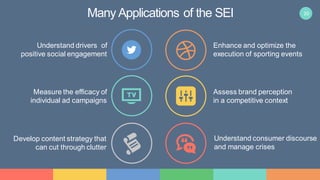
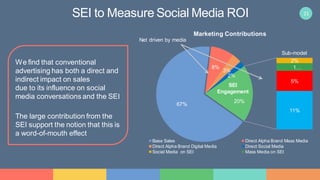
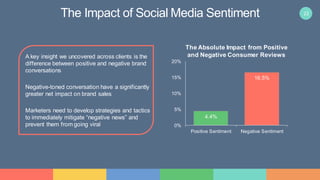
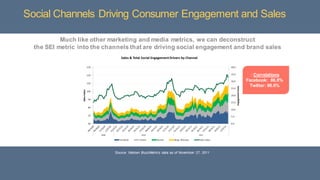
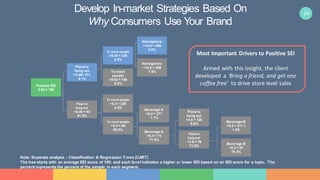
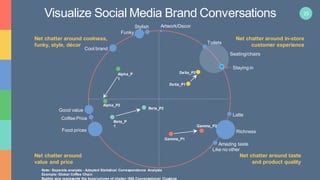
1
Innovations In Marketing
Effectiveness Measurement
2It’s All About Results
Brought first marketing ROI
modeling to company in 1996.
Developed models for Coca-
Cola, Diet Coke, Fanta, and
Sprite in 12 countries.. Sales
gains in the following year
exceeded $300 million over
previous year.
Identified and quantified
impact from the launch of
iPhone. By identifying which
ad copy messages were most
effective, AT&T managed to
increase its wireless telecom
market share from 28 to 30%
Developed analytic system for
measuring and evaluating ad
copy used for Splenda brand.
Enabled brand to reduce
advertising production from
eight commercials per year
down to four executions,
saving the client $6 million.
Developed SEI to quantify
drivers of customer
satisfaction, using TripAdvisor
hotel reviews across 300
different properties. Insights
lead to a 5% improvement in
customer satisfaction in
subsequent year and a
+6% growth in total bookings.
Identified upside growth
opportunity to drive sales by
investing more in Dollar Menu
items one year after launch in
2005. Our recommended
higher investment made
McD's the growth leader in its
segment for the next two
years.
Developed models to
determine ROI of 12 different
celebrity spokespeople used
in L'Oreal commercials.
By reducing number from 12
to the recommended 5
celebrities, leading to growth
improvement from +3 to +5%.
Determined ROI of specific
customer experiences using
social media. Discovered
brand’s core strength lies in
its in-store experience.
Refined product brand
positioning for Frappucino and
Via Coffee. Sales growth
improved from +7% to +11%.
3
0%
20%
40%
60%
80%
100%
Incremental
Revenue
Current Spend Optimal Spend
Radio
Press
Outdoor
Television
Cinema
Digital
Sponsorship
67% 33%
Baseline
1%
2%
4%
5%
8%
12%
Television
Digital Media
Radio
Outdoor Boards
Press
Sponsorship
Cinema
Incremental Contribution from Marketing
Optimize Spend, Maximise Sales
Determine Sale-to-Sales Drivers Relationships
Key Deliverables for Mix Modeling
0.45
0.77 0.86
1.2
1.92
2.4
3.3
0
0.5
1
1.5
2
2.5
3
3.5
Sponsorship Outdoor
Boards
Cinema Press Radio Digital Media Television
ROI per £1 Spent
Sales
Macro-
Economic
Factors
Distribution
Seasonality
Price
Promotions
& Coupons
Sponsorship
TV, Radio,
Print, OOH
Digital Media
Social Media
4
We fundamentally believe that marketing and media channels do not operate in silos,
but most statistical models still treat them as such
We apply advanced non-linear methods of analytic modelling that account
for direct and indirect effects from marketing drivers
No Silos
5
Synergistic
Effects
Long-term
Effects
Social
Media
Effects
Copy Quality
Effects
Innovations In Multi-dimensional Media Measurement
Global Analytics Partners is at
the forefront of innovations
in media measurement.
We have developed ways to
measure media synergies, copy
quality, long-term ad effects, and
social media engagement.
6
Our Mix Media Models Calculate the
Often-Overlooked Long-term Advertising Effects
Most advertising creates an initial short term lift in sales and a prolonged long term
impact. This is generated through repeat purchase and customer loyalty.
-30
-20
-10
0
10
20
30
40
50
60
2007 2008 2009 2010 2011 2012
Digital Baseline Brand Marketing Social Media
Radio Radio Website Distribution
Cable Long-term Ad Effects Retail Price
Long-term
Ad Effect
7
0
20
40
60
80
100
120
140
160
180
TV Copy 1 TV Copy 2 TV Copy 3 TV Copy 4
Copy Effect GRP Effect
Media content and copy quality can be separated and measured.
This has implications for design, content and message mix.
Media Copy Quality Measurement
8Effective Measurement of Digital Media
Annual Marketing Contributions
86.2%
0.0%
2.9%
0.7%
0.9%
1.9%
1.2%
1.2%
3.0%
0.2%
1.8%
13.8%
Baseline
Display Premium
Display Network
Paid Search
SEO
Branded TCP TV GRPs
Sponsorship (TV Weather)
Cinema
Radio
Press
GDP Effect
A 1.4 million-pound spend in marketing generated almost 13.4 million pounds in revenue sales.
Total media accounts for about 12% of total sales. Radio, Digital Display and TV were the largest
drivers of car sales.
9Marketing Synergies
2,308 2,308
1,060 1,060
1,434
-
1,000
2,000
3,000
4,000
5,000
6,000
Separate Impact Simultaneous Activation
Digital Radio Marketing Synergy
Radio and Digital Media are most effective when executed together.
There is about a +43% synergy or additional lift due to simultaneous activation.
10Marketing Synergies
2,308 2,308
584 584
1,909
-
1,000
2,000
3,000
4,000
5,000
6,000
Separate Impact Simultaneous Activation
Digital TV Synergy
Television and Digital Media are most effective when executed together.
There is about a +66% synergy or additional lift due to simultaneous activation.
11
ABreakthrough In Measuring
Social Media Engagement
12OurApproach to Measuring Social Media
Develop SEI
Measure language based
on engagement and importance
via the SEITM
Advanced Analytics
Apply analytics to SEI to
evaluate reputation, content
drivers, positioning, and
customer experience
Social Monetization
Trend the SEI within media mix
modelling to determine ROI
customer experience and
quantify any synergistic effects
Social Listening
Leverage known tools to
listen and monitor high-level
brand-experience
conversations
13AMore Accurate Way To
Mine Social Conversations
Stance
Shift
Syntax &
Structure
Tonality&
Sentiment
Context
Custom
Dictionary
Stance-shift analysis is a published
and peer-reviewed methodology that reveals what
really matters to the consumer: It looks beyond the
words and takes into account the consumers’
verbal shifts in positioning as they communicate. It
accurately captures the emotion, intensity,
appraisal, and commitment in the context of the
conversations, uncovering the deep subtleties of
what is being said. This enables us to solve what
others miss: Size, Trends, and New Topics and
Concepts.
14AMore Accurate Way To
Mine Social Conversations
Stance
Shift
Syntax &
Structure
Tonality&
Sentiment
Context
Custom
Dictionary
• Size - We filter and size relative importance
through engagement
• Consumer trends - we capture the shifts and
prioritize getting the trend right,
• New topics and concepts - Stance is tuned
to detect topics and concepts, which we link
to quantified opinions, evaluations and
endorsements via adaptive tonality. This
allows us to map strengths, weaknesses,
opportunities & threats.
15AMore Accurate Way To
Mine Social Conversations
Stance
Shift
Syntax &
Structure
Tonality&
Sentiment
Context
Custom
Dictionary
The Semantic Engagement
Index integrates our stance –
shift measurement to power
our consumer insights.
16

SOCIAL
ENGAGEMENT
INDEX (SEI)
Conversations are Scored on Personal
and Emotional Content
“I had a diet coke for lunch today”
“The warm Diet Coke was rather GAPnd”
“I really love my coke with pizza”
“I like the taste of sprite with lemon”
“My coke has lost its fizz and tastes awful”
17Calculating the Social Engagement Index (SEI)
1. Mine all brand-related social media reviews
and commentary.
2. Parse into positive & negative
review groups
3. Apply Social Engagement Index
algorithm to “score” reviews
4. Time-code by period and aggregate metrics
Positive
Scores
Emotional Effect
Personalisation
LOW MEDIUM HIGH
HIGH 0 5 7
MEDIUM -5 0 5
LOW -7 -5 0
8
15
19
24
21
28
0
10
20
30
January February March April May June
NumberofVandals
Net Positive SEI Index
Negative
Reviews
Positive
Reviews
Negative
Scores
18
The SEI Out-preforms Other Social Sentiment Metrics
in Measuring the ROI of Customer Experience
83.1%
21.2%
11.2%
8.8%
8.2%
3.1%
-2.3%
-10% 0% 10% 20% 30% 40% 50% 60% 70% 80% 90%
Correlation to sales of $6B client with SEI and the sentiment metrics
of the six leading social data vendors
Sentiment Metric 1
Sentiment Metric 2
Sentiment Metric 3
Sentiment Metric 4
Sentiment Metric 5
Sentiment Metric 6
SEI Pos/Neg Ratio
19
The correlation* to sales over time shows the SEI has predictive power
SEITM
Has Proven Linkage with Brand Sales
Correlation = 86.4% Correlation = 84%
Correlation = 81.1%
Correlation = 83%
Correlation = 83%
* Lead-lag analysis has confirmed that causation is only one way – the SEI to a large degree isable to drive hard commercial
metrics.
20Many Applications of the SEI
Understand drivers of
positive social engagement
Enhance and optimize the
execution of sporting events
Measure the efficacy of
individual ad campaigns
Assess brand perception
in a competitive context
Develop content strategy that
can cut through clutter
Understand consumer discourse
and manage crises
21
67%
8%
3%
2%
2%
1…
5%
11%
20%
Marketing Contributions
Base Sales Direct Alpha Brand Mass Media
Direct Alpha Brand Digital Media Direct Social Media
Social Media on SEI Mass Media on SEI
Net driven by media
SEI
Engagement
Sub-model
SEI to Measure Social Media ROI
We find that conventional
advertising has both a direct and
indirect impact on sales
due to its influence on social
media conversations and the SEI
The large contribution from the
SEI support the notion that this is
a word-of-mouth effect
22
4.4%
16.5%
0%
5%
10%
15%
20%
Positive Sentiment Negative Sentiment
The Absolute Impact from Positive
and Negative Consumer ReviewsA key insight we uncovered across clients is the
difference between positive and negative brand
conversations
Negative-toned conversation have a significantly
greater net impact on brand sales
Marketers need to develop strategies and tactics
to immediately mitigate “negative news” and
prevent them from going viral
The Impact of Social Media Sentiment
23
Source: Nielsen BuzzMetrics data as of November 27, 2011
Social Channels Driving Consumer Engagement and Sales
Much like other marketing and media metrics, we can deconstruct
the SEI metric into the channels that are driving social engagement and brand sales
Correlations
Facebook: 86.8%
Twitter: 86.6%
24
Positive SEI
3.93 = 100
Place to
hang out
>5.46= 211
9.1%
Place to
hangout
<5.46 = 83
91.9%
To meet people
>9.43 = 325
2.6%
To meet
people
<9.63 = 188
6.5%
Atmosphere
>14.0 = 466
0.6%
Atmosphere
<14.0 = 288
1.9%
To meet people
>5.4 = 229
3.8%
To meet people
<5.4 = 85
85.5%
Beverage A
>6.4 = 271
7.7%
Beverage A
<6.4 = 74
77.8%
Place to
hang out
>3.6 = 126
5.9%
Place to
hangout
<3.6 = 76
71.9%
Beverage B
>5.2 = 211.1
1.6%
Beverage B
<5.2 = 67
70.3%
Note: Separate analysis - Classification & Regression Trees (CART)
The tree starts with an average SEI score of 100; and each level indicates a higher or lower SEI based on an SEI score for a topic. The
percent represents the percent of the sample in each segment.
Develop In-market Strategies Based On
Why Consumers Use Your Brand
.
Most Important Drivers to Positive SEI
Armed with this insight, the client
developed a ‘Bring a friend, and get one
coffee free’ to drive store level sales
25
Alpha_P
1
Beta_P
1
Note: Separate analysis - Adapted Statistical Correspondence Analysis
Example: Global Coffee Chain
Bubble size represents the buzz/volume of chatter (SEI Conversational Clusters)
Alpha_P2
Beta_P2
Gamma_P1
Gamma_P2
Net chatter around
value and price
Net chatter around coolness,
funky, style, décor
Net chatter around taste
and product quality
Net chatter around in-store
customer experience
Delta_P2
Delta_P1
Good value
Coffee Price
Food prices
Staying in
Seating/chairs
Toilets
Richness
Latte
Amazing taste
Like no other
Cool brand
Funky
Stylish Artwork/Decor
Visualize Social Media Brand Conversations
26Play Out Marketing What-if Scenarios
An interactive dashboard allows you to simulate
different marketing mix/spend scenarios and assess
the resultant impact on sales and profitability.
1. Set marketing budgets.
2. Set your spend levels
across media channels
3. Assess the resultant impact
on sales & profit
27
Bangalore, IN Office:
No. 141, 2nd Cross,2nd Main,
Domlur,2nd Stage, Bangalore560071
Phone:+91 80 40917572, +91 80 40916116
info@therainman.com
Contact Us US Office:
Suite 100, 1780 Chadds Lake Dr, NE
Marietta, Georgia, 30068-1608
Atlanta, USA
info@bottomlineanalytics.com

Marketing mix.gap

  • 1.
  • 2.
    2It’s All AboutResults Brought first marketing ROI modeling to company in 1996. Developed models for Coca- Cola, Diet Coke, Fanta, and Sprite in 12 countries.. Sales gains in the following year exceeded $300 million over previous year. Identified and quantified impact from the launch of iPhone. By identifying which ad copy messages were most effective, AT&T managed to increase its wireless telecom market share from 28 to 30% Developed analytic system for measuring and evaluating ad copy used for Splenda brand. Enabled brand to reduce advertising production from eight commercials per year down to four executions, saving the client $6 million. Developed SEI to quantify drivers of customer satisfaction, using TripAdvisor hotel reviews across 300 different properties. Insights lead to a 5% improvement in customer satisfaction in subsequent year and a +6% growth in total bookings. Identified upside growth opportunity to drive sales by investing more in Dollar Menu items one year after launch in 2005. Our recommended higher investment made McD's the growth leader in its segment for the next two years. Developed models to determine ROI of 12 different celebrity spokespeople used in L'Oreal commercials. By reducing number from 12 to the recommended 5 celebrities, leading to growth improvement from +3 to +5%. Determined ROI of specific customer experiences using social media. Discovered brand’s core strength lies in its in-store experience. Refined product brand positioning for Frappucino and Via Coffee. Sales growth improved from +7% to +11%.
  • 3.
    3 0% 20% 40% 60% 80% 100% Incremental Revenue Current Spend OptimalSpend Radio Press Outdoor Television Cinema Digital Sponsorship 67% 33% Baseline 1% 2% 4% 5% 8% 12% Television Digital Media Radio Outdoor Boards Press Sponsorship Cinema Incremental Contribution from Marketing Optimize Spend, Maximise Sales Determine Sale-to-Sales Drivers Relationships Key Deliverables for Mix Modeling 0.45 0.77 0.86 1.2 1.92 2.4 3.3 0 0.5 1 1.5 2 2.5 3 3.5 Sponsorship Outdoor Boards Cinema Press Radio Digital Media Television ROI per £1 Spent Sales Macro- Economic Factors Distribution Seasonality Price Promotions & Coupons Sponsorship TV, Radio, Print, OOH Digital Media Social Media
  • 4.
    4 We fundamentally believethat marketing and media channels do not operate in silos, but most statistical models still treat them as such We apply advanced non-linear methods of analytic modelling that account for direct and indirect effects from marketing drivers No Silos
  • 5.
    5 Synergistic Effects Long-term Effects Social Media Effects Copy Quality Effects Innovations InMulti-dimensional Media Measurement Global Analytics Partners is at the forefront of innovations in media measurement. We have developed ways to measure media synergies, copy quality, long-term ad effects, and social media engagement.
  • 6.
    6 Our Mix MediaModels Calculate the Often-Overlooked Long-term Advertising Effects Most advertising creates an initial short term lift in sales and a prolonged long term impact. This is generated through repeat purchase and customer loyalty. -30 -20 -10 0 10 20 30 40 50 60 2007 2008 2009 2010 2011 2012 Digital Baseline Brand Marketing Social Media Radio Radio Website Distribution Cable Long-term Ad Effects Retail Price Long-term Ad Effect
  • 7.
    7 0 20 40 60 80 100 120 140 160 180 TV Copy 1TV Copy 2 TV Copy 3 TV Copy 4 Copy Effect GRP Effect Media content and copy quality can be separated and measured. This has implications for design, content and message mix. Media Copy Quality Measurement
  • 8.
    8Effective Measurement ofDigital Media Annual Marketing Contributions 86.2% 0.0% 2.9% 0.7% 0.9% 1.9% 1.2% 1.2% 3.0% 0.2% 1.8% 13.8% Baseline Display Premium Display Network Paid Search SEO Branded TCP TV GRPs Sponsorship (TV Weather) Cinema Radio Press GDP Effect A 1.4 million-pound spend in marketing generated almost 13.4 million pounds in revenue sales. Total media accounts for about 12% of total sales. Radio, Digital Display and TV were the largest drivers of car sales.
  • 9.
    9Marketing Synergies 2,308 2,308 1,0601,060 1,434 - 1,000 2,000 3,000 4,000 5,000 6,000 Separate Impact Simultaneous Activation Digital Radio Marketing Synergy Radio and Digital Media are most effective when executed together. There is about a +43% synergy or additional lift due to simultaneous activation.
  • 10.
    10Marketing Synergies 2,308 2,308 584584 1,909 - 1,000 2,000 3,000 4,000 5,000 6,000 Separate Impact Simultaneous Activation Digital TV Synergy Television and Digital Media are most effective when executed together. There is about a +66% synergy or additional lift due to simultaneous activation.
  • 11.
  • 12.
    12OurApproach to MeasuringSocial Media Develop SEI Measure language based on engagement and importance via the SEITM Advanced Analytics Apply analytics to SEI to evaluate reputation, content drivers, positioning, and customer experience Social Monetization Trend the SEI within media mix modelling to determine ROI customer experience and quantify any synergistic effects Social Listening Leverage known tools to listen and monitor high-level brand-experience conversations
  • 13.
    13AMore Accurate WayTo Mine Social Conversations Stance Shift Syntax & Structure Tonality& Sentiment Context Custom Dictionary Stance-shift analysis is a published and peer-reviewed methodology that reveals what really matters to the consumer: It looks beyond the words and takes into account the consumers’ verbal shifts in positioning as they communicate. It accurately captures the emotion, intensity, appraisal, and commitment in the context of the conversations, uncovering the deep subtleties of what is being said. This enables us to solve what others miss: Size, Trends, and New Topics and Concepts.
  • 14.
    14AMore Accurate WayTo Mine Social Conversations Stance Shift Syntax & Structure Tonality& Sentiment Context Custom Dictionary • Size - We filter and size relative importance through engagement • Consumer trends - we capture the shifts and prioritize getting the trend right, • New topics and concepts - Stance is tuned to detect topics and concepts, which we link to quantified opinions, evaluations and endorsements via adaptive tonality. This allows us to map strengths, weaknesses, opportunities & threats.
  • 15.
    15AMore Accurate WayTo Mine Social Conversations Stance Shift Syntax & Structure Tonality& Sentiment Context Custom Dictionary The Semantic Engagement Index integrates our stance – shift measurement to power our consumer insights.
  • 16.
    16 SOCIAL ENGAGEMENT INDEX (SEI) Conversations areScored on Personal and Emotional Content “I had a diet coke for lunch today” “The warm Diet Coke was rather GAPnd” “I really love my coke with pizza” “I like the taste of sprite with lemon” “My coke has lost its fizz and tastes awful”
  • 17.
    17Calculating the SocialEngagement Index (SEI) 1. Mine all brand-related social media reviews and commentary. 2. Parse into positive & negative review groups 3. Apply Social Engagement Index algorithm to “score” reviews 4. Time-code by period and aggregate metrics Positive Scores Emotional Effect Personalisation LOW MEDIUM HIGH HIGH 0 5 7 MEDIUM -5 0 5 LOW -7 -5 0 8 15 19 24 21 28 0 10 20 30 January February March April May June NumberofVandals Net Positive SEI Index Negative Reviews Positive Reviews Negative Scores
  • 18.
    18 The SEI Out-preformsOther Social Sentiment Metrics in Measuring the ROI of Customer Experience 83.1% 21.2% 11.2% 8.8% 8.2% 3.1% -2.3% -10% 0% 10% 20% 30% 40% 50% 60% 70% 80% 90% Correlation to sales of $6B client with SEI and the sentiment metrics of the six leading social data vendors Sentiment Metric 1 Sentiment Metric 2 Sentiment Metric 3 Sentiment Metric 4 Sentiment Metric 5 Sentiment Metric 6 SEI Pos/Neg Ratio
  • 19.
    19 The correlation* tosales over time shows the SEI has predictive power SEITM Has Proven Linkage with Brand Sales Correlation = 86.4% Correlation = 84% Correlation = 81.1% Correlation = 83% Correlation = 83% * Lead-lag analysis has confirmed that causation is only one way – the SEI to a large degree isable to drive hard commercial metrics.
  • 20.
    20Many Applications ofthe SEI Understand drivers of positive social engagement Enhance and optimize the execution of sporting events Measure the efficacy of individual ad campaigns Assess brand perception in a competitive context Develop content strategy that can cut through clutter Understand consumer discourse and manage crises
  • 21.
    21 67% 8% 3% 2% 2% 1… 5% 11% 20% Marketing Contributions Base SalesDirect Alpha Brand Mass Media Direct Alpha Brand Digital Media Direct Social Media Social Media on SEI Mass Media on SEI Net driven by media SEI Engagement Sub-model SEI to Measure Social Media ROI We find that conventional advertising has both a direct and indirect impact on sales due to its influence on social media conversations and the SEI The large contribution from the SEI support the notion that this is a word-of-mouth effect
  • 22.
    22 4.4% 16.5% 0% 5% 10% 15% 20% Positive Sentiment NegativeSentiment The Absolute Impact from Positive and Negative Consumer ReviewsA key insight we uncovered across clients is the difference between positive and negative brand conversations Negative-toned conversation have a significantly greater net impact on brand sales Marketers need to develop strategies and tactics to immediately mitigate “negative news” and prevent them from going viral The Impact of Social Media Sentiment
  • 23.
    23 Source: Nielsen BuzzMetricsdata as of November 27, 2011 Social Channels Driving Consumer Engagement and Sales Much like other marketing and media metrics, we can deconstruct the SEI metric into the channels that are driving social engagement and brand sales Correlations Facebook: 86.8% Twitter: 86.6%
  • 24.
    24 Positive SEI 3.93 =100 Place to hang out >5.46= 211 9.1% Place to hangout <5.46 = 83 91.9% To meet people >9.43 = 325 2.6% To meet people <9.63 = 188 6.5% Atmosphere >14.0 = 466 0.6% Atmosphere <14.0 = 288 1.9% To meet people >5.4 = 229 3.8% To meet people <5.4 = 85 85.5% Beverage A >6.4 = 271 7.7% Beverage A <6.4 = 74 77.8% Place to hang out >3.6 = 126 5.9% Place to hangout <3.6 = 76 71.9% Beverage B >5.2 = 211.1 1.6% Beverage B <5.2 = 67 70.3% Note: Separate analysis - Classification & Regression Trees (CART) The tree starts with an average SEI score of 100; and each level indicates a higher or lower SEI based on an SEI score for a topic. The percent represents the percent of the sample in each segment. Develop In-market Strategies Based On Why Consumers Use Your Brand . Most Important Drivers to Positive SEI Armed with this insight, the client developed a ‘Bring a friend, and get one coffee free’ to drive store level sales
  • 25.
    25 Alpha_P 1 Beta_P 1 Note: Separate analysis- Adapted Statistical Correspondence Analysis Example: Global Coffee Chain Bubble size represents the buzz/volume of chatter (SEI Conversational Clusters) Alpha_P2 Beta_P2 Gamma_P1 Gamma_P2 Net chatter around value and price Net chatter around coolness, funky, style, décor Net chatter around taste and product quality Net chatter around in-store customer experience Delta_P2 Delta_P1 Good value Coffee Price Food prices Staying in Seating/chairs Toilets Richness Latte Amazing taste Like no other Cool brand Funky Stylish Artwork/Decor Visualize Social Media Brand Conversations
  • 26.
    26Play Out MarketingWhat-if Scenarios An interactive dashboard allows you to simulate different marketing mix/spend scenarios and assess the resultant impact on sales and profitability. 1. Set marketing budgets. 2. Set your spend levels across media channels 3. Assess the resultant impact on sales & profit
  • 27.
    27 Bangalore, IN Office: No.141, 2nd Cross,2nd Main, Domlur,2nd Stage, Bangalore560071 Phone:+91 80 40917572, +91 80 40916116 info@therainman.com Contact Us US Office: Suite 100, 1780 Chadds Lake Dr, NE Marietta, Georgia, 30068-1608 Atlanta, USA info@bottomlineanalytics.com