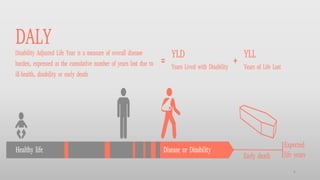
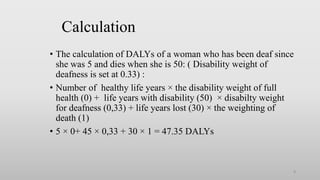
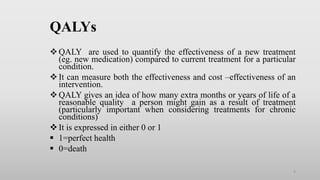
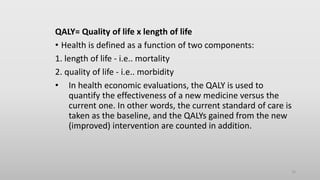
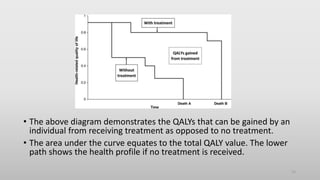
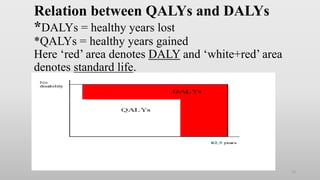
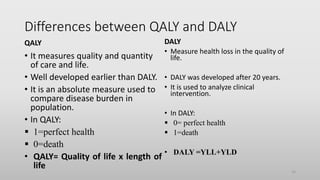
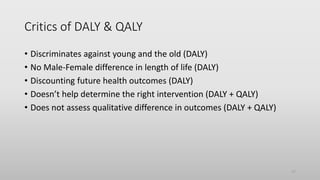
This document provides an overview of DALYs (Disability-Adjusted Life Years) and QALYs (Quality-Adjusted Life Years), which are measurements used to calculate the quality and quantity of life. DALYs measure overall disease burden in terms of years of life lost due to ill-health, disability or early death. QALYs measure effectiveness of treatments by combining quality and length of life. Both methods assign a weight between 0 and 1 to different health states, with 0 representing death and 1 representing perfect health. The document discusses the calculation and uses of DALYs and QALYs, and highlights some differences and criticisms of the approaches.
The general shift from acute infectious and deficiency diseases characteristic of underdevelopment to chronic non-communicable diseases characteristic of modernization and advanced levels of development is usually referred to as the "epidemiological transition".
Declaration: The materials incorporated in this document have come from variety of sources and compiler bears no responsibilities for any information contained herein. The compiler acknowledges all the sources although references have not been explicitly cited for all the contents in this document.
The Burden of Disease ( BOD) analysis describes in details the uses and effects of BOD. How to measure it. Special emphasis has been given in understanding HALY, DALY and QALY.
N.B: 1. Please download the ppt first, as the animations will act better then
2. There are few hidden slides in the presentation, which you may explore too.
Here is the slide on Healthcare economic evaluation. The content of this presentation doesn't belong to me. They are copied from several literature and internet
Declaration: The materials incorporated in this document have come from variety of sources and compiler bears no responsibilities for any information contained herein. The compiler acknowledges all the sources although references have not been explicitly cited for all the contents in this document.
an individual’s perception of their position in life in the context of the cultural and value systems in which they live and in relation to their goals, expectations, standards and concerns
Declaration: The materials incorporated in this document have come from variety of sources and compiler bears no responsibilities for any information contained herein. The compiler acknowledges all the sources although references have not been explicitly cited for all the contents in this document.
Valuing health states associated with chronic disorders of consciousness shah...Office of Health Economics
This presentation reviews current methods for capturing how the general public values health states as background for discussion on applying these to chronic disorders of consciousness.
Morbidity has been defined as any departure, subjective or objective, from a state of physiological or psychological well-being. In practice, morbidity encompasses disease, injury, and disability.
The process of healthcare is undertaken so that people can benefit from the intervention. An economic evaluation looks at all the implications of deciding to choose one way of providing care over another, not just the costs. This means that any effect the service, good or bad, has on the patient or customer needs to be investigated
Indicator is a variable which gives an indication of a given situation or a reflection of that situation.
Health Indicator is a variable, susceptible to direct measurement, that reflects the state of health of persons in a community.
Indicators help to measure the extent to which the objectives and targets of a programme are being attained.
The European Unemployment Puzzle: implications from population agingGRAPE
We study the link between the evolving age structure of the working population and unemployment. We build a large new Keynesian OLG model with a realistic age structure, labor market frictions, sticky prices, and aggregate shocks. Once calibrated to the European economy, we quantify the extent to which demographic changes over the last three decades have contributed to the decline of the unemployment rate. Our findings yield important implications for the future evolution of unemployment given the anticipated further aging of the working population in Europe. We also quantify the implications for optimal monetary policy: lowering inflation volatility becomes less costly in terms of GDP and unemployment volatility, which hints that optimal monetary policy may be more hawkish in an aging society. Finally, our results also propose a partial reversal of the European-US unemployment puzzle due to the fact that the share of young workers is expected to remain robust in the US.
How to get verified on Coinbase Account?_.docxBuy bitget
t's important to note that buying verified Coinbase accounts is not recommended and may violate Coinbase's terms of service. Instead of searching to "buy verified Coinbase accounts," follow the proper steps to verify your own account to ensure compliance and security.
how to sell pi coins effectively (from 50 - 100k pi)DOT TECH
Anywhere in the world, including Africa, America, and Europe, you can sell Pi Network Coins online and receive cash through online payment options.
Pi has not yet been launched on any exchange because we are currently using the confined Mainnet. The planned launch date for Pi is June 28, 2026.
Reselling to investors who want to hold until the mainnet launch in 2026 is currently the sole way to sell.
Consequently, right now. All you need to do is select the right pi network provider.
Who is a pi merchant?
An individual who buys coins from miners on the pi network and resells them to investors hoping to hang onto them until the mainnet is launched is known as a pi merchant.
debuts.
I'll provide you the Telegram username
@Pi_vendor_247
how can I sell pi coins after successfully completing KYCDOT TECH
Pi coins is not launched yet in any exchange 💱 this means it's not swappable, the current pi displaying on coin market cap is the iou version of pi. And you can learn all about that on my previous post.
RIGHT NOW THE ONLY WAY you can sell pi coins is through verified pi merchants. A pi merchant is someone who buys pi coins and resell them to exchanges and crypto whales. Looking forward to hold massive quantities of pi coins before the mainnet launch.
This is because pi network is not doing any pre-sale or ico offerings, the only way to get my coins is from buying from miners. So a merchant facilitates the transactions between the miners and these exchanges holding pi.
I and my friends has sold more than 6000 pi coins successfully with this method. I will be happy to share the contact of my personal pi merchant. The one i trade with, if you have your own merchant you can trade with them. For those who are new.
Message: @Pi_vendor_247 on telegram.
I wouldn't advise you selling all percentage of the pi coins. Leave at least a before so its a win win during open mainnet. Have a nice day pioneers ♥️
#kyc #mainnet #picoins #pi #sellpi #piwallet
#pinetwork
Turin Startup Ecosystem 2024 - Ricerca sulle Startup e il Sistema dell'Innov...Quotidiano Piemontese
Turin Startup Ecosystem 2024
Una ricerca de il Club degli Investitori, in collaborazione con ToTeM Torino Tech Map e con il supporto della ESCP Business School e di Growth Capital
Yes of course, you can easily start mining pi network coin today and sell to legit pi vendors in the United States.
Here the telegram contact of my personal vendor.
@Pi_vendor_247
#pi network #pi coins #legit #passive income
#US
Lecture slide titled Fraud Risk Mitigation, Webinar Lecture Delivered at the Society for West African Internal Audit Practitioners (SWAIAP) on Wednesday, November 8, 2023.
What website can I sell pi coins securely.DOT TECH
Currently there are no website or exchange that allow buying or selling of pi coins..
But you can still easily sell pi coins, by reselling it to exchanges/crypto whales interested in holding thousands of pi coins before the mainnet launch.
Who is a pi merchant?
A pi merchant is someone who buys pi coins from miners and resell to these crypto whales and holders of pi..
This is because pi network is not doing any pre-sale. The only way exchanges can get pi is by buying from miners and pi merchants stands in between the miners and the exchanges.
How can I sell my pi coins?
Selling pi coins is really easy, but first you need to migrate to mainnet wallet before you can do that. I will leave the telegram contact of my personal pi merchant to trade with.
Tele-gram.
@Pi_vendor_247
2. Elemental Economics - Mineral demand.pdfNeal Brewster
After this second you should be able to: Explain the main determinants of demand for any mineral product, and their relative importance; recognise and explain how demand for any product is likely to change with economic activity; recognise and explain the roles of technology and relative prices in influencing demand; be able to explain the differences between the rates of growth of demand for different products.
US Economic Outlook - Being Decided - M Capital Group August 2021.pdfpchutichetpong
The U.S. economy is continuing its impressive recovery from the COVID-19 pandemic and not slowing down despite re-occurring bumps. The U.S. savings rate reached its highest ever recorded level at 34% in April 2020 and Americans seem ready to spend. The sectors that had been hurt the most by the pandemic specifically reduced consumer spending, like retail, leisure, hospitality, and travel, are now experiencing massive growth in revenue and job openings.
Could this growth lead to a “Roaring Twenties”? As quickly as the U.S. economy contracted, experiencing a 9.1% drop in economic output relative to the business cycle in Q2 2020, the largest in recorded history, it has rebounded beyond expectations. This surprising growth seems to be fueled by the U.S. government’s aggressive fiscal and monetary policies, and an increase in consumer spending as mobility restrictions are lifted. Unemployment rates between June 2020 and June 2021 decreased by 5.2%, while the demand for labor is increasing, coupled with increasing wages to incentivize Americans to rejoin the labor force. Schools and businesses are expected to fully reopen soon. In parallel, vaccination rates across the country and the world continue to rise, with full vaccination rates of 50% and 14.8% respectively.
However, it is not completely smooth sailing from here. According to M Capital Group, the main risks that threaten the continued growth of the U.S. economy are inflation, unsettled trade relations, and another wave of Covid-19 mutations that could shut down the world again. Have we learned from the past year of COVID-19 and adapted our economy accordingly?
“In order for the U.S. economy to continue growing, whether there is another wave or not, the U.S. needs to focus on diversifying supply chains, supporting business investment, and maintaining consumer spending,” says Grace Feeley, a research analyst at M Capital Group.
While the economic indicators are positive, the risks are coming closer to manifesting and threatening such growth. The new variants spreading throughout the world, Delta, Lambda, and Gamma, are vaccine-resistant and muddy the predictions made about the economy and health of the country. These variants bring back the feeling of uncertainty that has wreaked havoc not only on the stock market but the mindset of people around the world. MCG provides unique insight on how to mitigate these risks to possibly ensure a bright economic future.
2. INTRODUCTION
Quality adjusted life years(QALY) and Disability adjusted life
years(DALY) are both measurements to calculate the quality and
quantity of life either of individuals or the general population.
QALY was developed earlier than DALY. After 20 years, DALY was
developed by Harvard University in 1900. A decade later, it was
adopted by the World Health Organization (WHO).
The DALY is a measure of overall disease burden. The DALY is
becoming increasingly common in the field of public health and
health impact assessment.
And the QALY is considered to be the cornerstone of economic
analysis which combines both morbidity gains and the mortality
impact of a treatment.
2
3. DALYs and QALYS are both measurements used in order to
calculate time (life years) of an individual or a general population.
The concept of time illness diseases and health treatments are
major and recurring factor in both methods of measurement.
They also share a common technique of weighing the cost per
healthy unit measure.
3
4. DALYs
DALY stands for Disability-Adjusted Life Year.
DALY is the only quantitative indicator of burden of diseases
and measure of overall disease burden, expressed as the
number of years lost due to ill-health, disability or early death.
It reflects the total year lost(pre-mature mortality) or some
degree of disability(morbidity) during a period of time
DALYs are calculated by combining measures of life expectancy
as well as the adjusted quality of life during diseases or disability
for a population.
4
5. Premature mortality is measured as a years of life lost (YLLs )
Morbidity is measured in terms of years lived with a disability
(YLDs)
One DALY represents one lost year of healthy life.
DALY is expressed in either 0 or 1, where
0= perfect health
1=death
One DALY represents one lost year of healthy life.
5
7. Uses
• Quantitative analysis of the burden of disease
• Analysis of cost-effectiveness of alternative interventions
• Selection of a package or list of interventions deliverable
within the available budget
7
8. Calculation
• The calculation of DALYs of a woman who has been deaf since
she was 5 and dies when she is 50: ( Disability weight of
deafness is set at 0.33) :
• Number of healthy life years × the disability weight of full
health (0) + life years with disability (50) × disabilty weight
for deafness (0,33) + life years lost (30) × the weighting of
death (1)
• 5 × 0+ 45 × 0,33 + 30 × 1 = 47.35 DALYs
8
9. QALYs
QALY are used to quantify the effectiveness of a new treatment
(eg. new medication) compared to current treatment for a particular
condition.
It can measure both the effectiveness and cost –effectiveness of an
intervention.
QALY gives an idea of how many extra months or years of life of a
reasonable quality a person might gain as a result of treatment
(particularly important when considering treatments for chronic
conditions)
It is expressed in either 0 or 1
1=perfect health
0=death
9
10. QALY= Quality of life x length of life
• Health is defined as a function of two components:
1. length of life - i.e.. mortality
2. quality of life - i.e.. morbidity
• In health economic evaluations, the QALY is used to
quantify the effectiveness of a new medicine versus the
current one. In other words, the current standard of care is
taken as the baseline, and the QALYs gained from the new
(improved) intervention are counted in addition.
10
11. 1. If an individual has perfect health for a period of 1 year, they
will be said to have 1 QALY.
i.e.. 1 Year of Life x 1 Utility Value = 1 QALY
2. If an individual lives in perfect health but only for half a year,
that individual will have 0.5 QALY.
i.e.. 0.5 Years of Life x 1 Utility Value = 0.5 QALY
3. If an individual lives for 1 year in a situation with 0.5 utility
(half of perfect health) that individual will have 0.5 QALY
i.e.. 1 Year of Life x 0.5 Utility Value = 0.5 QALY
11
12. Uses of QALY-
• QALYs are used to quantify the effectiveness of a new treatment
(eg. new medication) compared to the current treatment for a
particular condition.
• QALYs can also be used to compare the health benefit of a new
treatment for one condition with the health benefit of a new
treatment for a different condition. .
• QALYs can also be used to evaluate the cost effectiveness of a
treatment, that is how much the drug or treatment costs per
QALY.
12
13. • The above diagram demonstrates the QALYs that can be gained by an
individual from receiving treatment as opposed to no treatment.
• The area under the curve equates to the total QALY value. The lower
path shows the health profile if no treatment is received.
13
14. Example
• If a person lives for 3 years with a disease and the current
standard of care for that disease means he/she lives with a
utility level of 0.7, that person will have 2.1 QALYs.
(3 Years of Life x 0.7 Utility Value = 2.1 QALYs)
14
15. Relation between QALYs and DALYs
*DALYs = healthy years lost
*QALYs = healthy years gained
Here ‘red’ area denotes DALY and ‘white+red’ area
denotes standard life.
15
16. Differences between QALY and DALY
QALY
• It measures quality and quantity
of care and life.
• Well developed earlier than DALY.
• It is an absolute measure used to
compare disease burden in
population.
• In QALY:
1=perfect health
0=death
• QALY= Quality of life x length of
life
DALY
• Measure health loss in the quality of
life.
• DALY was developed after 20 years.
• It is used to analyze clinical
intervention.
• In DALY:
0= perfect health
1=death
• DALY =YLL+YLD
16
17. Critics of DALY & QALY
• Discriminates against young and the old (DALY)
• No Male-Female difference in length of life (DALY)
• Discounting future health outcomes (DALY)
• Doesn’t help determine the right intervention (DALY + QALY)
• Does not assess qualitative difference in outcomes (DALY + QALY)
17