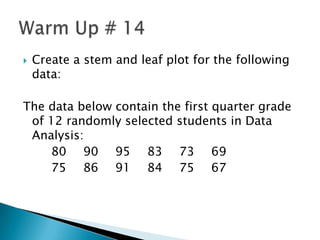
1. Create a stem and leaf plot for the following data: The data below contain the first quarter grade of 12 randomly selected students in Data Analysis: 80 90 95 83 73 69 75 86 91 84 75 67 Warm Up # 14
3. 12.2 Measures of Central Tendency (p.644) Mean, Median, Mode and Midrange
4. Obtained by adding all the data items and then dividing the sum by the number of items Formula: ∑ x / n - Mean
5. The middle set or ranked or ordered data To find the median, arrange the data from smallest to largest If the number of data items is odd, the median is the item in the middle of the list. If the number of data items is even, the data is the average of the two middle numbers. Median
6. The data value that occurs most often in the data set. If no data items are repeated, then the data set has no mode. If more than one value has the highest frequency, then each of the data is a mode. Mode
7. Found by adding the lowest and highest data values and dividing the sum by 2. Midrange = lowest + highest 2 Midrange