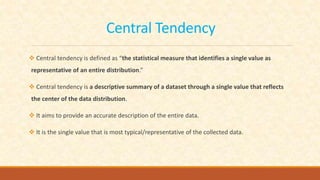
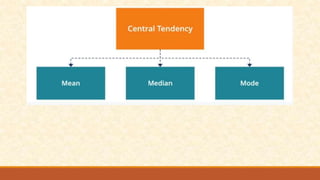
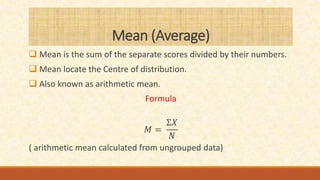
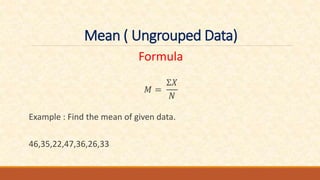
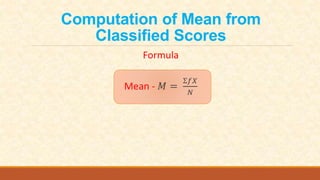
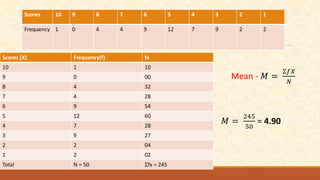
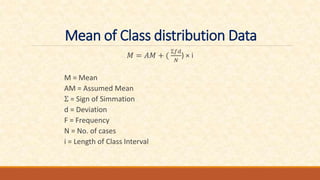
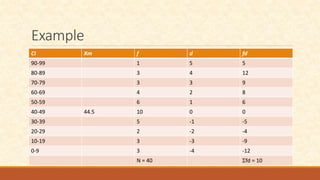
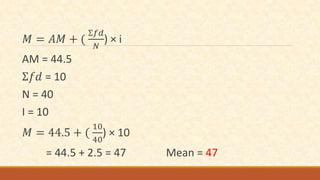
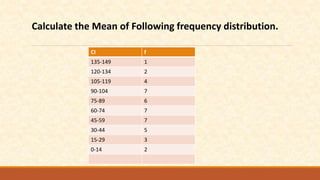
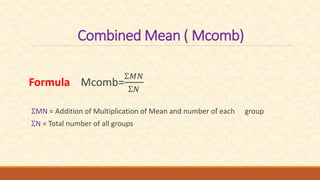
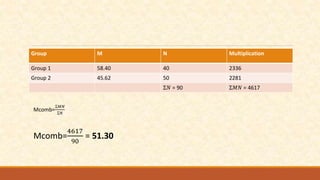
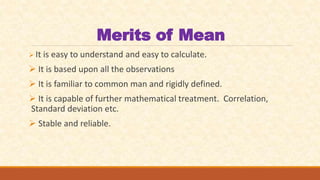
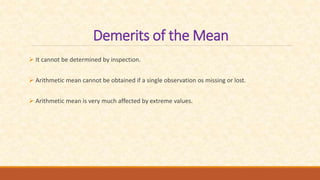
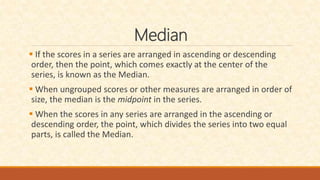
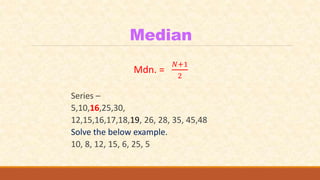
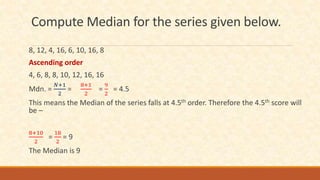
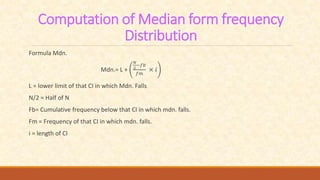
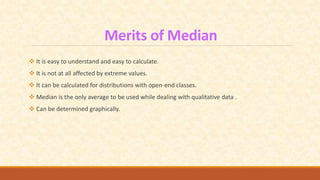
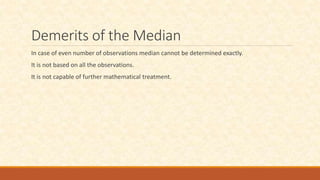
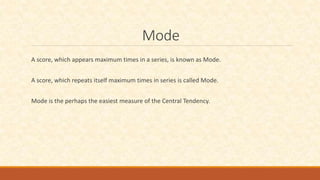
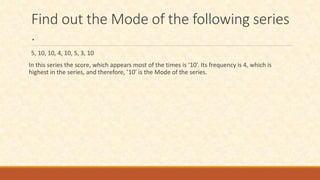
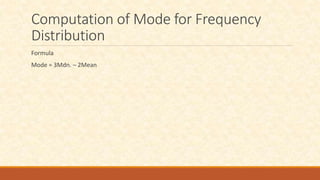
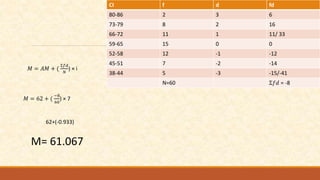
Measures of Central
Tendency
DR. NAVNATH DNYANDEO INDALKAR
ASSISTANT PROFESSOR,
SMT. PUTALABEN SHAH COLLEGE OF EDUCATION, SANGLI
Central Tendency
 Central tendency is defined as “the statistical measure that identifies a single value as
representative of an entire distribution.”
 Central tendency is a descriptive summary of a dataset through a single value that reflects
the center of the data distribution.
 It aims to provide an accurate description of the entire data.
 It is the single value that is most typical/representative of the collected data.
Normal Possible Curve
Mean (Average)
 Mean is the sum of the separate scores divided by their numbers.
 Mean locate the Centre of distribution.
 Also known as arithmetic mean.
Formula
𝑀 =
Ʃ𝑋
𝑁
( arithmetic mean calculated from ungrouped data)
Mean ( Ungrouped Data)
Formula
𝑀 =
Ʃ𝑋
𝑁
Example : Find the mean of given data.
46,35,22,47,36,26,33
Computation of Mean from
Classified Scores
Formula
Mean - 𝑀 =
Ʃ𝑓𝑋
𝑁
Scores 10 9 8 7 6 5 4 3 2 1
Frequency 1 0 4 4 9 12 7 9 2 2
Scores (X) Frequency(f) fx
10 1 10
9 0 00
8 4 32
7 4 28
6 9 54
5 12 60
4 7 28
3 9 27
2 2 04
1 2 02
Total N = 50 ĆŠfx = 245
Mean - 𝑀 =
Ʃ𝑓𝑋
𝑁
𝑀 =
245
50
= 4.90
Mean of Class distribution Data
𝑀 = 𝐴𝑀 + (
Ʃ𝑓𝑑
𝑁
) × i
M = Mean
AM = Assumed Mean
ĆŠ = Sign of Simmation
d = Deviation
F = Frequency
N = No. of cases
i = Length of Class Interval
Example
CI Xm f d fd
90-99 1 5 5
80-89 3 4 12
70-79 3 3 9
60-69 4 2 8
50-59 6 1 6
40-49 44.5 10 0 0
30-39 5 -1 -5
20-29 2 -2 -4
10-19 3 -3 -9
0-9 3 -4 -12
N = 40 ĆŠfd = 10
𝑀 = 𝐴𝑀 + (
Ʃ𝑓𝑑
𝑁
) × i
AM = 44.5
Ʃ𝑓𝑑 = 10
N = 40
I = 10
𝑀 = 44.5 + (
10
40
) × 10
= 44.5 + 2.5 = 47 Mean = 47
CI f
135-149 1
120-134 2
105-119 4
90-104 7
75-89 6
60-74 7
45-59 7
30-44 5
15-29 3
0-14 2
Calculate the Mean of Following frequency distribution.
Combined Mean ( Mcomb)
Formula Mcomb=
Ʃ𝑀𝑁
Ʃ𝑁
ĆŠMN = Addition of Multiplication of Mean and number of each group
ĆŠN = Total number of all groups
Group M N Multiplication
Group 1 58.40 40 2336
Group 2 45.62 50 2281
Ʃ𝑁 = 90 Ʃ𝑀𝑁 = 4617
Mcomb=
Ʃ𝑀𝑁
Ʃ𝑁
Mcomb=
4617
90
= 51.30
Merits of Mean
 It is easy to understand and easy to calculate.
 It is based upon all the observations
 It is familiar to common man and rigidly defined.
 It is capable of further mathematical treatment. Correlation,
Standard deviation etc.
 Stable and reliable.
Demerits of the Mean
 It cannot be determined by inspection.
 Arithmetic mean cannot be obtained if a single observation os missing or lost.
 Arithmetic mean is very much affected by extreme values.
Median
 If the scores in a series are arranged in ascending or descending
order, then the point, which comes exactly at the center of the
series, is known as the Median.
 When ungrouped scores or other measures are arranged in order of
size, the median is the midpoint in the series.
 When the scores in any series are arranged in the ascending or
descending order, the point, which divides the series into two equal
parts, is called the Median.
Median
Mdn. =
𝑁+1
2
Series –
5,10,16,25,30,
12,15,16,17,18,19, 26, 28, 35, 45,48
Solve the below example.
10, 8, 12, 15, 6, 25, 5
Compute Median for the series given below.
8, 12, 4, 16, 6, 10, 16, 8
Ascending order
4, 6, 8, 8, 10, 12, 16, 16
Mdn. =
𝑁+1
2
=
8+1
2
=
9
2
= 4.5
This means the Median of the series falls at 4.5th order. Therefore the 4.5th score will
be –
8+10
2
=
18
2
= 9
The Median is 9
Computation of Median form frequency
Distribution
Formula Mdn.
Mdn.= L +
𝑁
2
−𝑓𝑏
𝑓𝑚
× 𝑖
L = lower limit of that CI in which Mdn. Falls
N/2 = Half of N
Fb= Cumulative frequency below that CI in which mdn. falls.
Fm = Frequency of that CI in which mdn. falls.
i = length of CI
CI f cf
37-39 1 54
34-36 3 53
31-33 4 50
28-30 3 46
25-27 8 43
22-24 5 35
19-21 9 (fm) 30
16-18 7 21 (fb)
13-15 5 14
10-12 9 9
Mdn.= L +
𝑁
2
−𝑓𝑏
𝑓𝑚
× 𝑖
Mdn.= 18.5 +
54
2
−21
9
× 3
18.5 + 2 = 20.50
Mdn. = 20.50
CI 124
-
131
116
-
123
108
-
115
100
-
107
92-
99
84-
91
76-
83
68-
75
60-
67
52-
59
f 3 6 9 12 14 9 7 5 3 2
Compute Median for the given data .
Merits of Median
 It is easy to understand and easy to calculate.
 It is not at all affected by extreme values.
 It can be calculated for distributions with open-end classes.
 Median is the only average to be used while dealing with qualitative data .
 Can be determined graphically.
Demerits of the Median
In case of even number of observations median cannot be determined exactly.
It is not based on all the observations.
It is not capable of further mathematical treatment.
Mode
A score, which appears maximum times in a series, is known as Mode.
A score, which repeats itself maximum times in series is called Mode.
Mode is the perhaps the easiest measure of the Central Tendency.
Find out the Mode of the following series
.
5, 10, 10, 4, 10, 5, 3, 10
In this series the score, which appears most of the times is ‘10’. Its frequency is 4, which is
highest in the series, and therefore, ’10’ is the Mode of the series.
Computation of Mode for Frequency
Distribution
Formula
Mode = 3Mdn. – 2Mean
CI f d fd
80-86 2 3 6
73-79 8 2 16
66-72 11 1 11/ 33
59-65 15 0 0
52-58 12 -1 -12
45-51 7 -2 -14
38-44 5 -3 -15/-41
N=60 Ʃ𝑓𝑑 = -8
𝑀 = 𝐴𝑀 + (
Ʃ𝑓𝑑
𝑁
) × i
𝑀 = 62 + (
−8
60
) × 7
62+(-0.933)
M= 61.067

central tendency.pptx

  • 1.
    Measures of Central Tendency DR.NAVNATH DNYANDEO INDALKAR ASSISTANT PROFESSOR, SMT. PUTALABEN SHAH COLLEGE OF EDUCATION, SANGLI
  • 3.
    Central Tendency  Centraltendency is defined as “the statistical measure that identifies a single value as representative of an entire distribution.”  Central tendency is a descriptive summary of a dataset through a single value that reflects the center of the data distribution.  It aims to provide an accurate description of the entire data.  It is the single value that is most typical/representative of the collected data.
  • 4.
  • 6.
    Mean (Average)  Meanis the sum of the separate scores divided by their numbers.  Mean locate the Centre of distribution.  Also known as arithmetic mean. Formula 𝑀 = Ʃ𝑋 𝑁 ( arithmetic mean calculated from ungrouped data)
  • 7.
    Mean ( UngroupedData) Formula 𝑀 = Ʃ𝑋 𝑁 Example : Find the mean of given data. 46,35,22,47,36,26,33
  • 8.
    Computation of Meanfrom Classified Scores Formula Mean - 𝑀 = Ʃ𝑓𝑋 𝑁
  • 9.
    Scores 10 98 7 6 5 4 3 2 1 Frequency 1 0 4 4 9 12 7 9 2 2 Scores (X) Frequency(f) fx 10 1 10 9 0 00 8 4 32 7 4 28 6 9 54 5 12 60 4 7 28 3 9 27 2 2 04 1 2 02 Total N = 50 Ʃfx = 245 Mean - 𝑀 = Ʃ𝑓𝑋 𝑁 𝑀 = 245 50 = 4.90
  • 10.
    Mean of Classdistribution Data 𝑀 = 𝐴𝑀 + ( Ʃ𝑓𝑑 𝑁 ) × i M = Mean AM = Assumed Mean Ʃ = Sign of Simmation d = Deviation F = Frequency N = No. of cases i = Length of Class Interval
  • 11.
    Example CI Xm fd fd 90-99 1 5 5 80-89 3 4 12 70-79 3 3 9 60-69 4 2 8 50-59 6 1 6 40-49 44.5 10 0 0 30-39 5 -1 -5 20-29 2 -2 -4 10-19 3 -3 -9 0-9 3 -4 -12 N = 40 ĆŠfd = 10
  • 12.
    𝑀 = 𝐴𝑀+ ( Ʃ𝑓𝑑 𝑁 ) × i AM = 44.5 Ʃ𝑓𝑑 = 10 N = 40 I = 10 𝑀 = 44.5 + ( 10 40 ) × 10 = 44.5 + 2.5 = 47 Mean = 47
  • 13.
    CI f 135-149 1 120-1342 105-119 4 90-104 7 75-89 6 60-74 7 45-59 7 30-44 5 15-29 3 0-14 2 Calculate the Mean of Following frequency distribution.
  • 14.
    Combined Mean (Mcomb) Formula Mcomb= Ʃ𝑀𝑁 Ʃ𝑁 ƩMN = Addition of Multiplication of Mean and number of each group ƩN = Total number of all groups
  • 15.
    Group M NMultiplication Group 1 58.40 40 2336 Group 2 45.62 50 2281 Ʃ𝑁 = 90 Ʃ𝑀𝑁 = 4617 Mcomb= Ʃ𝑀𝑁 Ʃ𝑁 Mcomb= 4617 90 = 51.30
  • 16.
    Merits of Mean It is easy to understand and easy to calculate.  It is based upon all the observations  It is familiar to common man and rigidly defined.  It is capable of further mathematical treatment. Correlation, Standard deviation etc.  Stable and reliable.
  • 17.
    Demerits of theMean  It cannot be determined by inspection.  Arithmetic mean cannot be obtained if a single observation os missing or lost.  Arithmetic mean is very much affected by extreme values.
  • 19.
    Median  If thescores in a series are arranged in ascending or descending order, then the point, which comes exactly at the center of the series, is known as the Median.  When ungrouped scores or other measures are arranged in order of size, the median is the midpoint in the series.  When the scores in any series are arranged in the ascending or descending order, the point, which divides the series into two equal parts, is called the Median.
  • 20.
    Median Mdn. = 𝑁+1 2 Series – 5,10,16,25,30, 12,15,16,17,18,19,26, 28, 35, 45,48 Solve the below example. 10, 8, 12, 15, 6, 25, 5
  • 21.
    Compute Median forthe series given below. 8, 12, 4, 16, 6, 10, 16, 8 Ascending order 4, 6, 8, 8, 10, 12, 16, 16 Mdn. = 𝑁+1 2 = 8+1 2 = 9 2 = 4.5 This means the Median of the series falls at 4.5th order. Therefore the 4.5th score will be – 8+10 2 = 18 2 = 9 The Median is 9
  • 22.
    Computation of Medianform frequency Distribution Formula Mdn. Mdn.= L + 𝑁 2 −𝑓𝑏 𝑓𝑚 × 𝑖 L = lower limit of that CI in which Mdn. Falls N/2 = Half of N Fb= Cumulative frequency below that CI in which mdn. falls. Fm = Frequency of that CI in which mdn. falls. i = length of CI
  • 23.
    CI f cf 37-391 54 34-36 3 53 31-33 4 50 28-30 3 46 25-27 8 43 22-24 5 35 19-21 9 (fm) 30 16-18 7 21 (fb) 13-15 5 14 10-12 9 9 Mdn.= L + 𝑁 2 −𝑓𝑏 𝑓𝑚 × 𝑖 Mdn.= 18.5 + 54 2 −21 9 × 3 18.5 + 2 = 20.50 Mdn. = 20.50
  • 24.
  • 25.
    Merits of Median It is easy to understand and easy to calculate.  It is not at all affected by extreme values.  It can be calculated for distributions with open-end classes.  Median is the only average to be used while dealing with qualitative data .  Can be determined graphically.
  • 26.
    Demerits of theMedian In case of even number of observations median cannot be determined exactly. It is not based on all the observations. It is not capable of further mathematical treatment.
  • 27.
    Mode A score, whichappears maximum times in a series, is known as Mode. A score, which repeats itself maximum times in series is called Mode. Mode is the perhaps the easiest measure of the Central Tendency.
  • 28.
    Find out theMode of the following series . 5, 10, 10, 4, 10, 5, 3, 10 In this series the score, which appears most of the times is ‘10’. Its frequency is 4, which is highest in the series, and therefore, ’10’ is the Mode of the series.
  • 29.
    Computation of Modefor Frequency Distribution Formula Mode = 3Mdn. – 2Mean
  • 30.
    CI f dfd 80-86 2 3 6 73-79 8 2 16 66-72 11 1 11/ 33 59-65 15 0 0 52-58 12 -1 -12 45-51 7 -2 -14 38-44 5 -3 -15/-41 N=60 Ʃ𝑓𝑑 = -8 𝑀 = 𝐴𝑀 + ( Ʃ𝑓𝑑 𝑁 ) × i 𝑀 = 62 + ( −8 60 ) × 7 62+(-0.933) M= 61.067