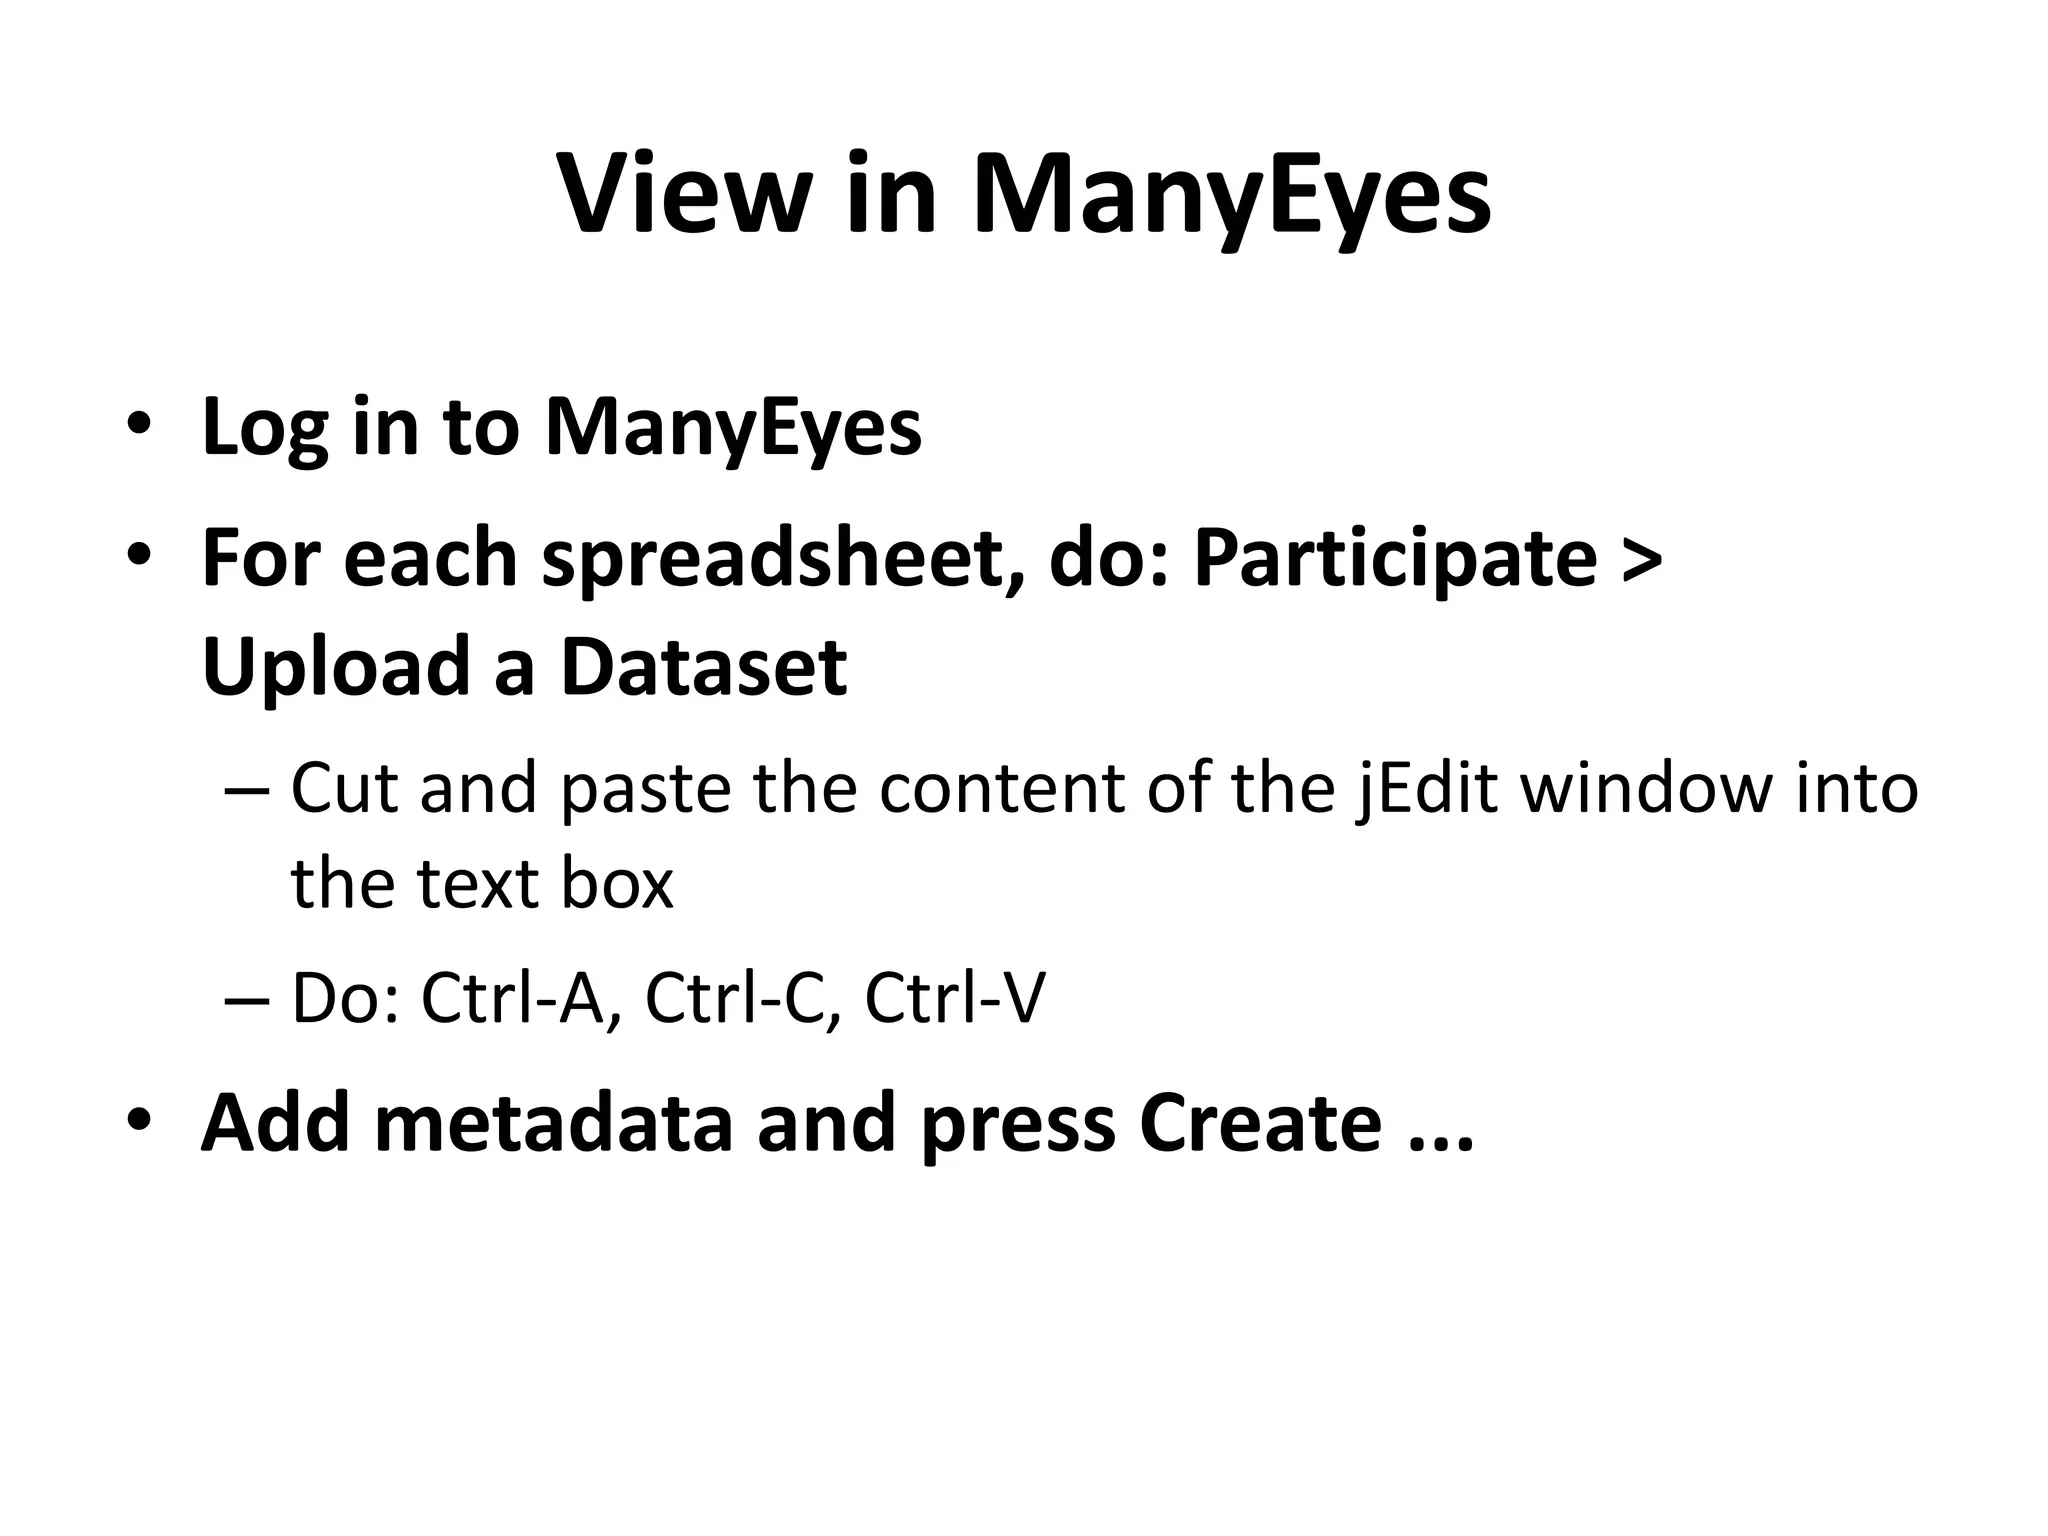
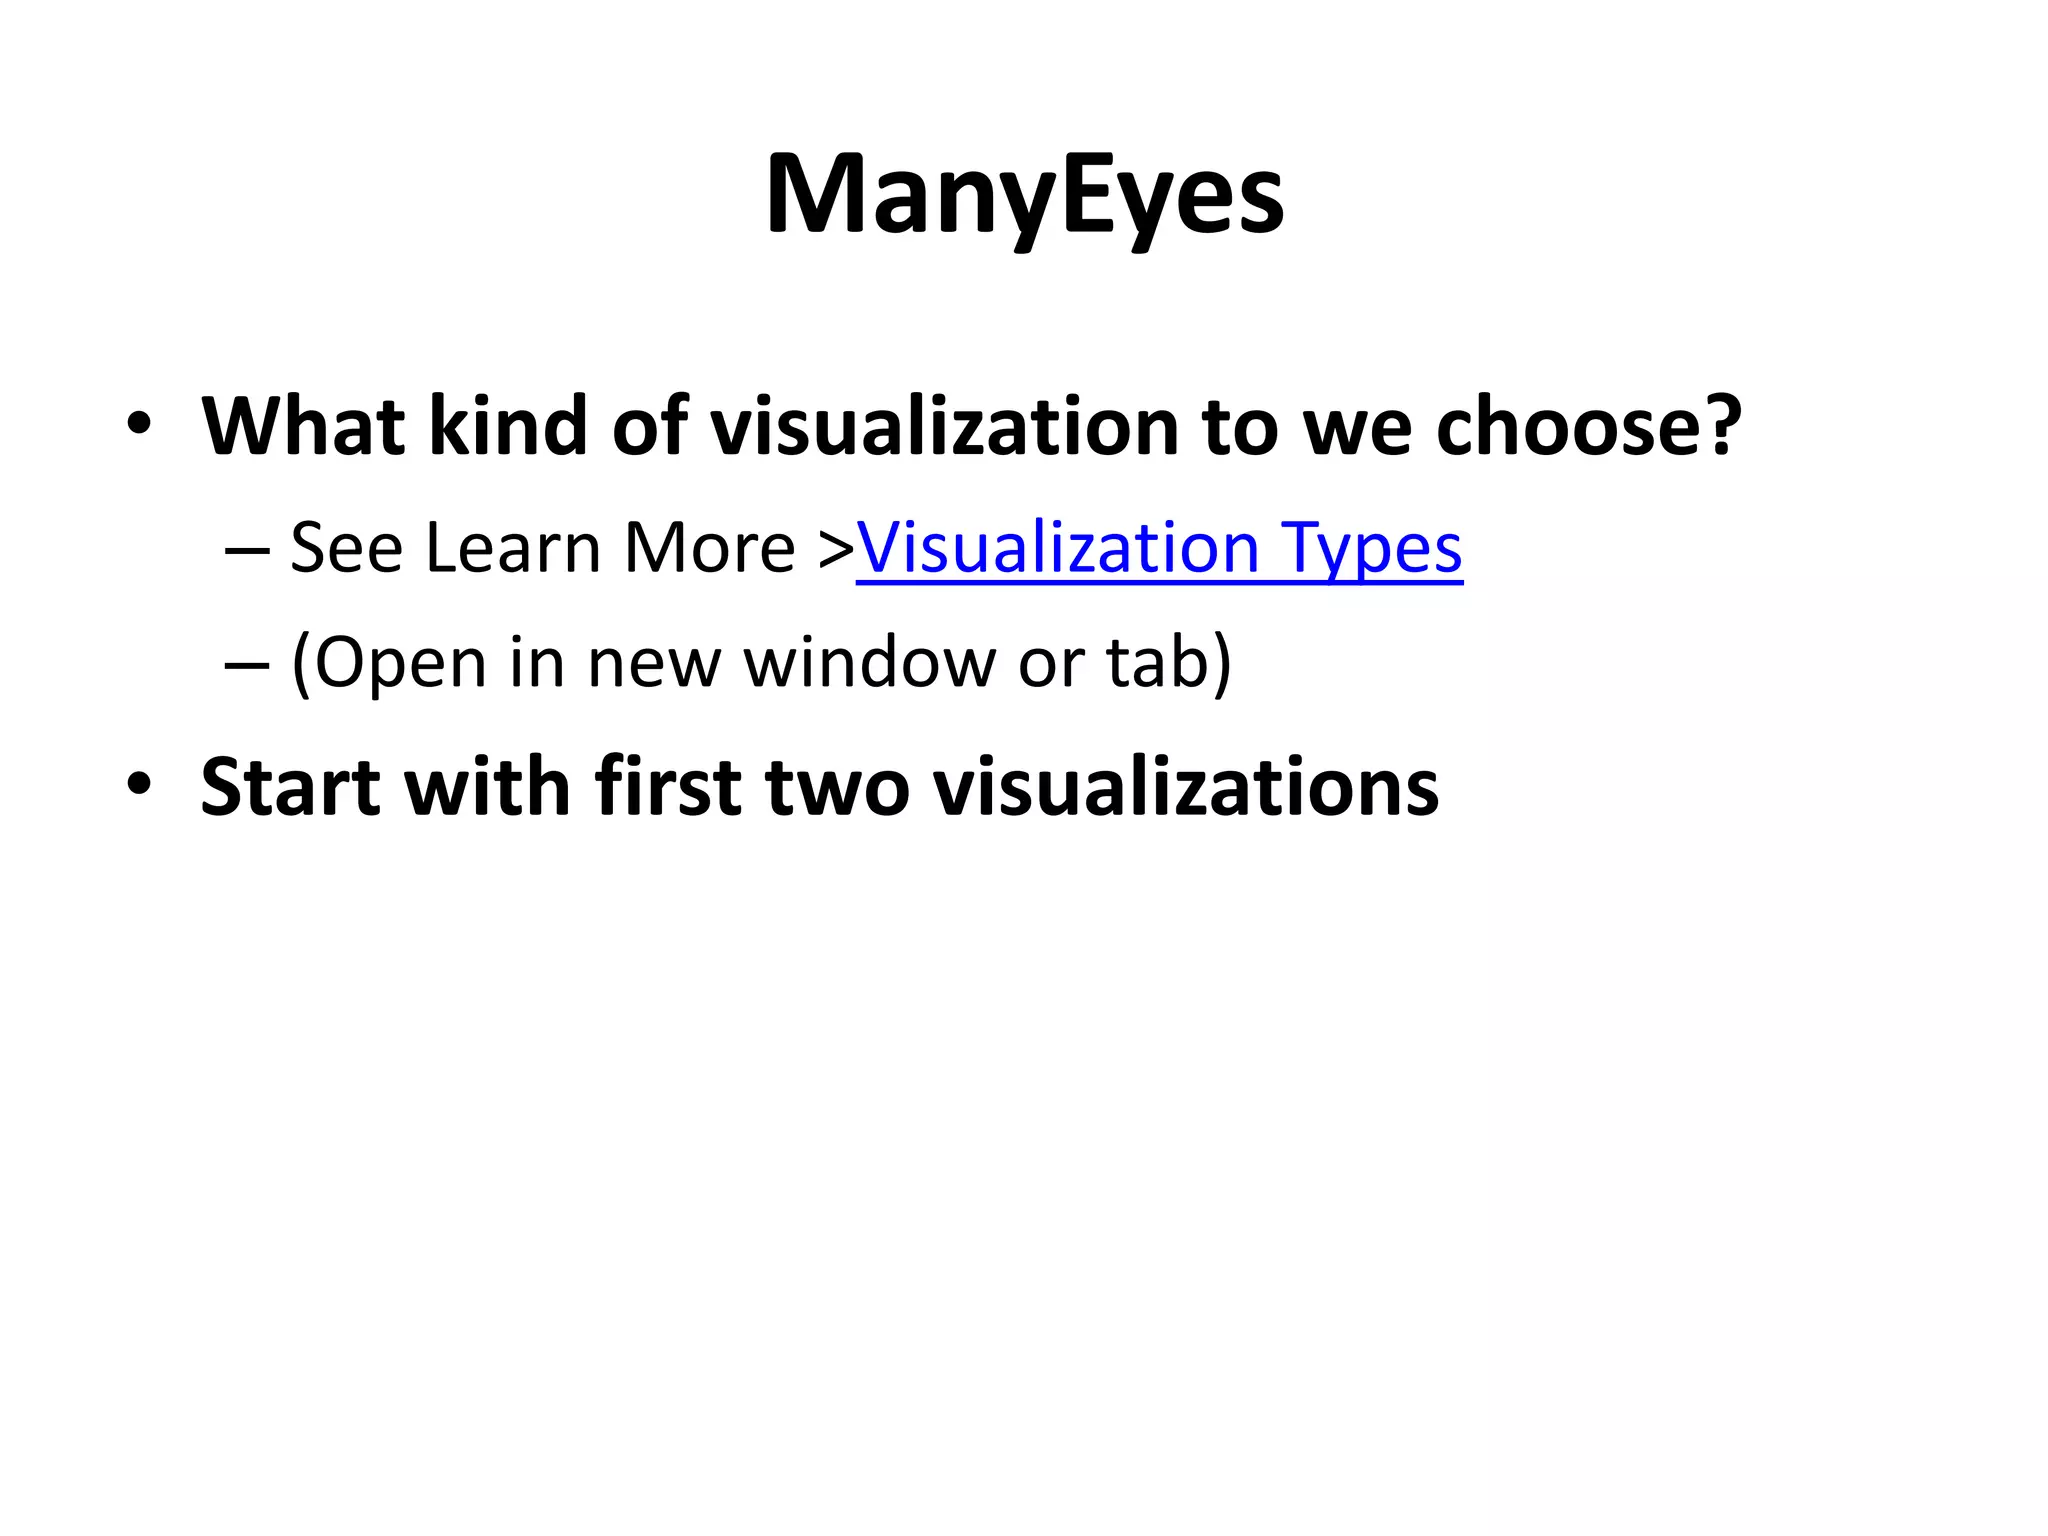
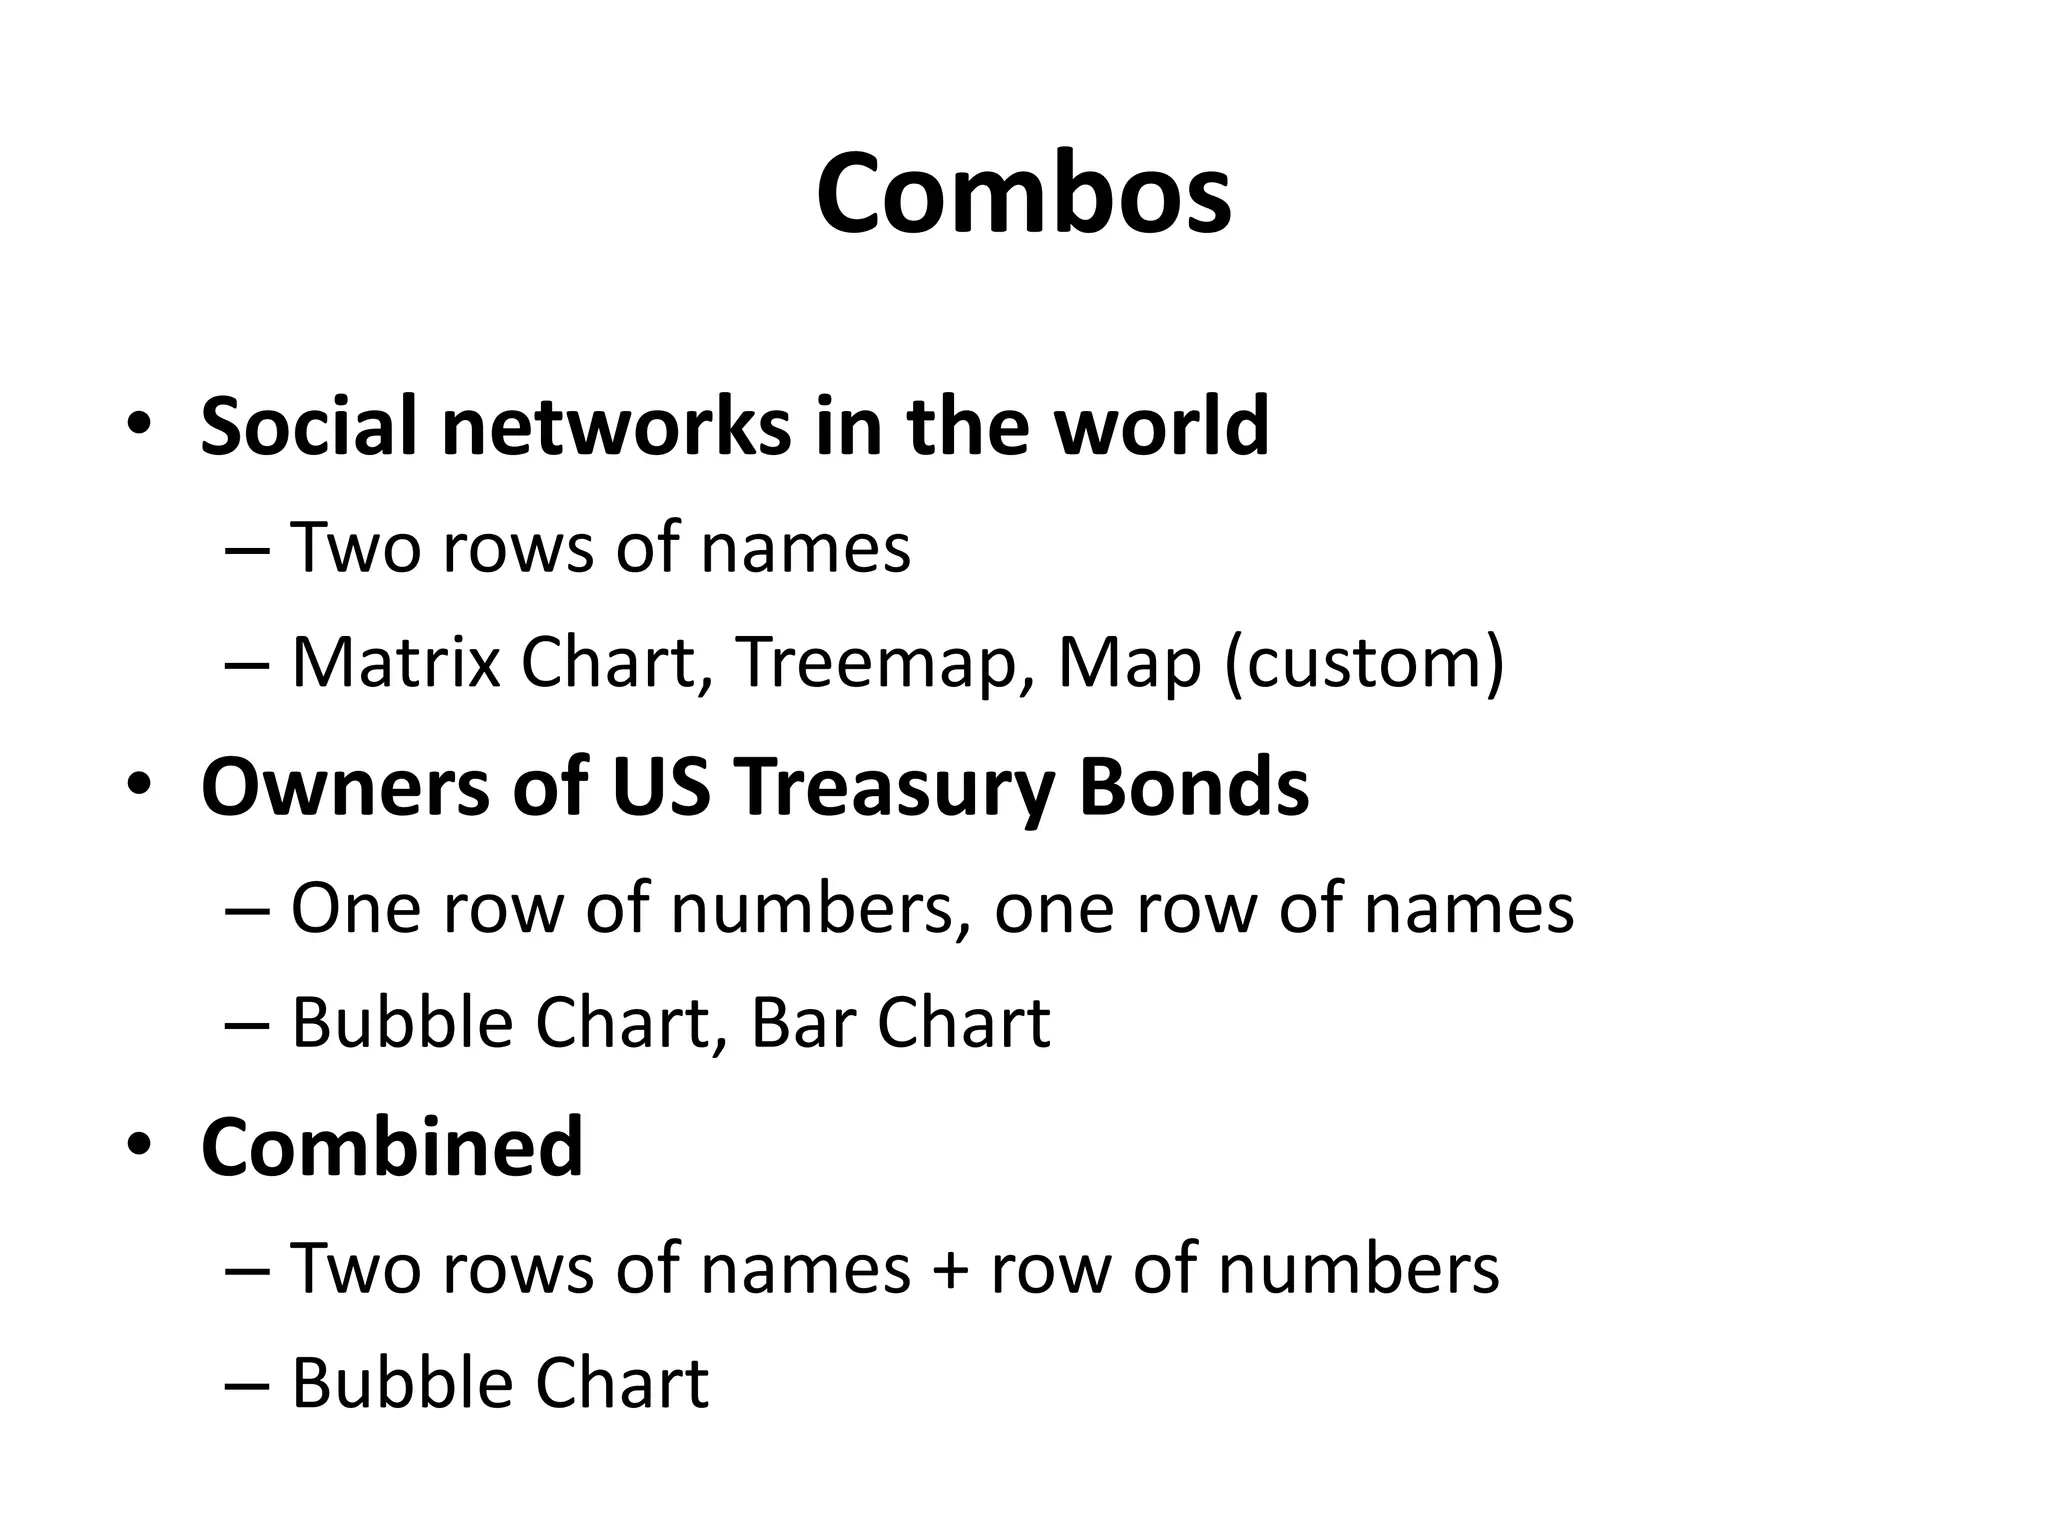
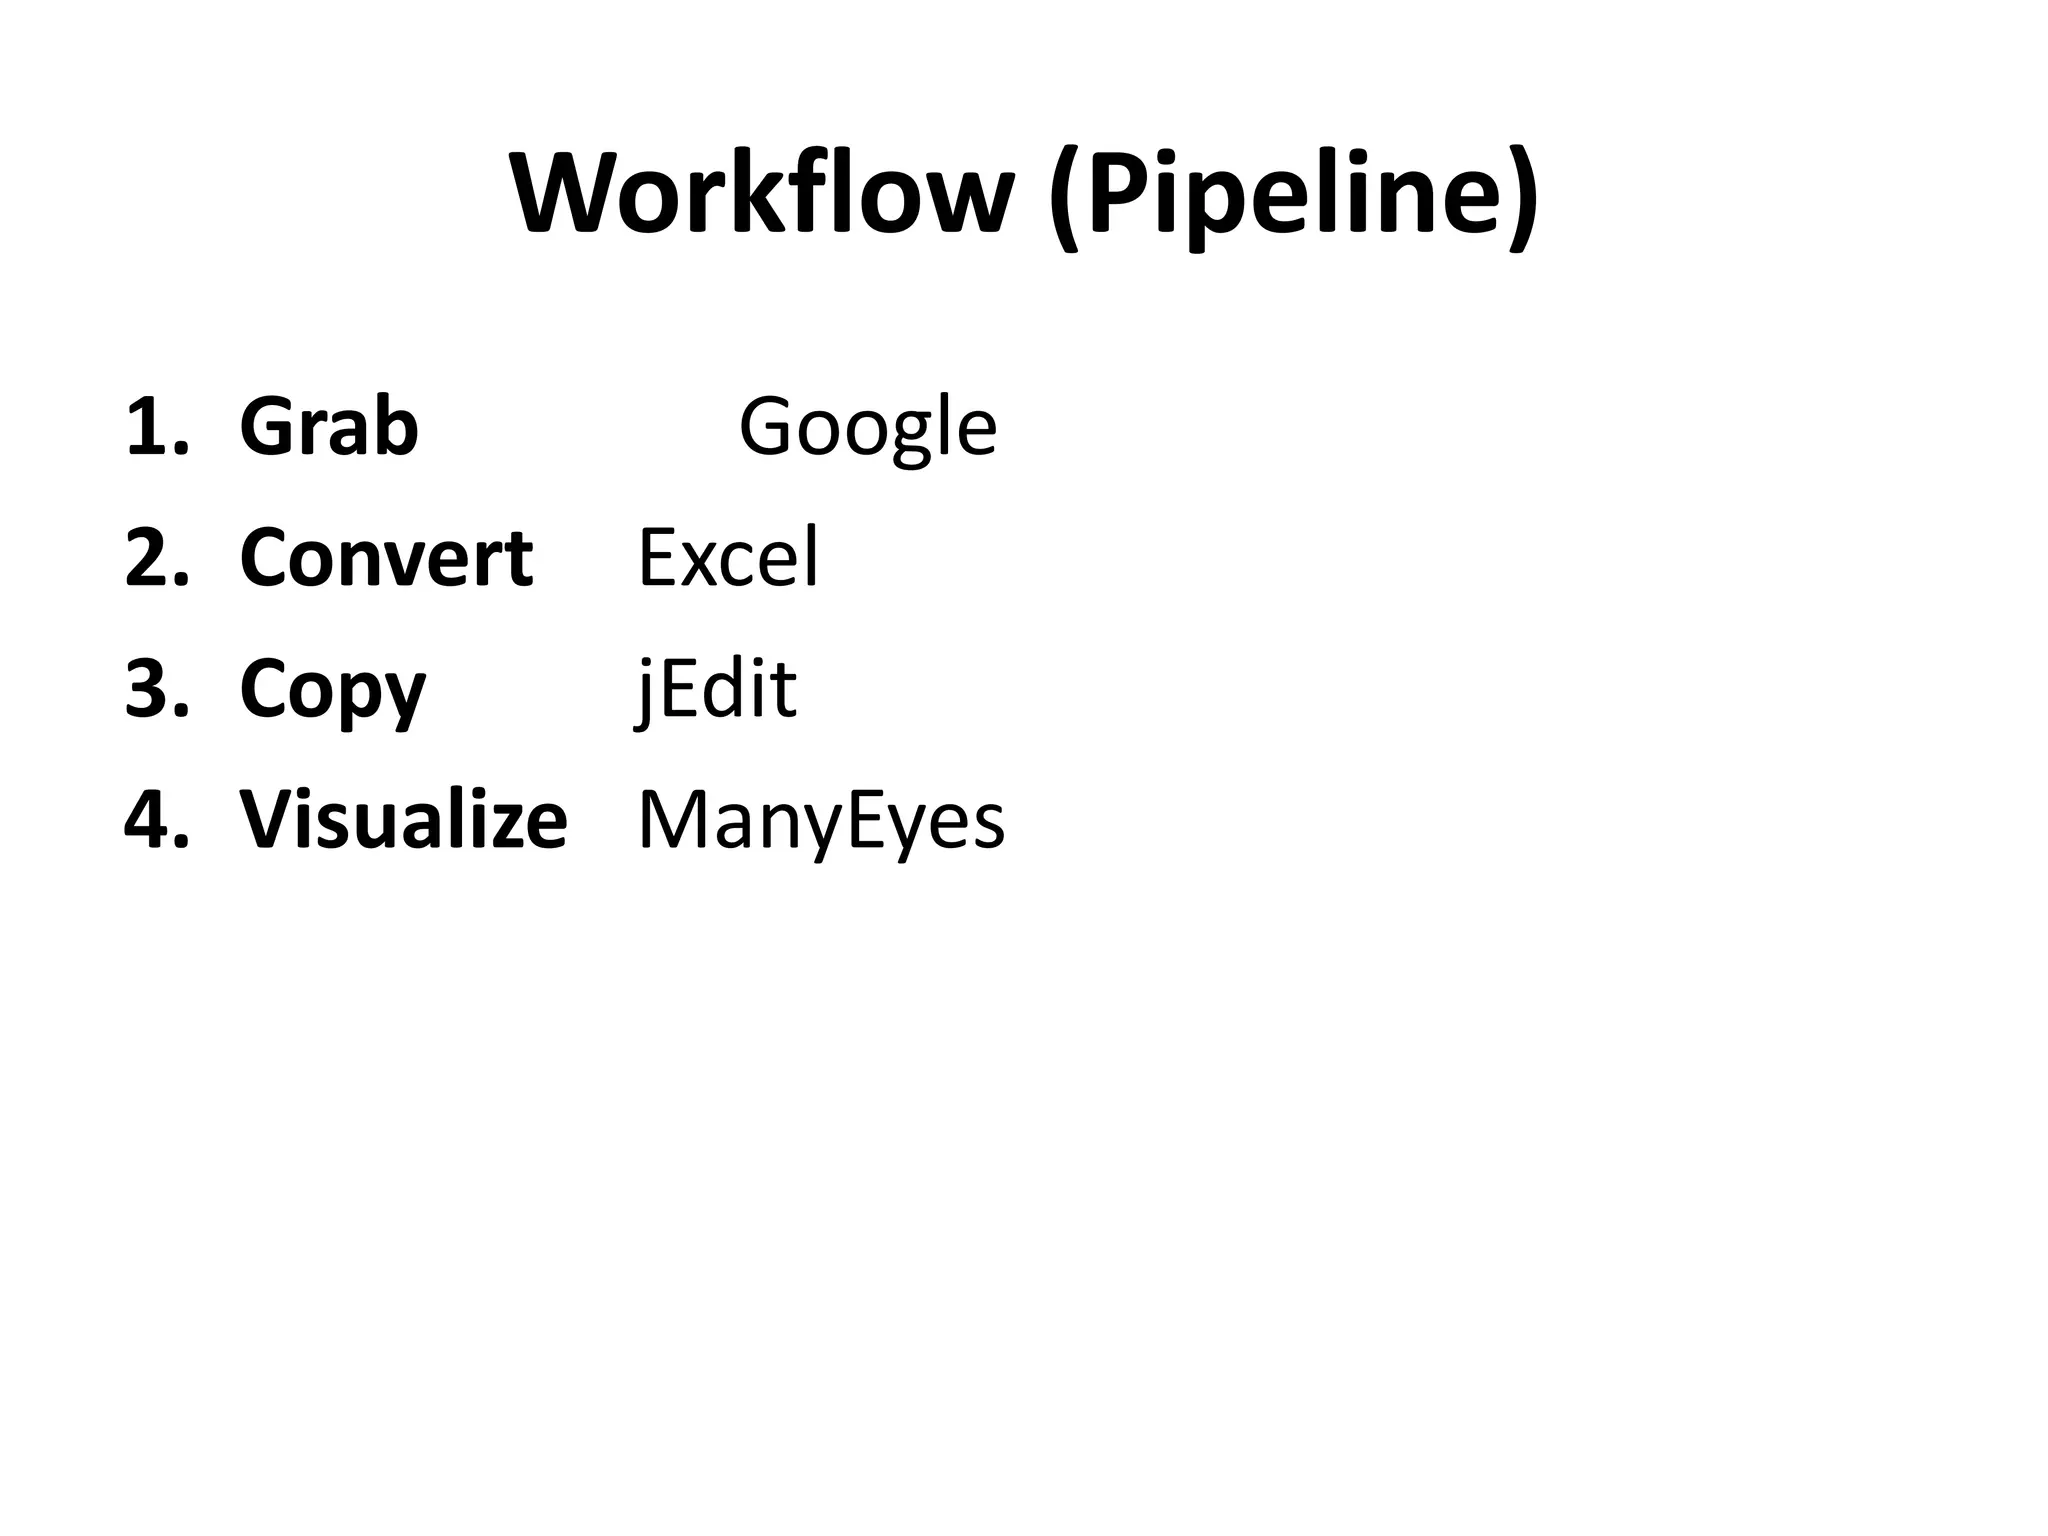
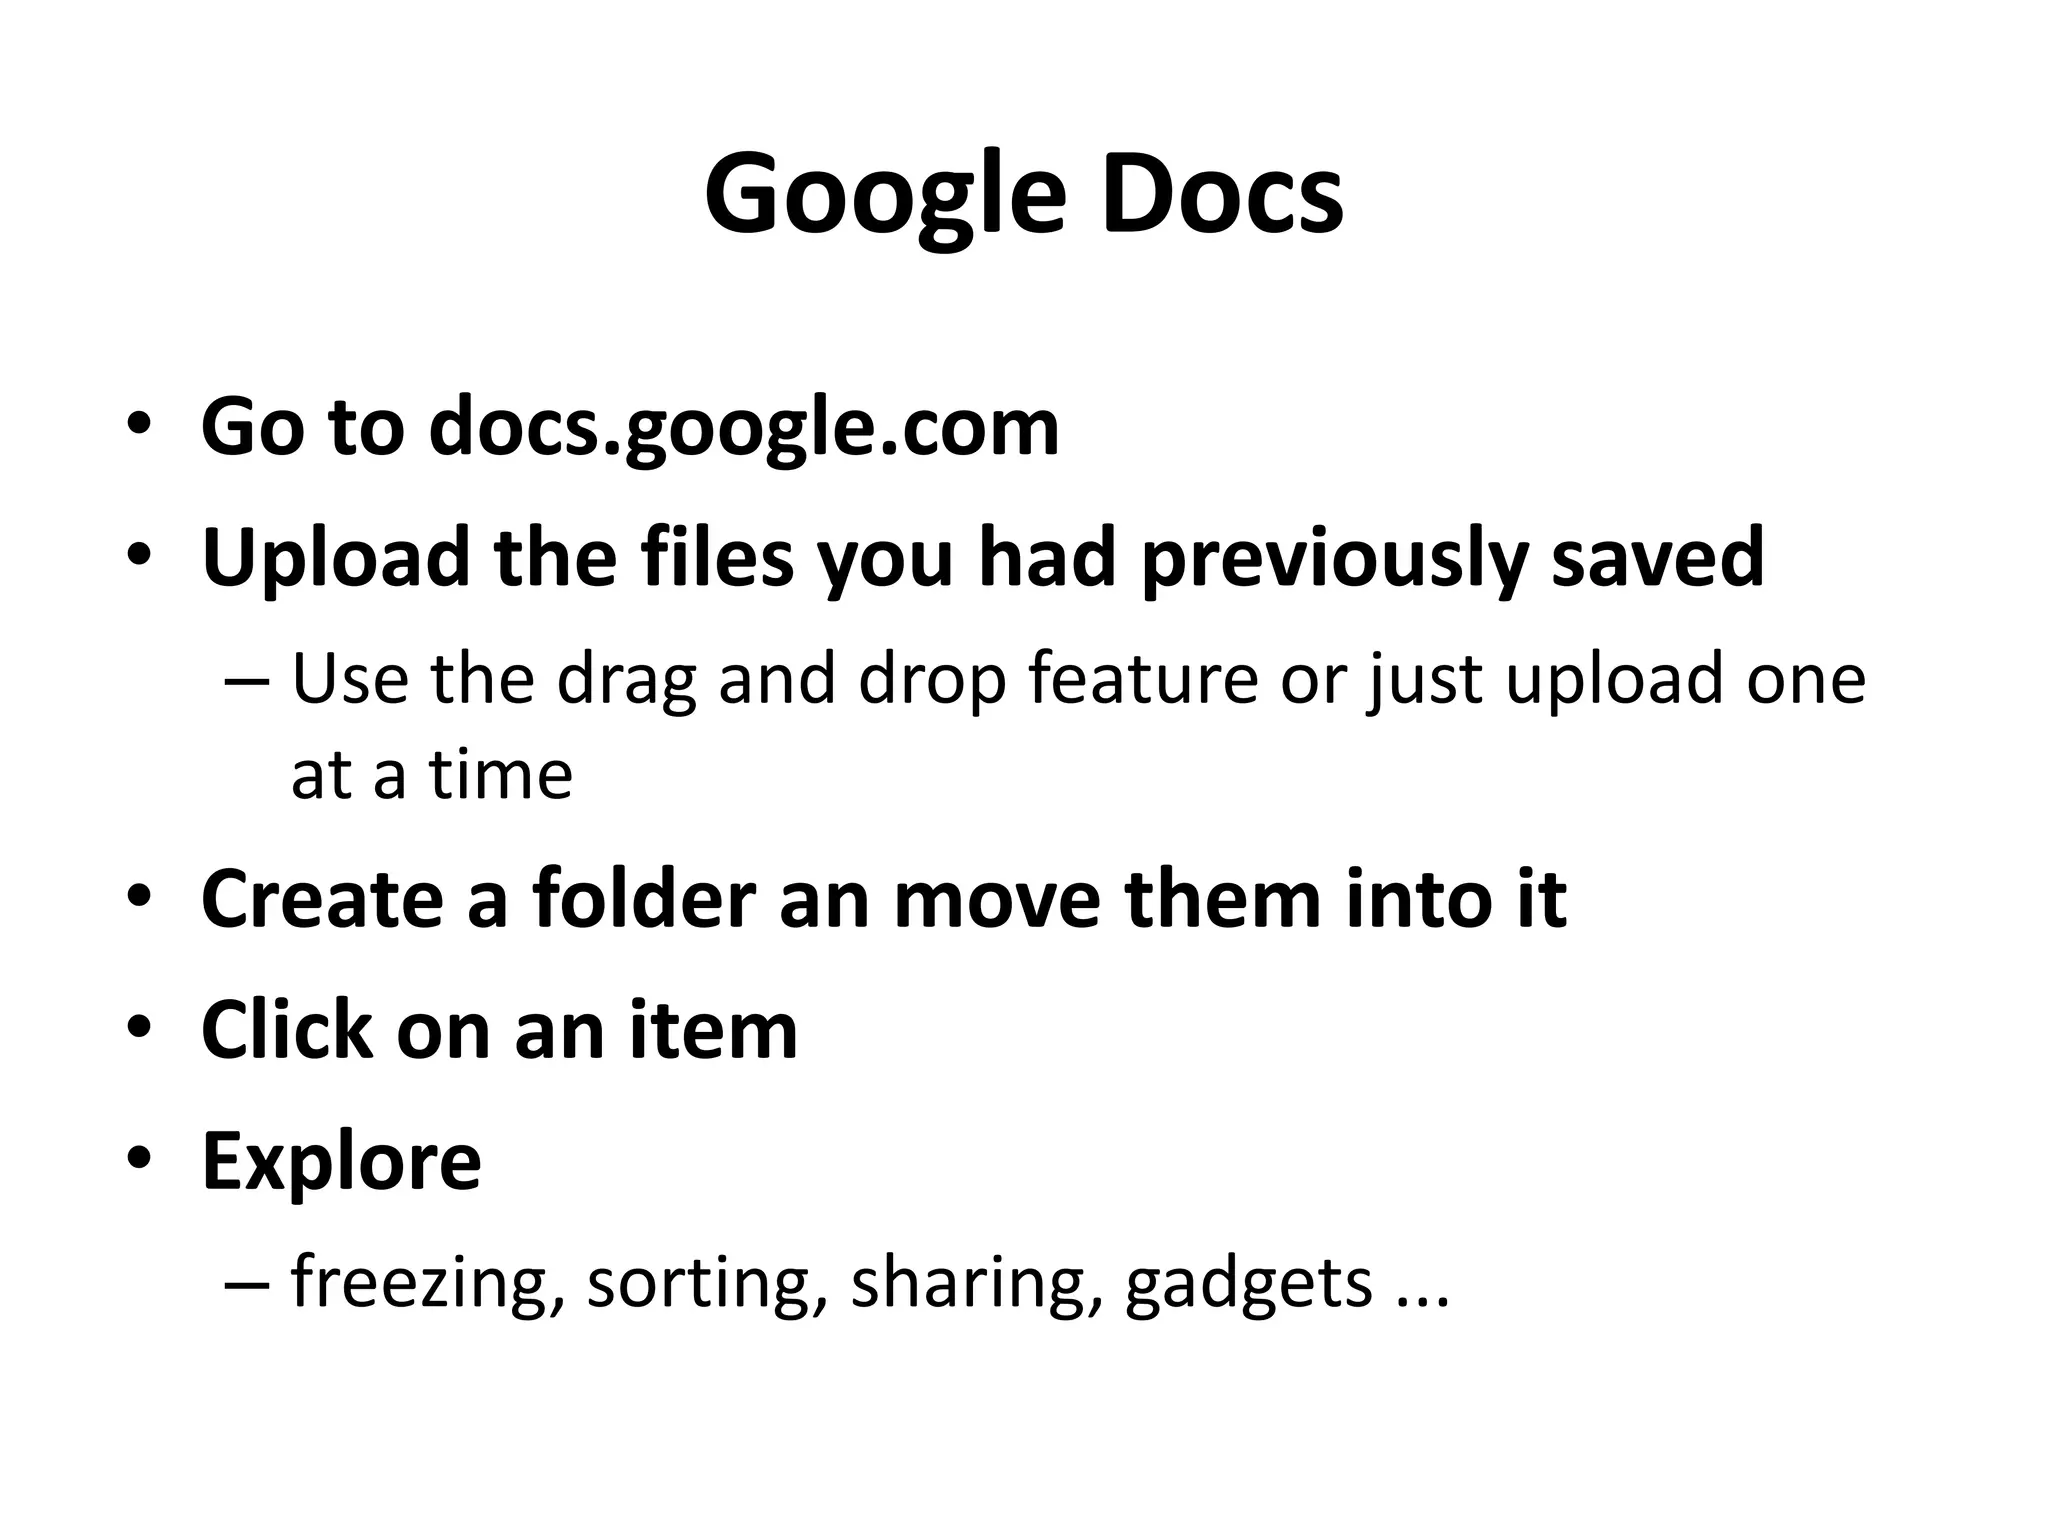
Data JournalismStudioMDST 3559:  DataestheticsProf. Alvarado1/27/2011
BusinessLate comersReadings still required for mid-term
Review:Features of Data JournalismDepends on emergence of the datasphereTransparency (Politics 2.0)All data leaks... and freely available tools for publishing and visualizing data (Web 2.0)Google Docs, Zoho, FactualManyEyesData converted into a common formatCSV = “comma separated vales” = tabular data in a text file
Features of Data Journalism (ii)Stories directly reference the data they usee.g. via embedded links to Google DocsDefinition of story changes ...Visualizations can be stories in themselvesThe act of data curation itself considered a journalistic actJournalism, as the Fifth Estate, still mediates between power and people, but in new waysA new relationship of power is opened up
TBL says the future of journalism scholarship "lies with journalists scholars who know their CSV from their RDF, can throw together some quick MySQL queries for a PHP or Python output … and discover the story lurking in datasets released by governments, local authorities, agencies, [libraries, museums] or any combination of them – even across national borders."  http://www.guardian.co.uk/media/2010/nov/22/data-analysis-tim-berners-lee
Examples	Data sourceData structure and contentVisualizationStory/thesis
OverviewDownload a CSV file from GoogleFormat as tab separated file with ExcelOpen up with a text editorCut and paste into ManyEyesExplore ManyEyes visualizationUpload to GoogleExplore Google Docs
PreliminariesDownload jEditA powerful, open source, cross platform text editor for programmershttp://http://www.jedit.org/index.php?page=downloadGet an account on GoogleIf you do not have one, or if you want a new one for this classGet an account on ManyEyeshttp://www-958.ibm.com/software/data/cognos/manyeyes/
Grab Some DataGo to links on Dataesthetics siteClick on each linkShould send you to Google DocsFor each file, do: File > Download As > ExcelNote where you are saving your files
Convert the DataOpen each file up in ExcelDo: Save as > tab delimited textClose file (resave if necessary)Open file in jEditMake sure that ...Tabs are not converted to spacesFile is saved as a Windows or Unix fileThese options found in Utilities > Buffer Options
View in ManyEyesLog in to ManyEyesFor each spreadsheet, do: Participate > Upload a DatasetCut and paste the content of the jEdit window into the text boxDo: Ctrl-A, Ctrl-C, Ctrl-V Add metadata and press Create ...
ManyEyesWhat kind of visualization to we choose?See Learn More > Visualization Types(Open in new window or tab)Start with first two visualizations
Visualization TypesSee relationships among data pointsNetwork DiagramScatterplotMatrix ChartCompare a set of valuesBar ChartBlock HistogramBubble ChartTrack rises and falls over timeLine GraphStack GraphStack Graph for CategoriesSee the parts of a wholePie ChartTreemapTreemap for ComparisonsAnalyze a textWord TreeTag CloudWord Cloud GeneratorPhrase NetSee the worldMassachusetts MapWorld MapUS County MapNew Jersey Map http://www-958.ibm.com/software/data/cognos/manyeyes/page/Visualization_Options.html
CombosSocial networks in the worldTwo rows of namesMatrix Chart, Treemap, Map (custom)Owners of US Treasury Bonds One row of numbers, one row of namesBubble Chart, Bar ChartCombinedTwo rows of names + row of numbersBubble Chart

Mdst 3559-01-27-data-journalism-studio

  • 1.
    Data JournalismStudioMDST 3559: DataestheticsProf. Alvarado1/27/2011
  • 2.
  • 3.
    Review:Features of DataJournalismDepends on emergence of the datasphereTransparency (Politics 2.0)All data leaks... and freely available tools for publishing and visualizing data (Web 2.0)Google Docs, Zoho, FactualManyEyesData converted into a common formatCSV = “comma separated vales” = tabular data in a text file
  • 4.
    Features of DataJournalism (ii)Stories directly reference the data they usee.g. via embedded links to Google DocsDefinition of story changes ...Visualizations can be stories in themselvesThe act of data curation itself considered a journalistic actJournalism, as the Fifth Estate, still mediates between power and people, but in new waysA new relationship of power is opened up
  • 5.
    TBL says thefuture of journalism scholarship "lies with journalists scholars who know their CSV from their RDF, can throw together some quick MySQL queries for a PHP or Python output … and discover the story lurking in datasets released by governments, local authorities, agencies, [libraries, museums] or any combination of them – even across national borders."  http://www.guardian.co.uk/media/2010/nov/22/data-analysis-tim-berners-lee
  • 6.
    Examples Data sourceData structureand contentVisualizationStory/thesis
  • 7.
    OverviewDownload a CSVfile from GoogleFormat as tab separated file with ExcelOpen up with a text editorCut and paste into ManyEyesExplore ManyEyes visualizationUpload to GoogleExplore Google Docs
  • 8.
    PreliminariesDownload jEditA powerful,open source, cross platform text editor for programmershttp://http://www.jedit.org/index.php?page=downloadGet an account on GoogleIf you do not have one, or if you want a new one for this classGet an account on ManyEyeshttp://www-958.ibm.com/software/data/cognos/manyeyes/
  • 9.
    Grab Some DataGoto links on Dataesthetics siteClick on each linkShould send you to Google DocsFor each file, do: File > Download As > ExcelNote where you are saving your files
  • 10.
    Convert the DataOpeneach file up in ExcelDo: Save as > tab delimited textClose file (resave if necessary)Open file in jEditMake sure that ...Tabs are not converted to spacesFile is saved as a Windows or Unix fileThese options found in Utilities > Buffer Options
  • 11.
    View in ManyEyesLogin to ManyEyesFor each spreadsheet, do: Participate > Upload a DatasetCut and paste the content of the jEdit window into the text boxDo: Ctrl-A, Ctrl-C, Ctrl-V Add metadata and press Create ...
  • 12.
    ManyEyesWhat kind ofvisualization to we choose?See Learn More > Visualization Types(Open in new window or tab)Start with first two visualizations
  • 13.
    Visualization TypesSee relationshipsamong data pointsNetwork DiagramScatterplotMatrix ChartCompare a set of valuesBar ChartBlock HistogramBubble ChartTrack rises and falls over timeLine GraphStack GraphStack Graph for CategoriesSee the parts of a wholePie ChartTreemapTreemap for ComparisonsAnalyze a textWord TreeTag CloudWord Cloud GeneratorPhrase NetSee the worldMassachusetts MapWorld MapUS County MapNew Jersey Map http://www-958.ibm.com/software/data/cognos/manyeyes/page/Visualization_Options.html
  • 14.
    CombosSocial networks inthe worldTwo rows of namesMatrix Chart, Treemap, Map (custom)Owners of US Treasury Bonds One row of numbers, one row of namesBubble Chart, Bar ChartCombinedTwo rows of names + row of numbersBubble Chart
  • 15.
    Workflow (Pipeline)Grab GoogleConvert ExcelCopy jEditVisualize ManyEyes
  • 16.
    Google DocsGo todocs.google.comUpload the files you had previously savedUse the drag and drop feature or just upload one at a timeCreate a folder an move them into itClick on an itemExplorefreezing, sorting, sharing, gadgets ...

Editor's Notes

  • #14 See http://www-958.ibm.com/software/data/cognos/manyeyes/page/Visualization_Options.html