Download as PDF, PPTX
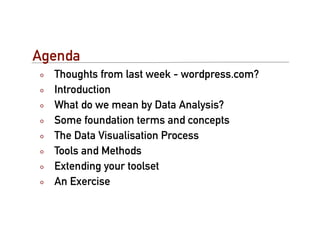
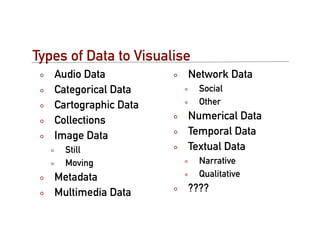
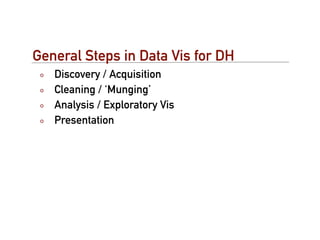

This document provides an introduction to data visualization for analysis. It discusses exploring datasets that can include textual, numerical, and other data. The document outlines the data visualization process and mentions some common tools and methods used. It also discusses extending your toolset and provides an example exercise exploring a dataset and creating a visualization to gain insights. The objective is to appreciate the variety of techniques available to digital humanities scholars for data analysis and visualization.


