Download to read offline
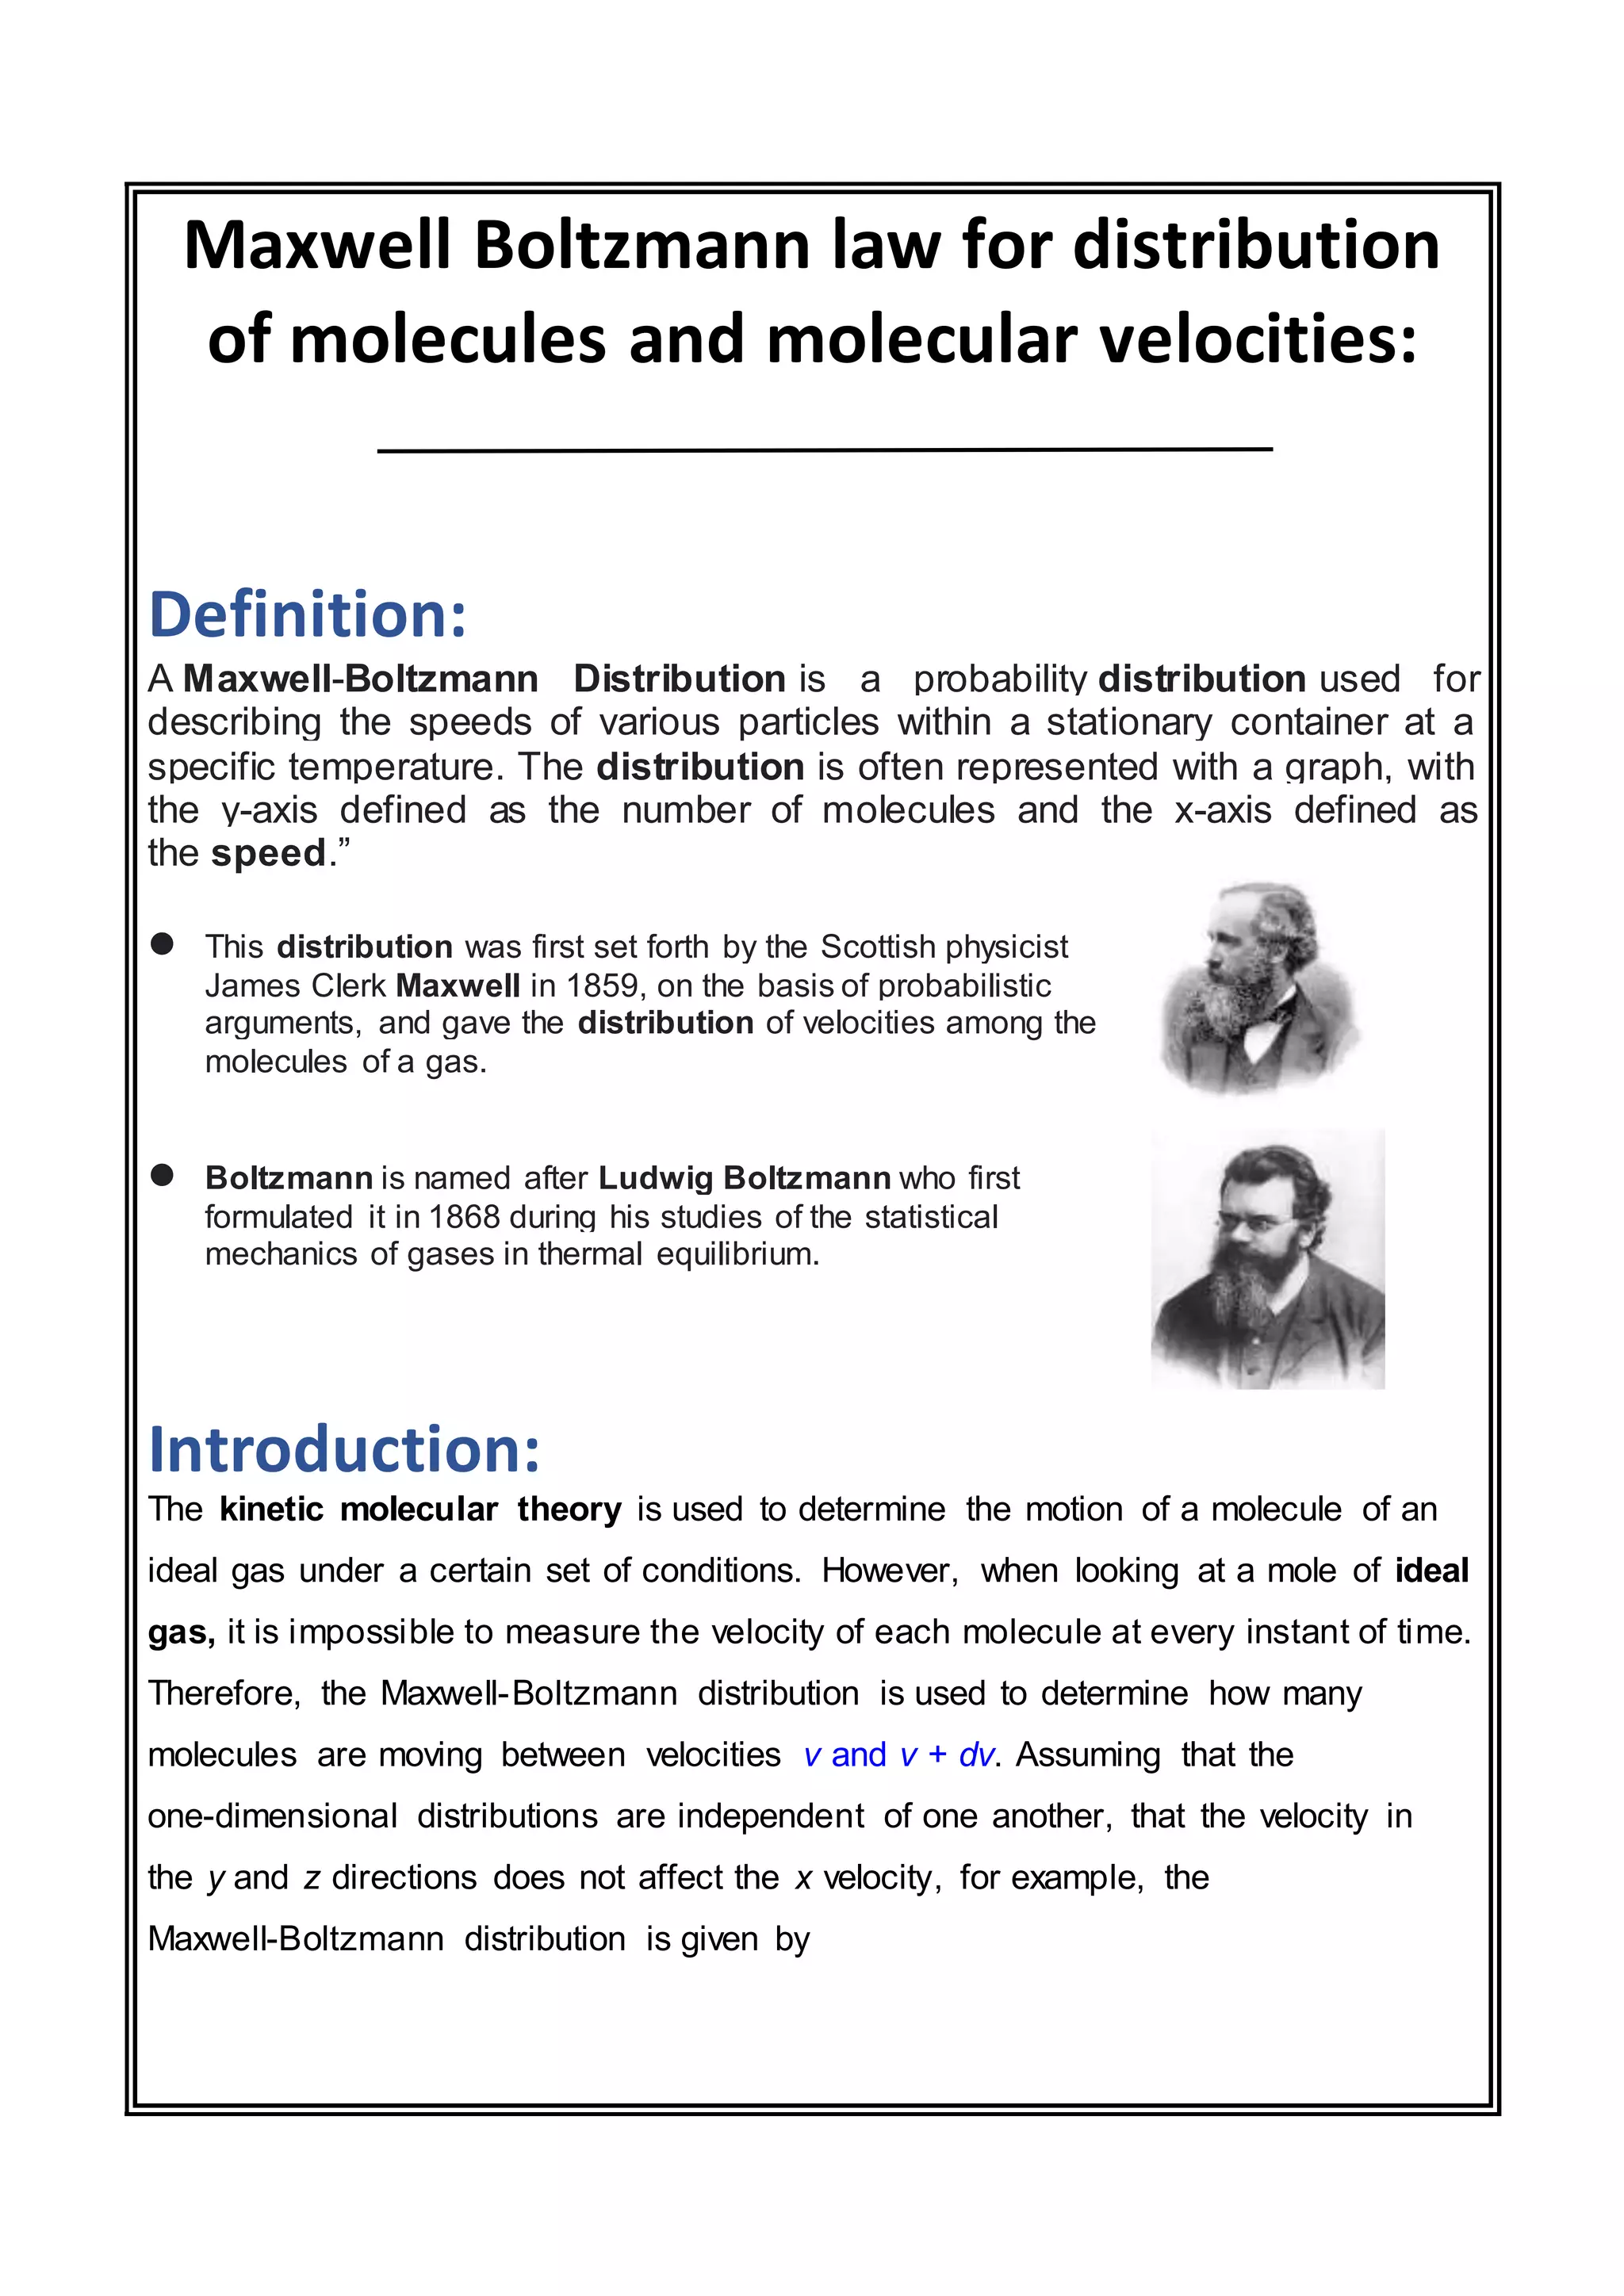
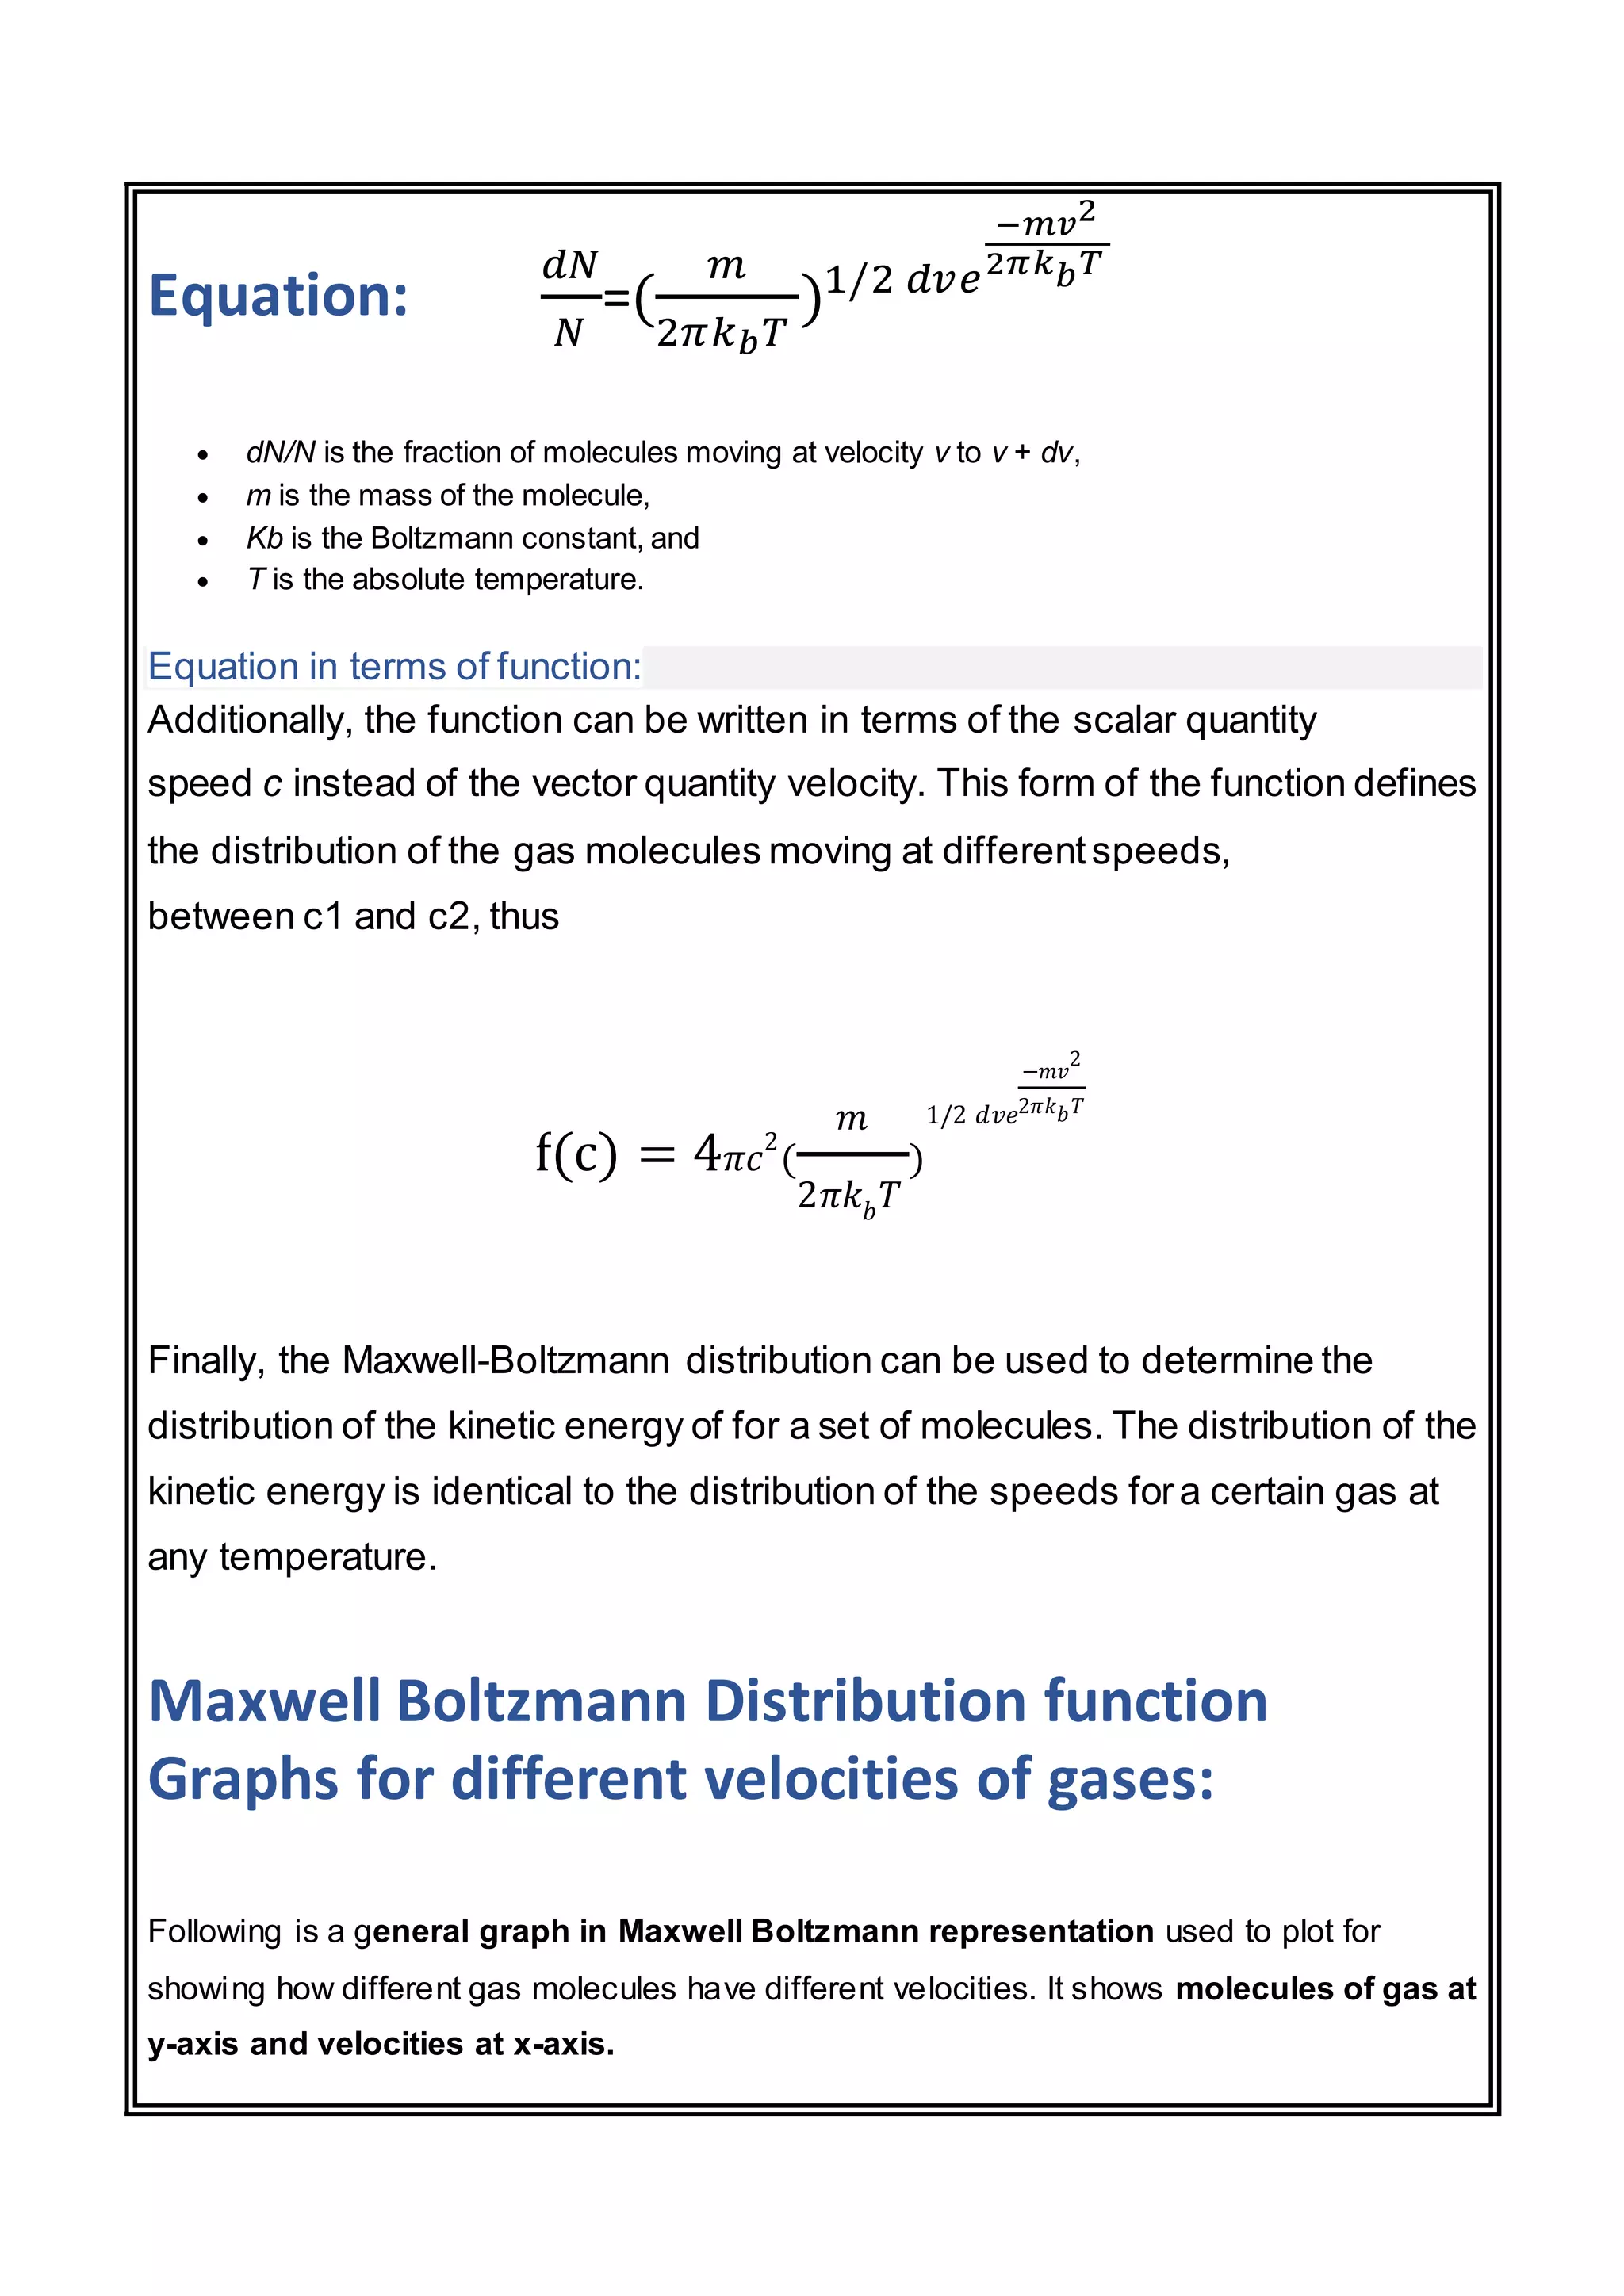
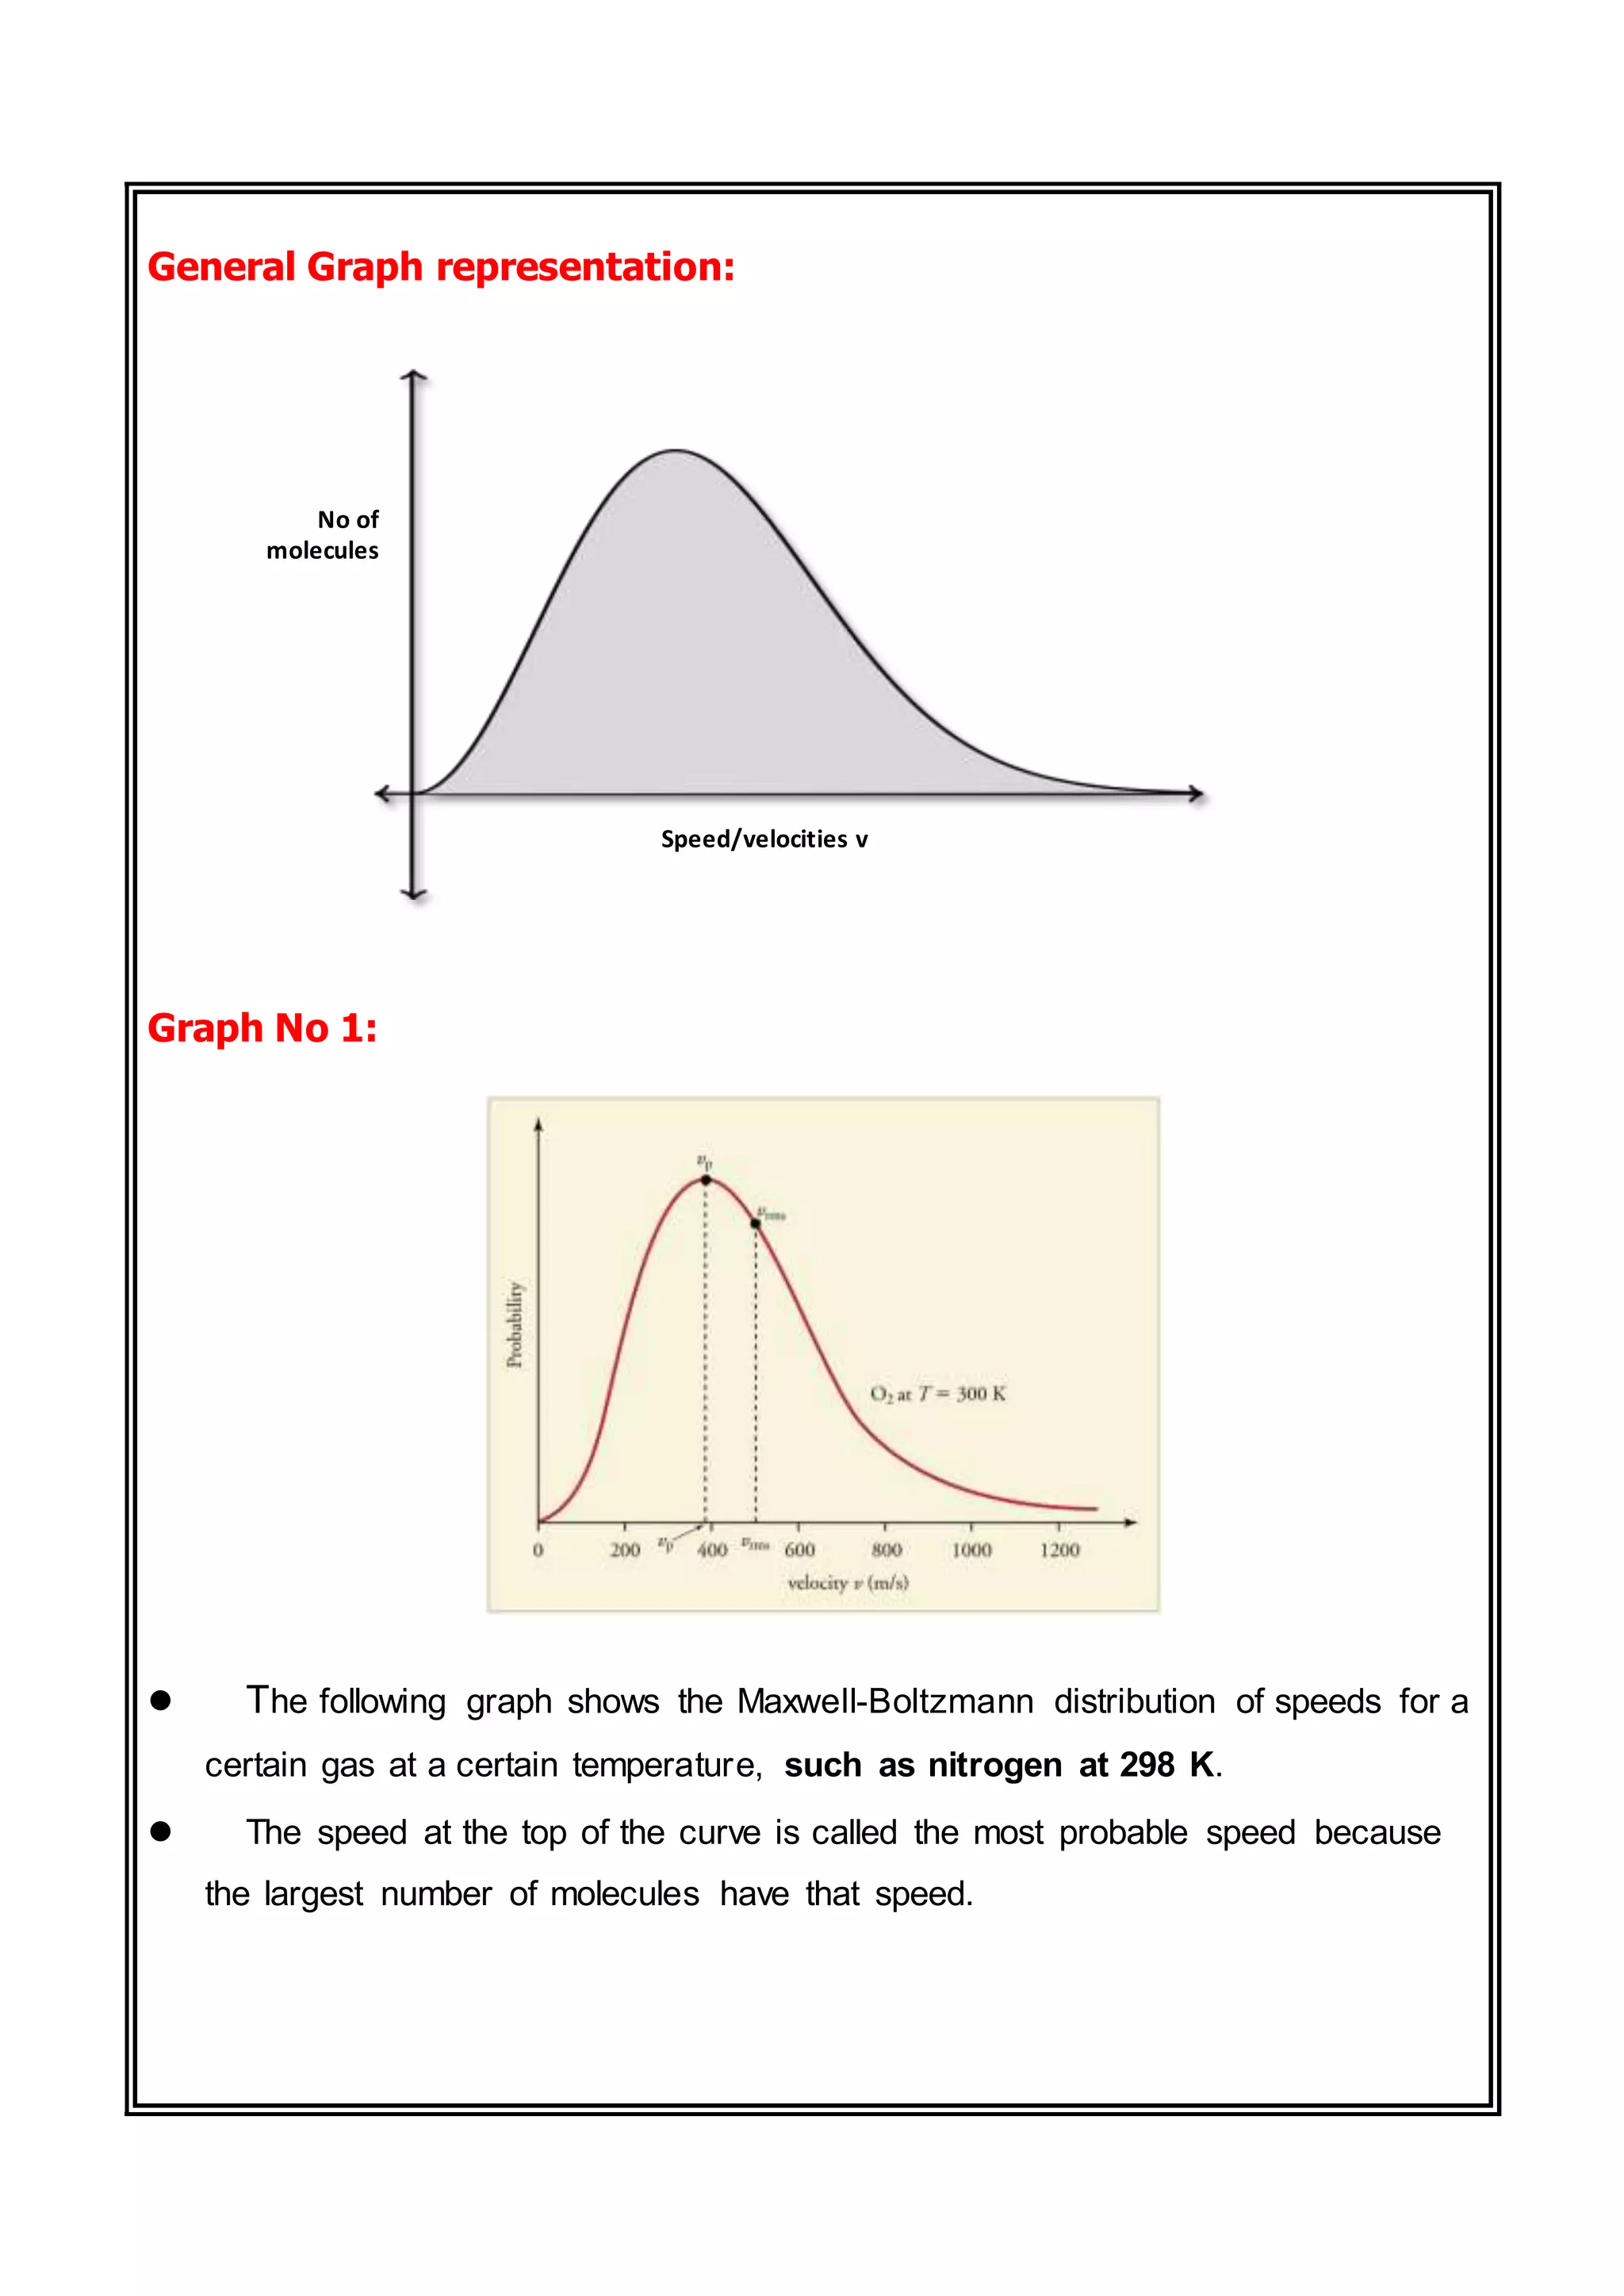
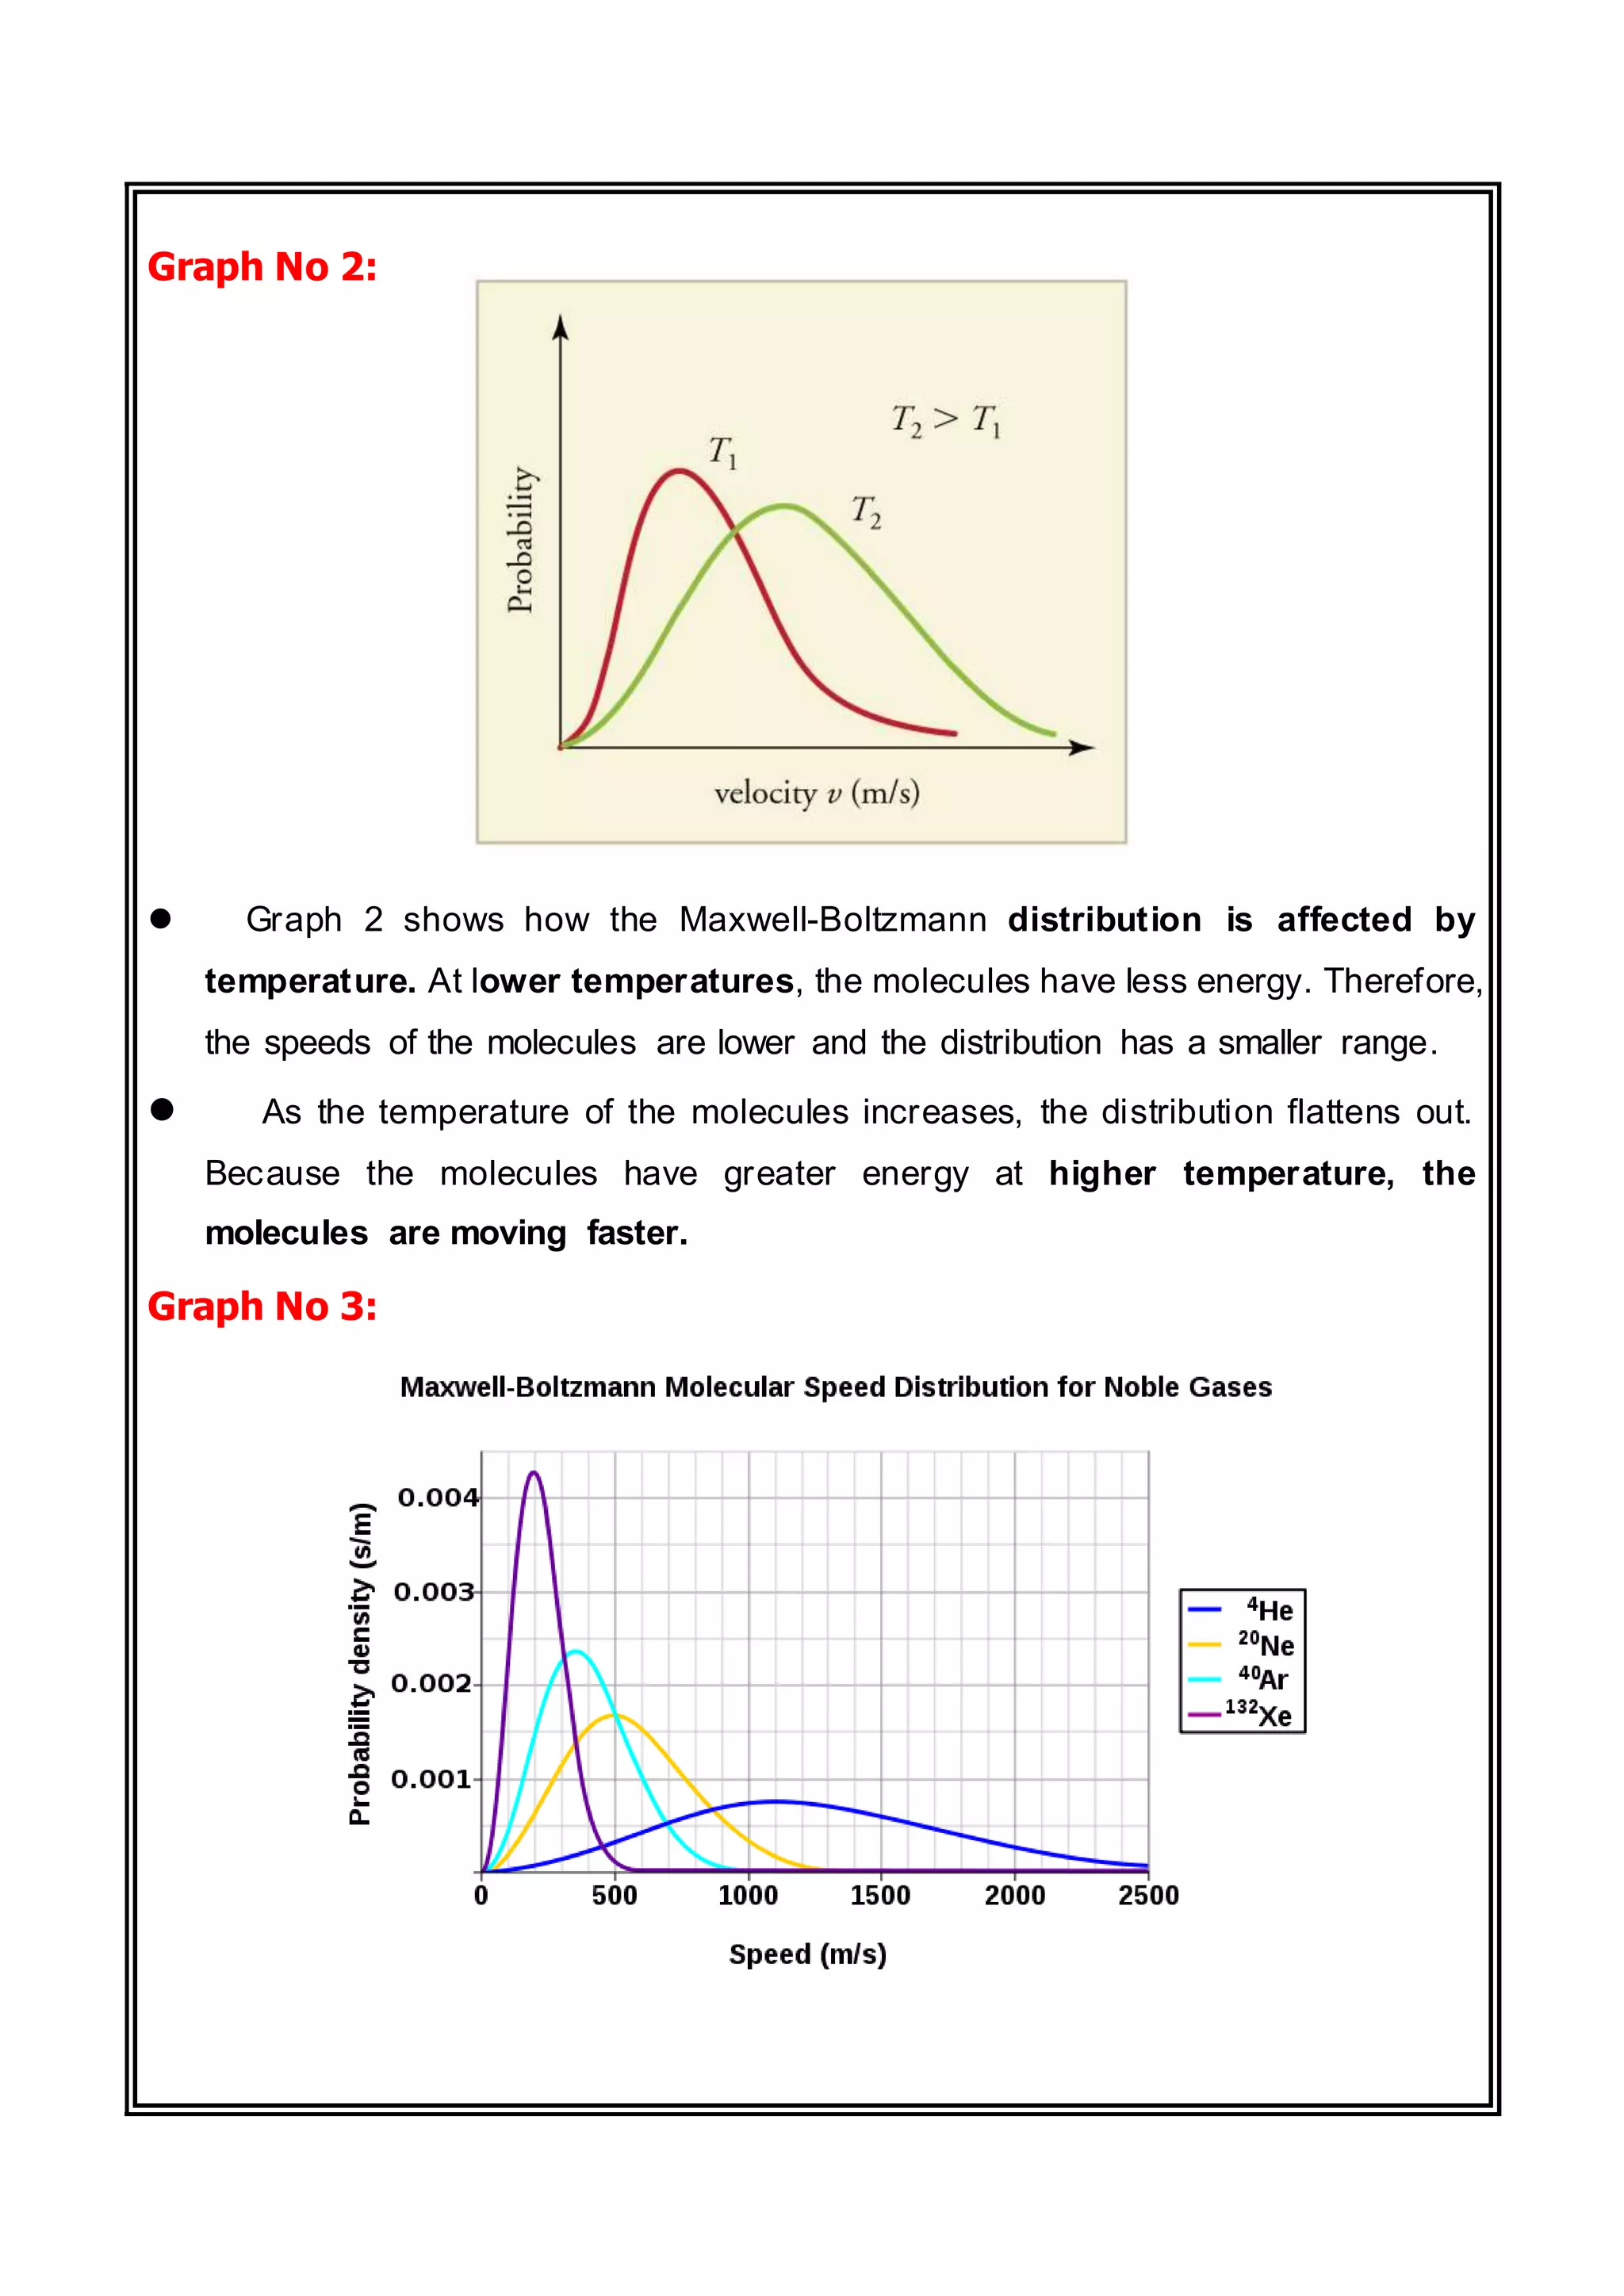
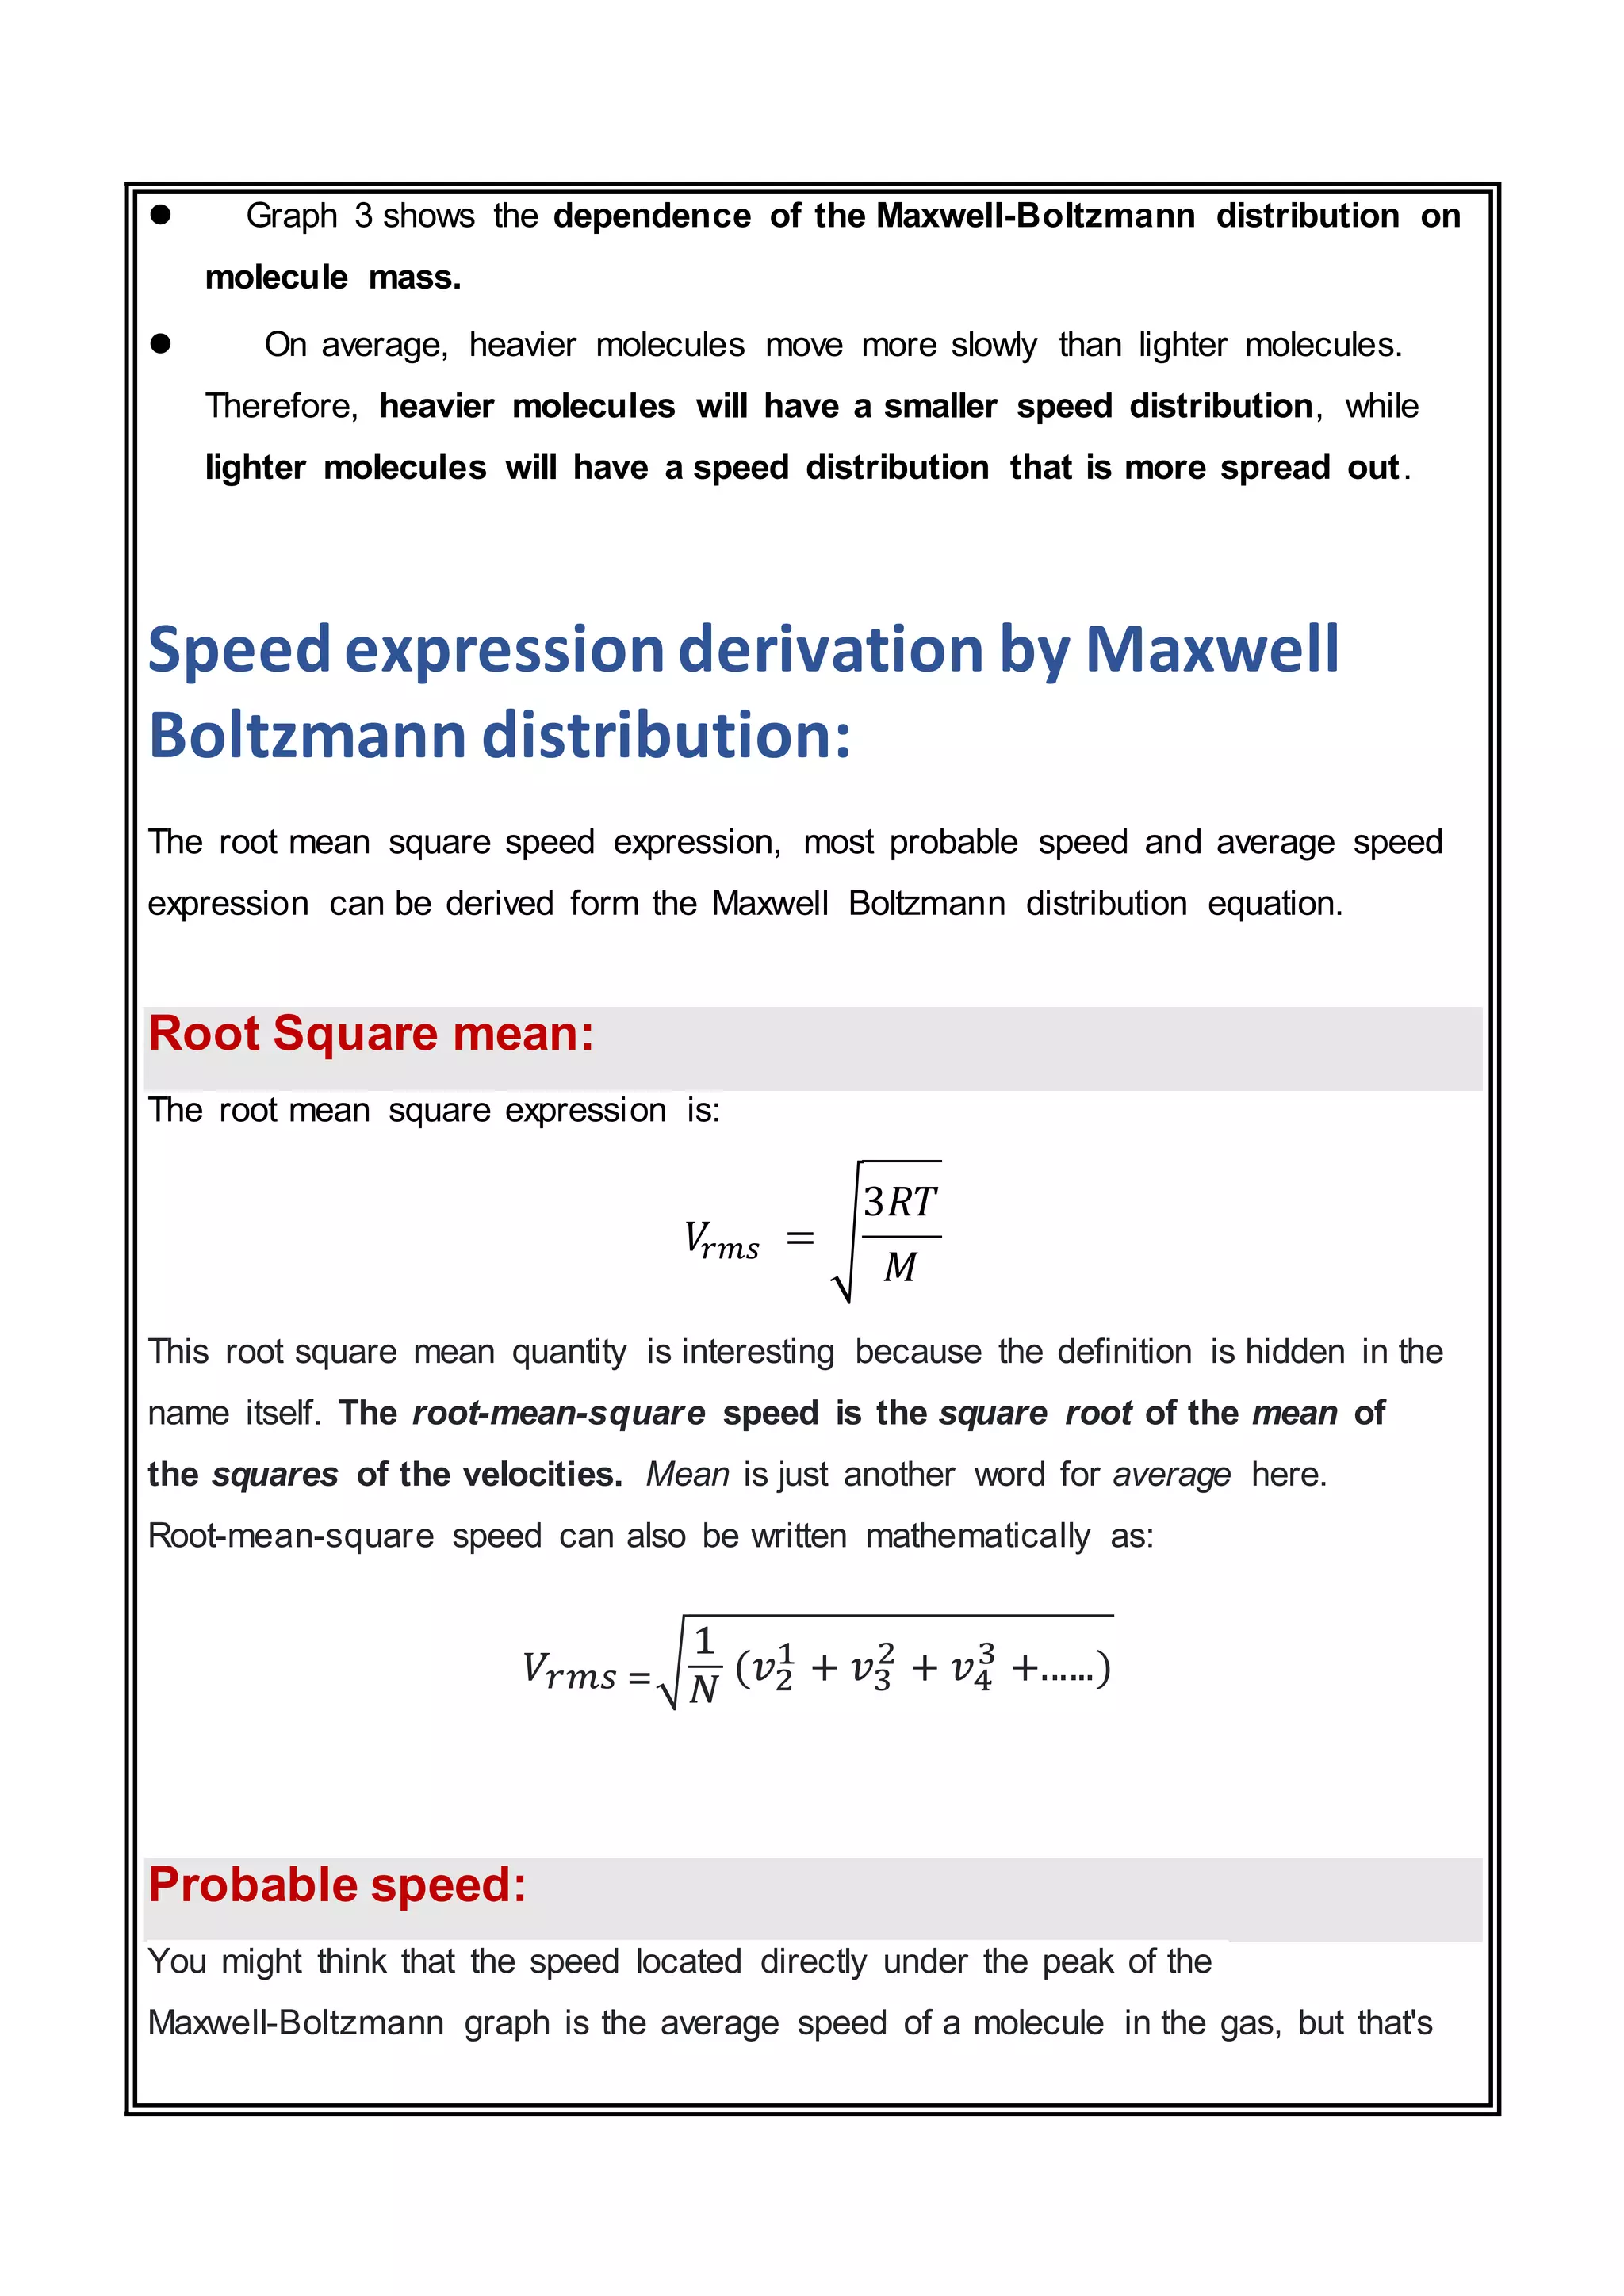
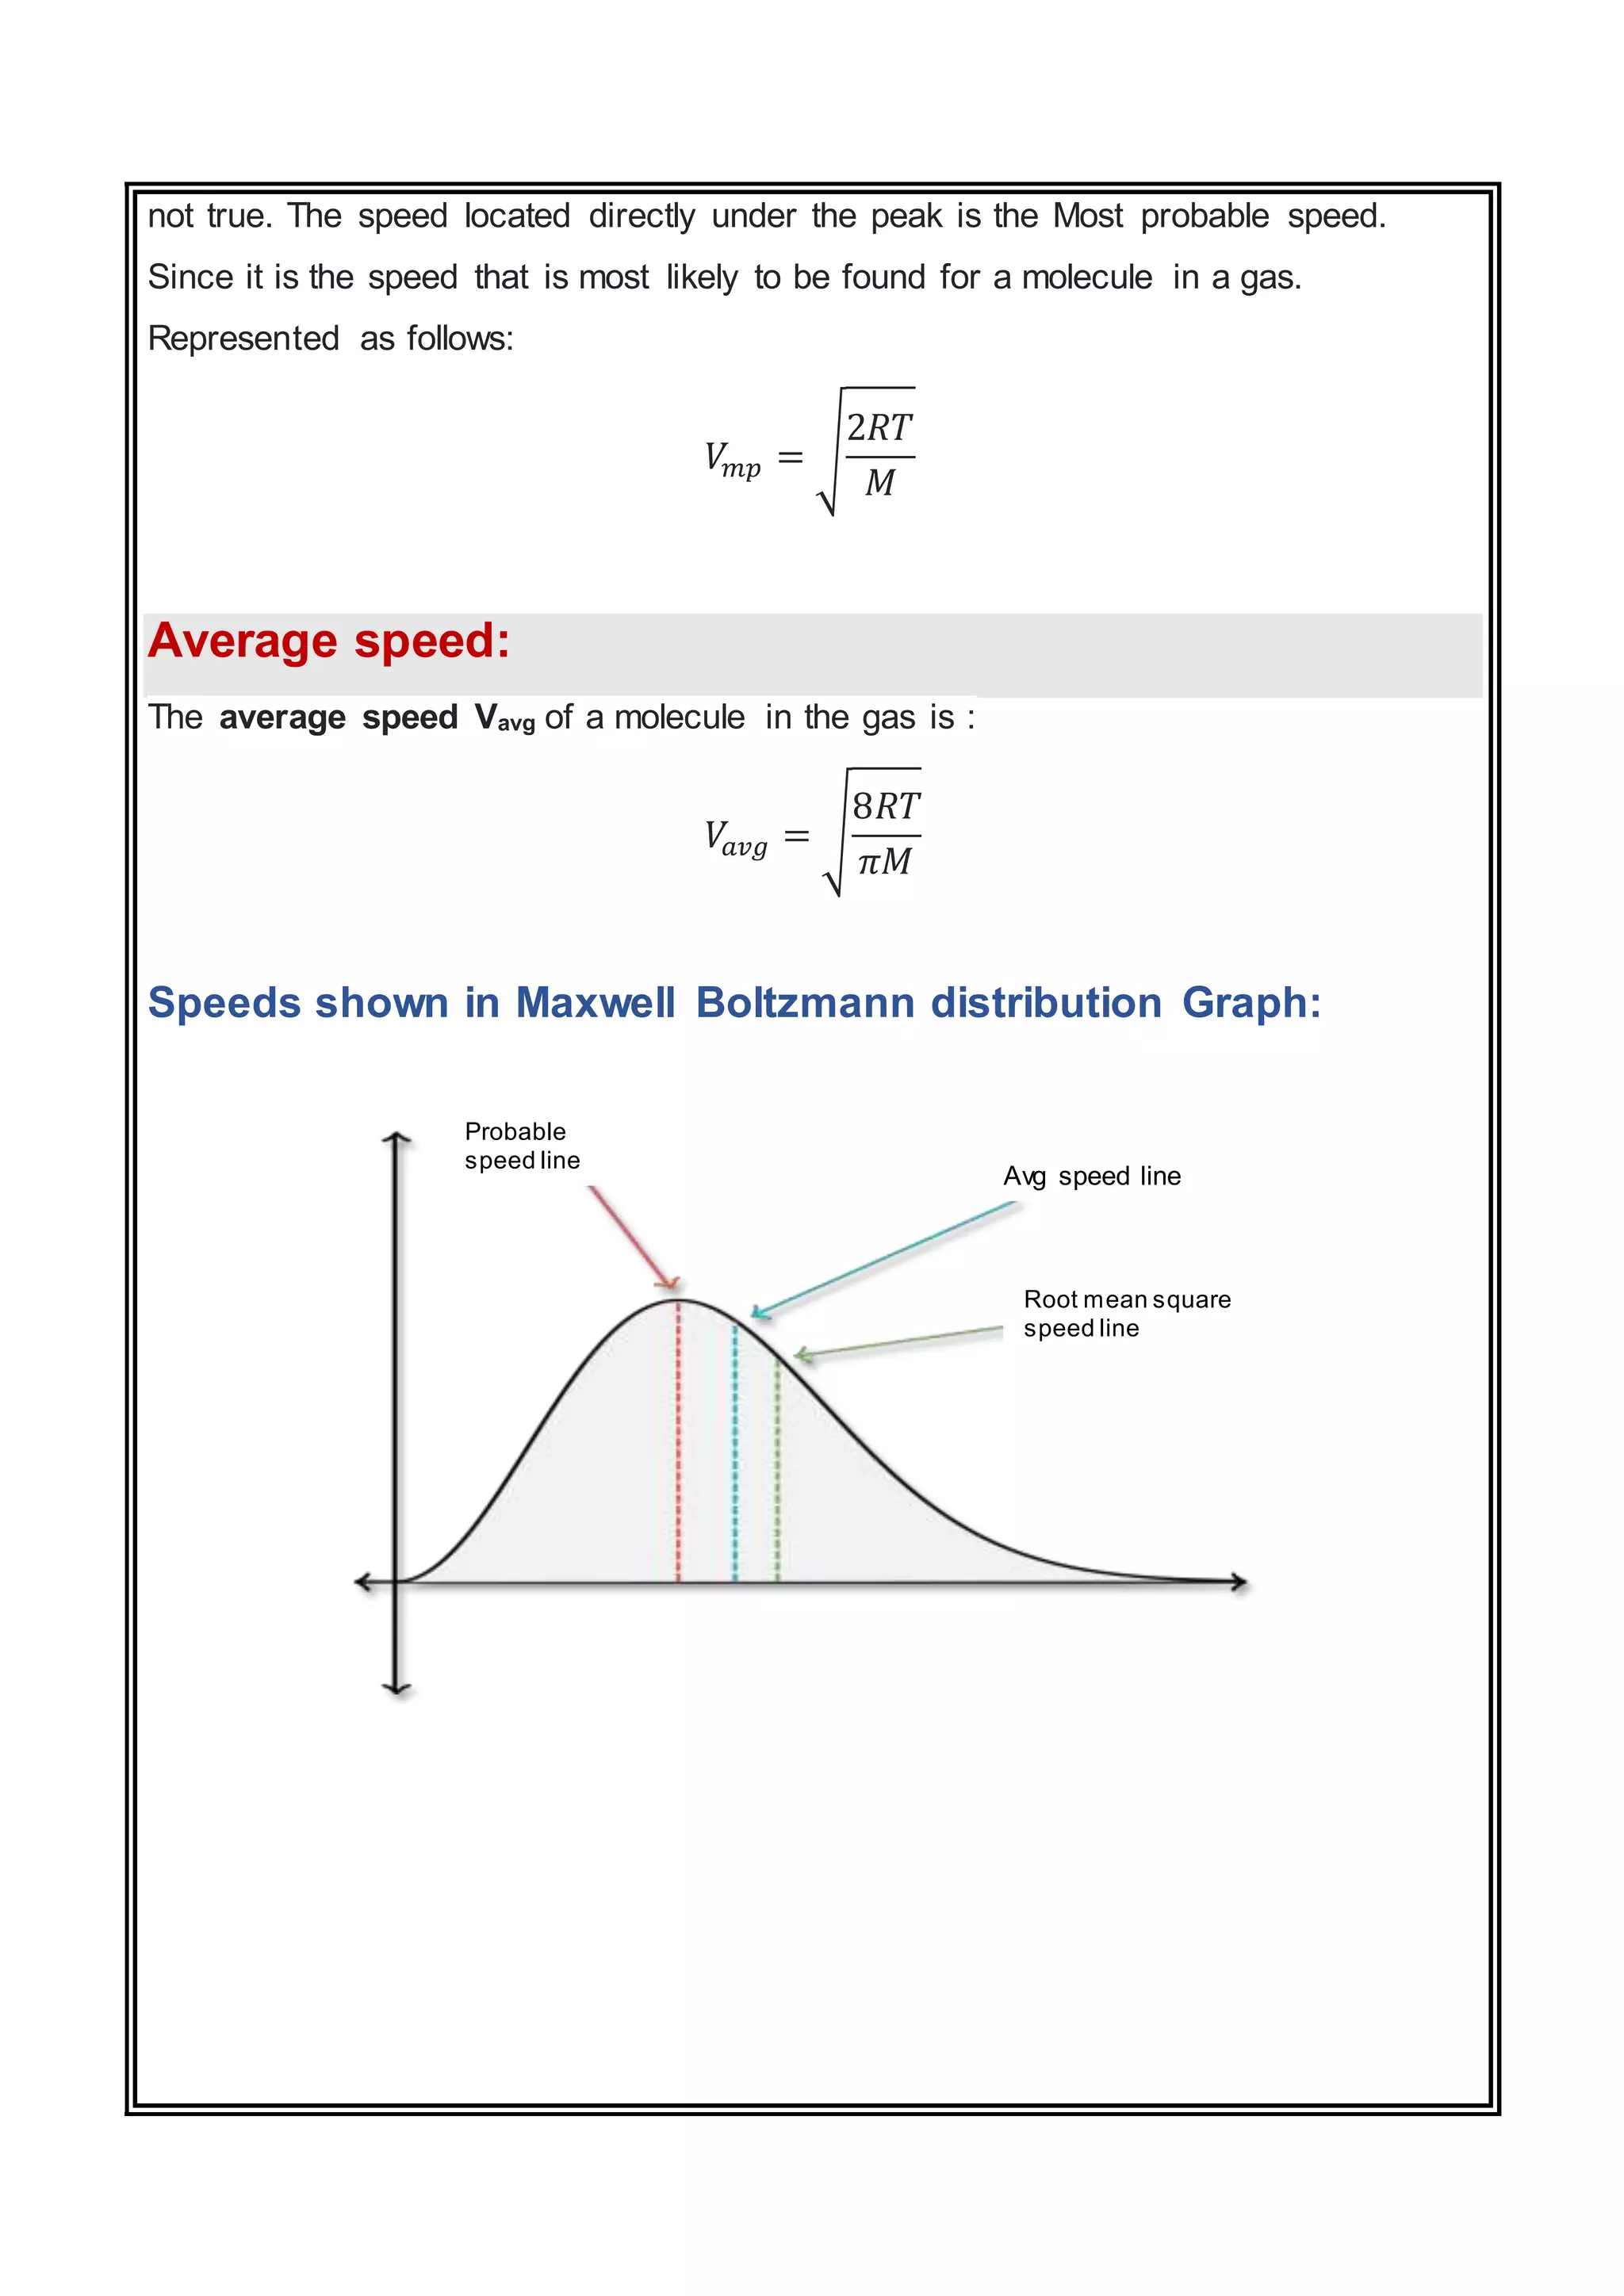


The document discusses the Maxwell-Boltzmann distribution, which describes the speeds of gas molecules at a given temperature. It was first developed by Maxwell and Boltzmann based on probabilistic arguments about molecular velocities. The distribution shows the fraction of molecules moving at different speeds and depends on temperature, mass, and other factors. Graphs of the distribution illustrate how it changes for different temperatures and molecule masses. The root mean square, most probable, and average speeds can be derived from the Maxwell-Boltzmann equation.