
Download to read offline
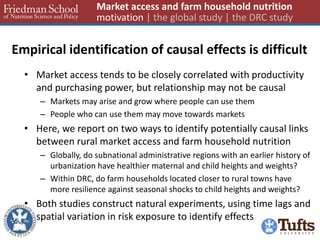
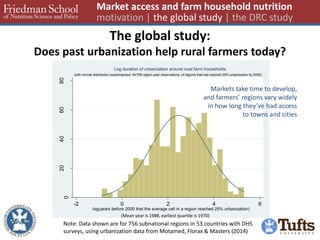
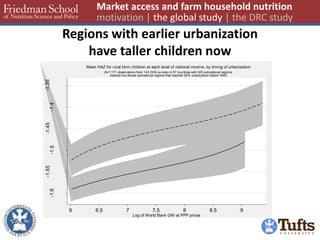
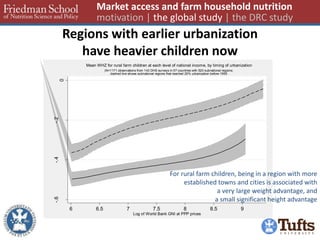
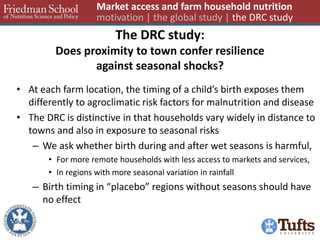
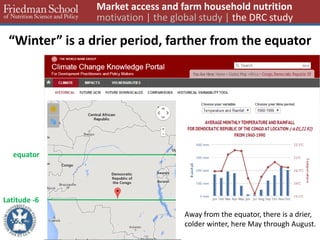
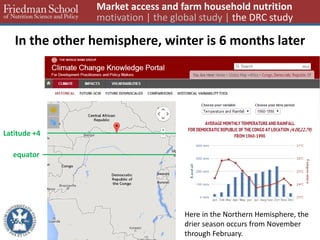
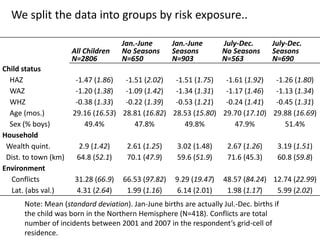
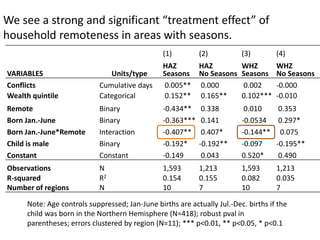
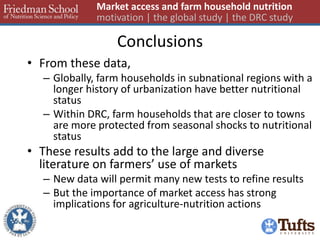
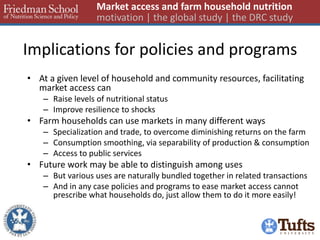
This document summarizes two studies on the relationship between rural market access and nutritional outcomes in farm households. The global study found that subnational regions with a longer history of urbanization had children with better heights and weights, indicating market access can improve nutrition. The DRC study found proximity to towns protected against negative impacts of seasonal shocks on child nutrition, demonstrating market access enhances resilience. Overall, the results suggest facilitating market access for farm households can raise nutritional status and improve resilience to shocks.


