SlideShare a Scribd company logo
1 of 139
Download to read offline
Basic and Advanced Full guide
BY JULIUS MATERN
Learning Path
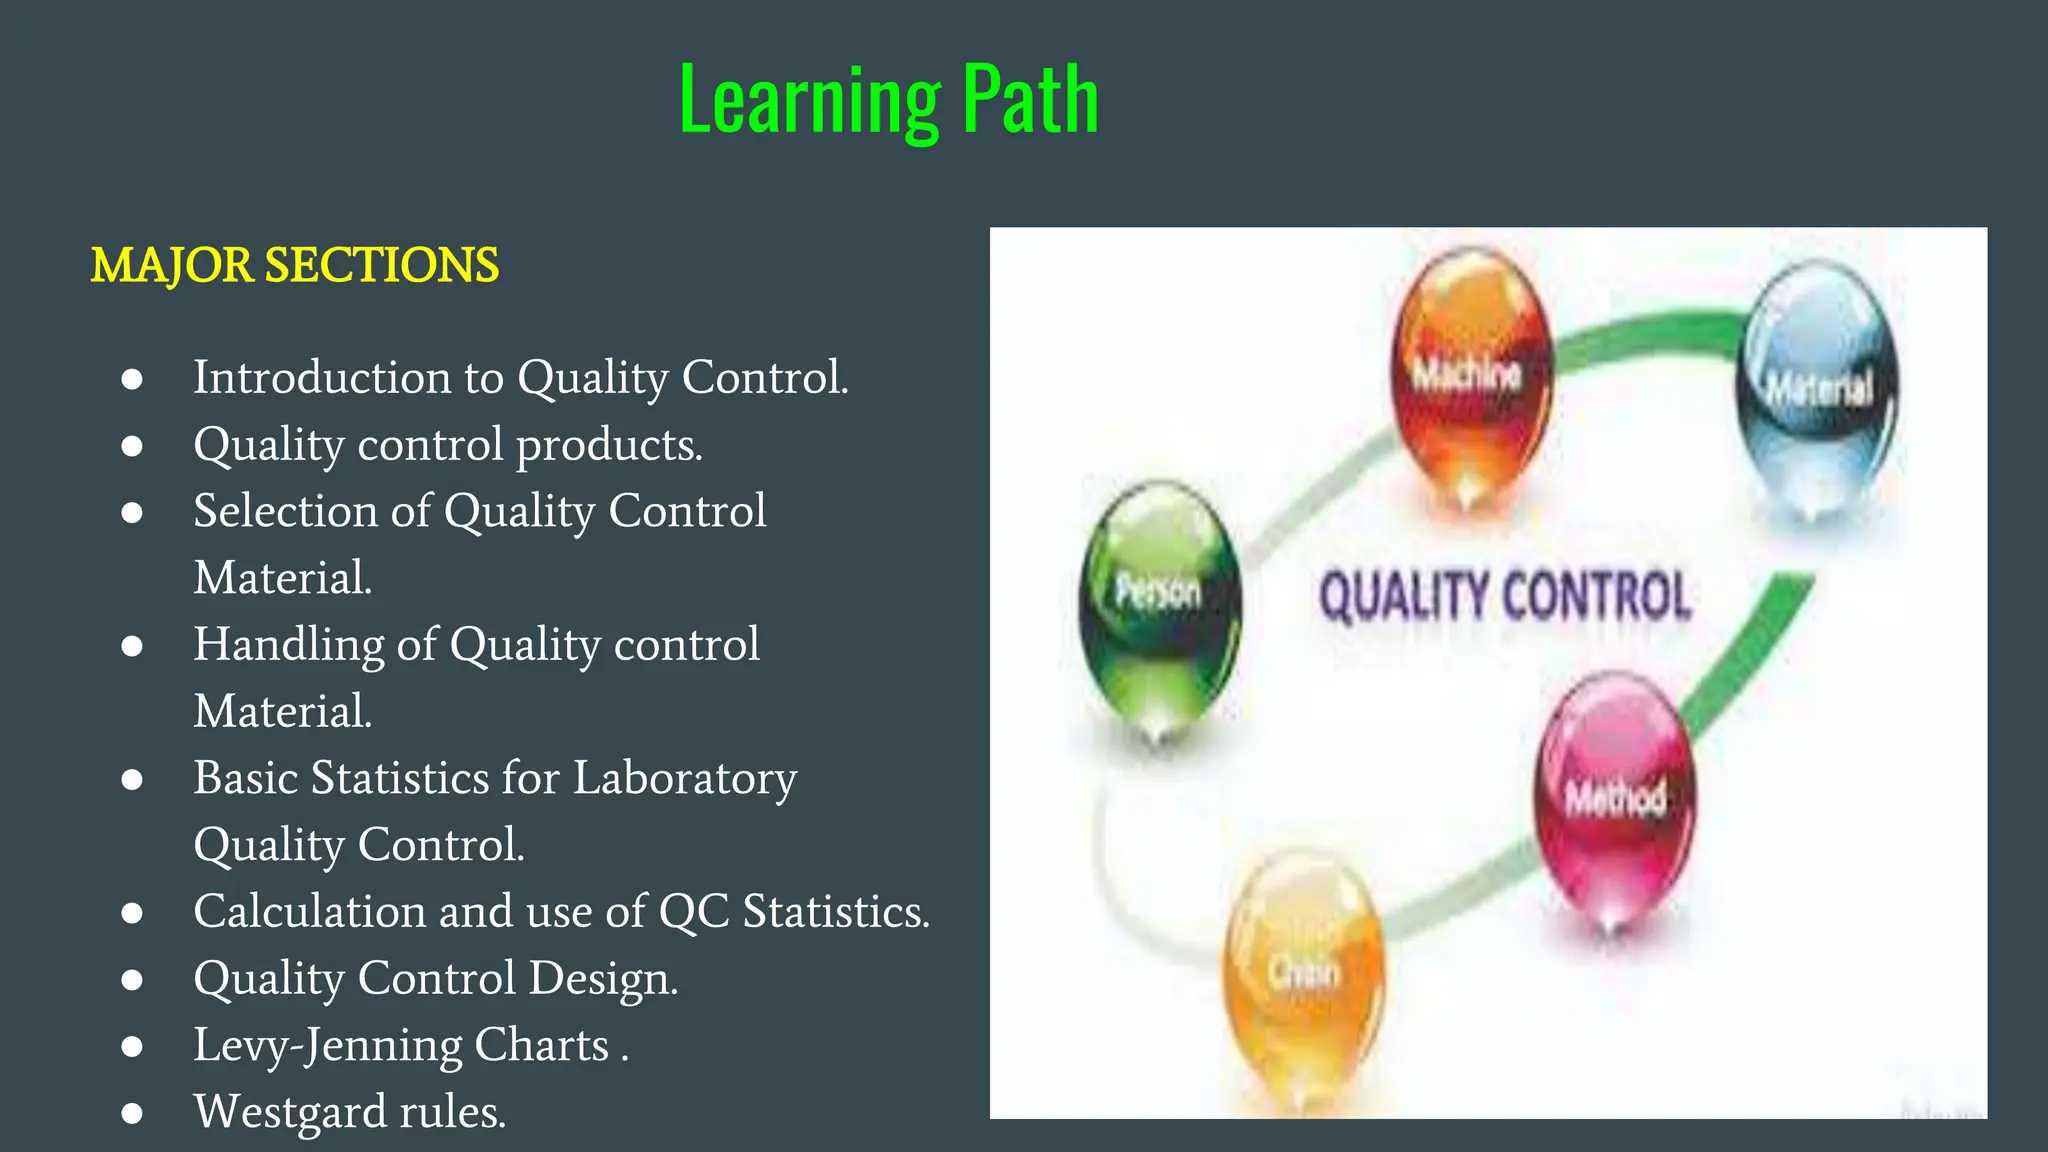
MAJOR SECTIONS
● Introduction to Quality Control.
● Quality control products.
● Selection of Quality Control
Material.
● Handling of Quality control
Material.
● Basic Statistics for Laboratory
Quality Control.
● Calculation and use of QC Statistics.
● Quality Control Design.
● Levy-Jenning Charts .
● Westgard rules.
Introduction to Quality control
● Achieving quality in the medical laboratory requires the
use of many tools.
● These include procedure manuals, maintenance schedules,
calibrations, a quality assurance program, training,
continuing education, competency assessments, and
quality control materials.
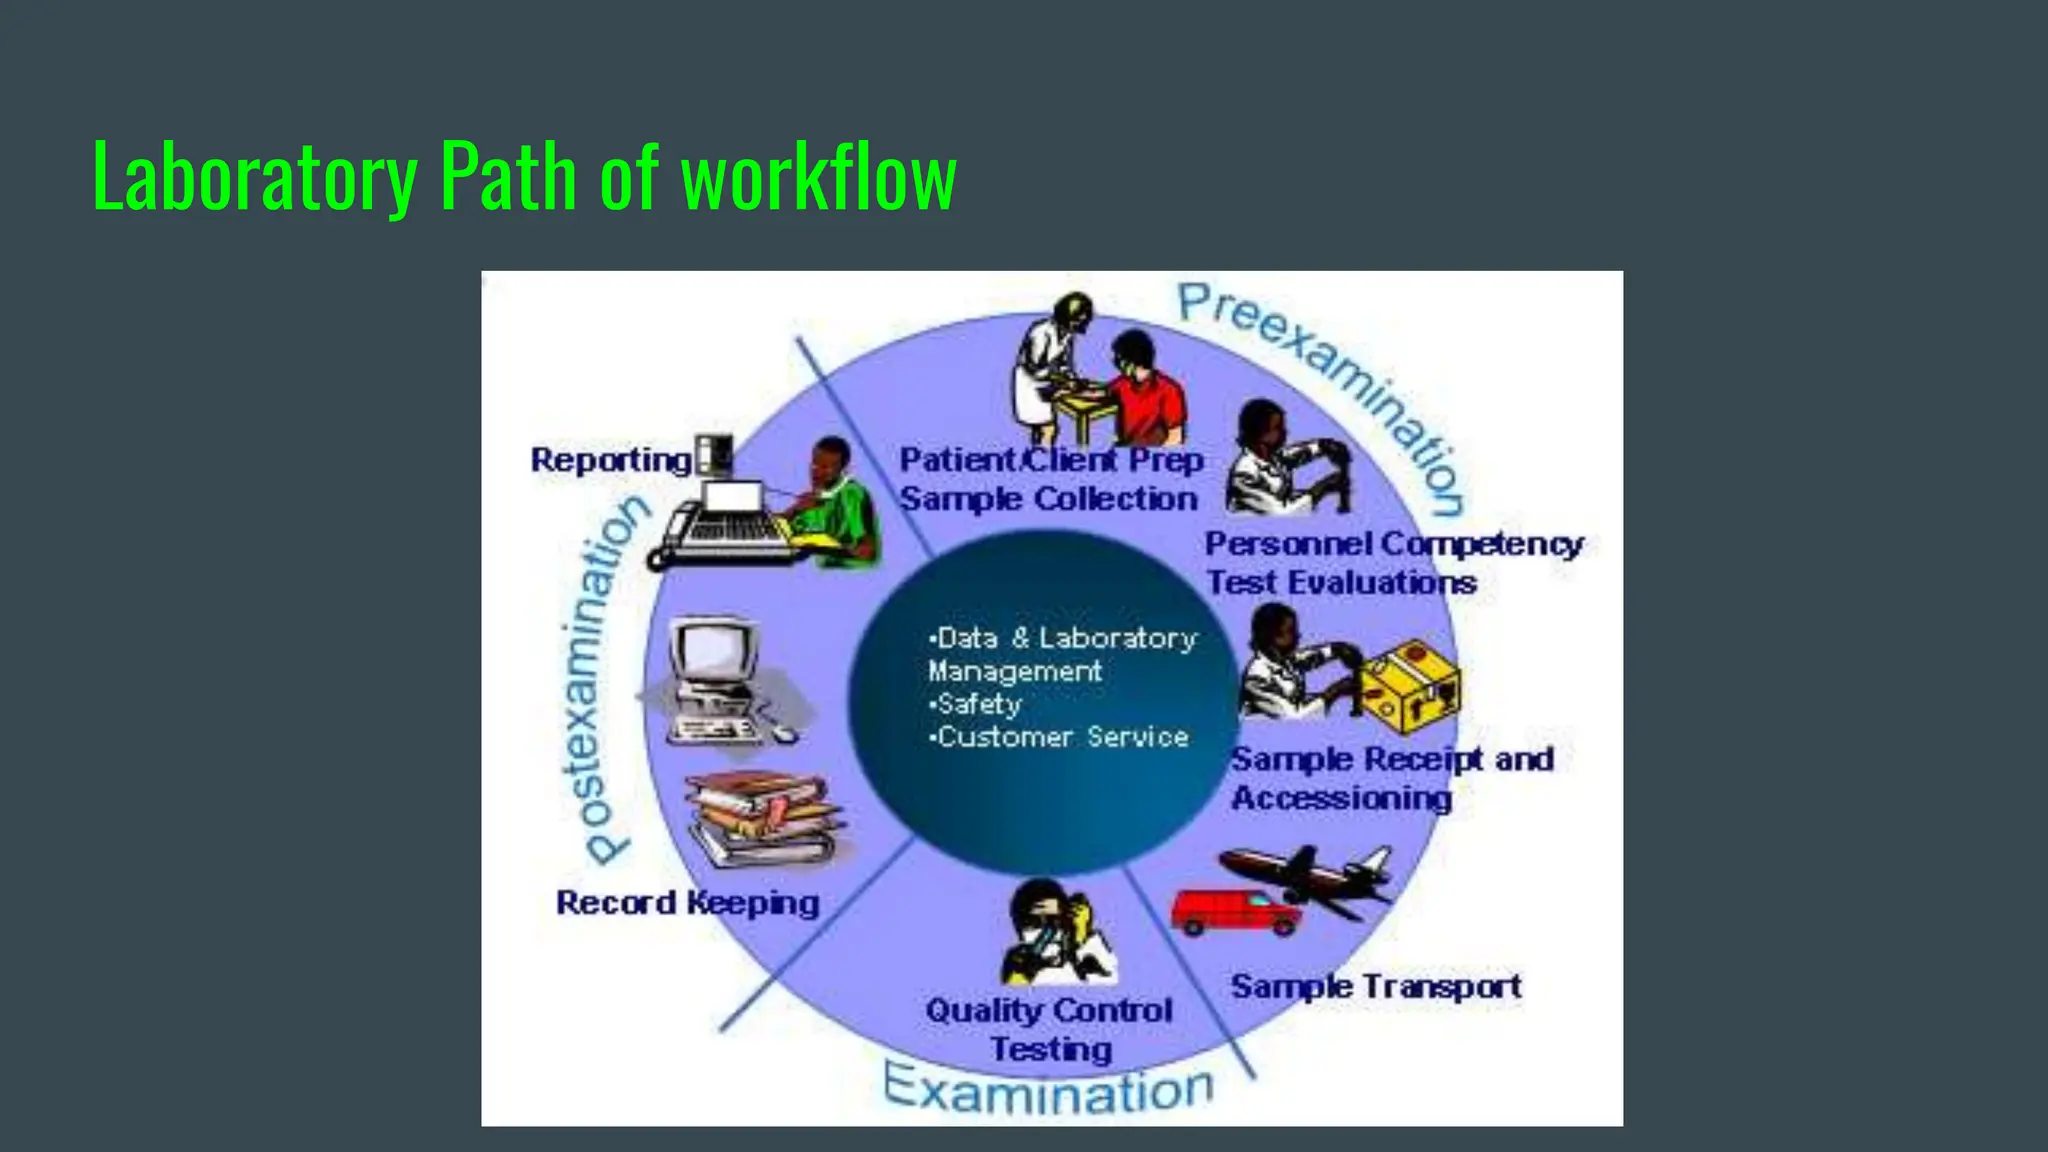
Laboratory Path of workflow
Introduction to Quality control
● Quality control : Refers to the statistical procedure used to
monitor and evaluate analytical process which is used to
produce clients results.
● Monitor analytical phase ensure accuracy , reliable and timely
results.
● Quality control involve regular testing of quality control
material together with patients samples, and compare quality
control results to specific statistical limits(range).
● Accuracy- Degree of closeness between measured value to the
true value.
● Laboratory results should be as accurate as possible
● When making measurement there is always some degree of
inaccuracy. Our target is to reduce the level of inaccuracy as much
as possible
Introduction to Quality control
● Accuracy of 99% may be good at some setting but think of
that 1% inaccuracy which might cause a huge problem and
effect to our clients.
Introduction to Quality control
● Quality control product: Is a patient like material ideally
made from human serum, urine or spinal fluid.
● Control product can be fluid or freeze-
dried(lyophilized),can contain one or more analytes(Multi-
Constituents) of known concentration.
● Control product should be tested and treated in the same
manner as patient sample.
Introduction to Quality control
● Sometimes control product are not human, control product
can be animal in origin or commercial prepared from
organic matrix.
Note: Aim of quality control is to detect error and correct them
before patient results are reported.
Introduction to Quality control
- Good laboratory practice require testing normal and
abnormal control for each test at least daily to monitor
analytical phase.
- Normal control: Contain normal level for analytes being
tested.
- Abnormal control: Contain analytes at concentration
above or below the normal range for analytes being tested.
Introduction to Quality control
- Regular testing of quality control products create a QC
database that a laboratory used to validate the testing
system.
- Validation occur by comparing the QC result with the
laboratory predefined range of QC value.
- The lab defined range is calculated from the QC data
collected from testing normal and abnormal control.
What are result of not practicing Quality control ?
- Unnecessary treatment
- Failure to provide proper treatment
- Delay in correct diagnosis
- Laboratory error cost Time, Manpower and Resources
Quality Control Material
Controls
● Substance, material, or
article intended by the
manufacturer to be used to
verify the performance
characteristics of an in
vitro diagnostic medical
device”
A quality control product is a patient-like material
ideally made from human serum, urine or spinal
fluid.
Control Material/Control products
The key here is that the control material is something we use to verify
that the medical device(test) is working correctly
Types of Control
There are some controls that are internal to the workings of the
instrument, particularly highlighted at the point of care. If it’s a control
that essentially doesn’t test anything like a patient sample or even a
surrogate patient sample, but instead uses some electronic check, this is
called Electronic QC
This are useful especially for internal checks example when you switch
on your Full blood picture machine it will do self check first before
allowing you to proceed with other steps.
Types of Control
- You can't just rely on electronic QC to ensure your testing Quality.
-Embedded QC - If the control materials are contained in on-board
ampules or cartridges,provided they have similar matrices to patient
specimens and follow all steps of the analytical process, those control
materials may be used as a substitute for traditional quality control
materials
Types of Control
Tradition QC- This involve the use of third party independent Quality
control material that involves the operator using the control material
like a patient sample.
Even with devices that have Electronic QC or Embedded QC, the
traditional steps of running QC should be performed at least
periodically.
This is termed as gold standard “best practice for Quality control”
Control Material
● Important part of Quality control is to
identify the proper quality control
material.
● The goal of quality control materials in
the laboratory is to have products that
are used in the same manner as patient
samples so that they can help assure that
the test systems are functioning
appropriately and producing high quality
patient results.
15
25 22
Control Material
● QC results are used to evaluate whether a test system (including
instruments and assay reagents) is operating within pre-defined
specifications, inferring that patient test results are reliable.
Control material are made from
● Human serum
● Whole blood
● CSF
● Urine and other body fluids
Control Material
Control can be sometimes categorized into two major parts
● Independent Quality controls
● Dependent Quality controls
Dependent Quality controls : Dependent controls are control materials
developed and formulated to be run on specific test systems.
These may be made by the test system manufacturer (sometimes called
“first party controls”) or contracted out to another company (sometimes
called “second party controls”).
Control Material
Independent Quality Control : Are control materials developed without
direction or aid from the manufacturer of the test system. This can work
on multiple test systems and across any reagent lots.
These controls are frequently called “third party controls.”
Independent controls may pick up errors that go undetected by
dependent control materials.
Control Material
The use of Independent control material is emphasized by different
guidelines including ISO 15189.
ISO 15189: “Use of third-party internal quality control material should
be considered, either as an alternative to, or in
addition to, control material supplied by the reagent or instrument
manufacturer.”
Control Material
Note: In addition of commercial QC there is also inhouse/laboratory
made QC material.
Forms of Control Material
Liquid control
● No reconstitution is required,but are also
frozen
Lyophilized/freeze-
dried) state.
● have good stability and
shelf life, but need to be reconstituted prior to use.
Deliverable 4
● Lorem ipsum dolor sit amet
● Sed do eiusmod tempor incididunt ut labore
The choice of either liquid or lyophilized control is upon the specific laboratory.
cont…
Control can have many analytes mixed together (Multi-Constituents)
example is chemistry controls.
But the choice of how many analytes should be in a given control
depends with the need of the specific laboratory.
Characteristics of Control Material
● Controls must be appropriate for the targeted diagnostic test
● The amount of the analyte present in the controls should be close to
the medical decision points of the test; this means that controls
should check both low values and high values.
● Controls should have the same matrix as patient samples
Assayed ,Unassayed and In-House Control?
● Assayed: Target value pre-defined by manufacturer. After purchasing
assayed control you need to Verify and start using it .
● When using assayed controls the laboratory must verify the value
using its own methods.
● Assayed controls are more expensive to purchase than unassayed
controls.
Assayed ,Unassayed and In-House Control?
● Unassayed: Target value not predefined,it need fully assay before
using it
● In-House: In house pooled sera,it need fully assay and validation..
SELECTION OF QC MATERIALS
cont…
Many different Qc material are available for the laboratory.
Choosing the right quality control product requires careful
consideration.
Factors which can be taken into consideration when selecting a best and
quality control for your laboratory.
● Open-vial stability
cont…
● Shelf-life
● Pricing/Volume
● Matrix
● medically relevant decision levels
● interlaboratory comparison programs and data management.
● Commutability
● Matrix effect
Open-Vial stability
Open-vial stability refers to the amount of time, after being opened,
that the QC remains stable, and analytes do not degrade.
When purchasing a quality control product, it is important to know the
approximate volume of the control to be used each day to determine the
open-vial stability requirements.
Open-Vial stability
Open vial stability refers to how long after the vial is open
the control material is stable and produces optimal results before it
deteriorates.
● Again, a longer open vial life will give you more time to utilize it.
You don’t want to waste control material because you can’t consume
the contents in the vial before its open vial expiration.
Open-Vial stability
For example, consider a general chemistry control material that
can be purchased in 10 mL vials. Laboratories that use 10 mL or more
per day would be less concerned with open-vial stability for this product.
But for those laboratories that use a lower volume of control (1 mL/day
for example), open-vial stability becomes an important issue.
Quality control open-vial stability should match or exceed the
laboratory’s normal usage rate to avoid waste.
Interlaboratory Comparison Programs and Data Management
Participation in inter-laboratory quality control comparison program is
highly recommended.
In such programs,laboratories anonymously submit QC results for
different assay/platform combinations. This allows participating
laboratories to compare their QC results with peer labs using the
same test systems.
Interlaboratory Comparison Programs and Data Management
One of the easiest methods to assess trueness and imprecision is to
compare the within-laboratory method means and standard
deviations with other laboratories (peer group) using the same
instrument and method.
Shelf life
Shelf life in this context refers to the expiration date of the
unopened product.
A long shelf life provides the ability to measure performance over a
long time, including reagent and calibrator lot changes
Pricing/Volume
It is recommended to have an idea of the cost of the quality control
product per mL and use this information when comparing QC
materials.
Matrix
● The matrix of a control is all the extra stabilizers, preservatives, and
other ingredients present to support the analyte itself but are wholly
unrelated to a patient sample.
● These additives may help keep the control material stable, or have a
longer shelf life, but they do not make the control behave as a
patient sample.
● As much as possible, labs need to avoid controls with heavily
artificial matrices and need to have controls that are as commutable
as possible
Matrix
The primary purpose of a control material is to evaluate a testing
procedures ability to perform as expected and to confirm that the
patient test results are suitable for use in providing medical care.
When choosing a quality control material, it is important to choose a
product that matches the matrix of the patient sample as closely as
possible.
The matrix is the substance that contains the measuring analytes. If a
chemistry analyzer tests glucose on both serum and urine
samples,QC material for each of these matrices should be used.
Commutability
● Commutability is the ideal goal of any type of control.
That is, the control material mimics as closely as possible a real patient
sample.
The opposite of commutability is often referred to as a Matrix Effect
Medically Relevant Decision Levels
It is important that the analyte concentration of quality control
materials be at clinically relevant levels.
Other factor to consider
Qc technical and educational support from vendor/manufacturer.
Another important evaluation to consider is checking whether the
manufacturer has ISO (or other) certifications to indicate
consistency in the observance of quality standards.
HANDLING OF QC MATERIAL
Processing steps
Control materials are tested along with patient samples and should
undergo all pre-treatments (if any) just like a patient sample. For
example, if a patient sample goes through an extraction process, the
control material should also go through the same process as well, if
possible
Product Inserts
Product inserts for control materials provide a variety of important
information. Printed paper inserts may be shipped with the product,
but most manufacturers today have moved product inserts to an
online, digital format. Product inserts are
used to publish claims associated with each lot number of the
control material. Claims typically include:
■ The stability for specific analytes after reconstitution or thaw
■ The expiration date (shelf life)
Product Inserts
■ The stability for specific analytes after reconstitution or thaw
■ The open-vial stability of the product
■ Instructions for reconstitution
■ For quantitative products, an estimate of the mean for each
analyte along with a range of acceptable means if it is an assayed
control.
Levels
Many guidelines recommend running two levels of control for each
day of patient testing. It's common to run a normal and abnormal
level (or positive/negative for qualitative tests). Some laboratories
may for some tests routinely test an abnormal low control and an
abnormal high control, assuming that if the low and high controls
are in control then the normal range will be in control as well.
Storage and Handling
The quality control product IFU will also contain information
regarding appropriate storage and handling procedures.
Before a laboratory decides to aliquot and freeze quality control
material, the product insert should be reviewed to ensure the
manufacturer states that this is acceptable.
Training
The use and handling of QC materials is an important activity that
has a direct impact on the analytical performance of the laboratory.
Continuing education is an important part of maintaining laboratory
quality. A good QC provider can be a source of education and
training on QC theory and good lab practices.
BASIC STATISTICS IN LABORATORY
QUALITYCONTROL
cont…
● One important part of quality control in the medical laboratory is
the statistical process used to monitor and evaluate the analytical
process that produces patient results.
● Quality control data are produced in the same manner as patient
sample.
● When the test is perfomed in the laboratory the outcome of the test
is the result ,either patient results or quality control results.
● The result may be quantitative (i.e., a number) or qualitative(e.g.,
positive or negative) or semi-quantitative (e.g., +1, +2, +3, +4)1.
cont…
● QC results are used to evaluate whether the instrument is operating
within pre-defined specifications.
● Once the test system is evaluated, patient results can then be used to
support diagnosis,prognosis, or treatment planning.
scenario..
● Let’s assume the measured value of potassium in a patient’s
serum is 2.8 mmol/L (a unit of measure, millimoles per liter).
● This result is abnormally low and indicates an inappropriate loss
of potassium. But how does the person performing the test know
that this result is truly reliable? It could be possible that the
instrument is out of calibration and the patient’s true potassium
value is 4.2 mmol/L – a normal result. The question of reliability
for most testing can be resolved by regular use of quality control
materials and statistical process control
Table 1 (Test-Potassium)
Range Level I(3.7-4.3
mmol/L)
Level II(6.7-7.3
mmol/L)
Patient Result
Oct 1 4.0 7.0 4.2,4.0,5.8,4.2,3.8
Oct 2 4.1 7.0 3.8,4.4,4.6,3.9,4.8
Oct 3 4.0 6.9 4.4,3.9,3.7,4.7
Oct 4 4.2 7.1 4.7,5.6,3.7,4.7
Oct 5 4.1 7.0 4.2,4.3,4.4.1,4.3
Oct 6 4.1 7.0 4.6,4.4,5.5,3.2
Oct 7 4.2 8.0 2.8,3.9,6.0,4.3
Table 1
In Table 1, there are two ranges listed. The acceptable range for
level 1 is 3.7 – 4.3 mmol/L.
The range for level 2 is 6.7 – 7.3 mmol/L.
When the daily QC result obtained for the level 1 control is
compared to the range calculated for the level 1 control,it
becomes apparent that each result lies somewhere within the
expected range. This indicates that the analytical process is “in
control” at the normal level on that day of testing
Table 1
● When the daily QC result for the level 2 control (high
potassium) is compared to the defined range for the level 2
control,the analytical process is shown to be “in control” for
each day of testing except for the last day (Oct 7).
● On Oct 1 through Oct 6, both controls were “in control” and
patient values could be reliably reported. However, the laboratory
was “out of control” for abnormal high potassiums on Oct 7 because
the value obtained for the QC material (8.0 mmol/L) was outside the
acceptable range (6.7 – 7.3 mmol/L).
Table 1
● This means that an error occurred which made the patient results
unreliable. The laboratory should not report the test results from any
patient samples until the error is resolved and the samples are re-
tested.
Calculation and use of QC Statistics
QC Statistics
● QC statistics for each test performed in the laboratory are calculated
from the QC data collected by regular testing of control products.
● The data collected is specific for each level and lot number of
control.
● Also the statistics and ranges calculated from this data are also
specific for each level and lot number of control.
Calculating Mean
● The mean (or average) is the laboratory’s best estimate of the
analyte’s true value for a specific level of control.
● This is one of the most fundamental calculation for the quality
control.
● Simply put, take the sum of all the control values for that level, then
divide by the number of measurements.
Calculating Mean
X - each value in the data set
Σ= Sum
N= The number of values in the data set
Calculating Mean
To calculate a mean for a specific level of control, first, add all the values
collected for that control. Then divide the sum of these values by the
total number of values.
Example let us calculate the mean value for the level 1 control in the
Table 1
- All values (4,4.1,4.0,4.2,4.1,4.1,4.2)
- Total number of values (7)
- Sum of all values(28.7)
Calculating Mean
- Then
- Mean = 28.7/7 = 4.1 mmol/L
Therefore, the mean for the Level 1 potassium control in Table 1 from
Oct 1-7 is 4.1 mmol/L
If you have an assayed control, you can compare your calculation to that
assayed (the target value or expected value) mean
Calculating Standard Deviation(SD)
Standard deviation is a statistic that quantifies how close numerical
values (i.e., QC values) are in relation to each other.
Imprecision is used to express how far apart numerical values are from
each other.
It provides the laboratory an estimate of test consistency at specific
concentrations.
The repeatability of a test may be consistent (low standard deviation,
low imprecision) or inconsistent (high standard deviation, high
imprecision).
Calculating Standard Deviation(SD)
● Inconsistent repeatability may be due to the chemistry involved or to
a malfunction.
● It is desirable to get repeated measurements of the same specimen as
close as possible. Good precision is especially needed for tests that
are repeated regularly on the same patient to track treatment or
disease progress.
Standard deviation may also be used to monitor on-going day-to-day
Calculating Standard Deviation(SD)
For instance, if during the next week of testing, the standard deviation
calculated in the example for the normal potassium control increases
from 0.08 to 0.16 mmol/L, this indicates a serious loss of precision.
This instability may be due to various factors and you should ask
yourself few questions
● Has the reagent lot changed?
● Has maintenance performed ?
● Are reagent and sample pipetted correctly?
Calculating Standard Deviation(SD)
● Was new operatory added recently?
● Has calibration being perfomed recently?
FORMULA
Although many software calculate SD but it is good to know
SD = √∑(xi−x
̄ )2 /n)
Calculating Standard Deviation(SD)
SD = standard deviation
x = mean (average) of the QC values
Σ(xn - x)2 = the sum of the squares of differences between individual
QC values and the mean
n = the number of values in the data set
Calculating Standard Deviation(SD)
From Table 1
Now we have mean lets calculate SD
Mean = 4.1 mmol/L
Our Control data = (4,4.1,4.0,4.2,4.1,4.1,4.2)
Calculating Standard Deviation(SD)
Subtract the mean (4.1) from each data point and square the result:
(4 - 4.1)² = 0.01 (4.1 - 4.1)² = 0 (4.0 - 4.1)² = 0.01 (4.2 - 4.1)² = 0.01 (4.1 -
4.1)² = 0 (4.1 - 4.1)² = 0 (4.2 - 4.1)² = 0.01
Sum up these squared differences:
0.01 + 0 + 0.01 + 0.01 + 0 + 0 + 0.01 = 0.04
Calculating Standard Deviation(SD)
● Divide the sum by the total number of data points (N), which is 7 in this
case:
0.04 / 7 = 0.00571428571 (approximately)
● Finally, take the square root of this result to get the standard deviation:
σ ≈ √0.00571428571 ≈ 0.0756 (rounded to four decimal places)
● So, the standard deviation of the given data set with a mean of 4.1 is
approximately 0.0756.≈ 0.1
Calculating Standard Deviation(SD)
● NB: The smaller the SD, the better the precision. The larger the SD,
the worse the imprecision
Coefficient of Variation [CV]
The Coefficient of Variation [CV] is the ratio of the standard deviation to
the mean and is expressed as a percentage.
● The CV allows the laboratory professional to make easier comparisons
of the overall precision.
● Since standard deviation typically increases as the concentration of
the analyte increases, the CV can be regarded as a statistical
equalizer.
FORMULA: CV = (SD / MEAN) X 100%
Coefficient of Variation [CV]-Scenario
● For example, a comparison between hexokinase and glucose oxidase
(two methods for assaying glucose) is required
● The standard deviation for the hexokinase method is 4.8 and it is 4.0
for glucose oxidase
● If the comparison only uses standard deviation, it can be incorrectly
assumed that the glucose oxidase method is more precise than the
hexokinase method.
If, however, a CV is calculated, it might show that both methods are
equally precise
Coefficient of Variation [CV]-Scenario
Assume
the mean for the hexokinase method is 120 and the glucose oxidase
mean is 100. The CV then, for both methods, is 4%. They are equally
precise
Hope you get hexokinase =4.8/120 x 100% = 4%
Then oxidase = 4/100 x 100% = 4%
● NB The Coefficient of Variation can also be used when comparing
instrument performance.
Coefficient of Variation [CV]-Scenario
● The CV allows you to look at imprecision across multiple control levels,
even compare imprecision between methods and instruments, and
compare them against the manufacturer’s expectations.
● Many accrediting organizations have requirements that the CV must be
monitored monthly for all quantitative assays.
Coefficient of Variation [CV]-Scenario
● The lower the CV, the lower the test system’s imprecision
QUALITY CONTROL DESIGN
How to set ranges?
● You have an absolutely new control – no previous lots, no previous
data, nothing cumulative from the past.
● Today is the first day you’re running it. How do you set up your ranges?
● [By ranges, we are referring to the mean, SD, and the Levey-Jennings
chart, by the way.
How to set ranges?
❖ The best practice is to establish your own mean and SD over a period
of 20 days for each level of control. Clearly, that means during the first
20 days of your new control, you’re waiting for the mean and SD, but
what are you going to use in the meantime?
❖ This is where the package insert range is most valuable
❖ If you have an assayed control, there is a data sheet supplied, either in
digital format or on old-fashioned paper, providing expected or target
means as well as standard deviations.
How to set ranges?
❖ If you have absolutely no other information, start by setting up your
mean and SD with the information from this package insert.
❖ [Fun fact: The mean and SD in the package insert are commonly
determined by running the control on a number of instruments or by
sending the control out to a select group of laboratories to run on their
variety of instruments.
How to set ranges?
❖ Since it comprises multiple instruments, even multiple labs, the SD will
be larger, possibly MUCH larger,than any individual laboratory’s SD.
❖ Therefore, it is important to switch to your own SD as soon as possible
after you have derived it from the data you have captured
❖ The longer you use the package insert SD, the longer you are at risk of
having your control limits too wide and missing significant errors.
Okay, that’s not so fun.]
How to set ranges?
❖ Since it comprises multiple instruments, even multiple labs, the SD will
be larger, possibly MUCH larger,than any individual laboratory’s SD.
❖ Therefore, it is important to switch to your own SD as soon as possible
after you have derived it from the data you have captured
❖ The longer you use the package insert SD, the longer you are at risk of
having your control limits too wide and missing significant errors.
How to set ranges?
❖ So, once you have more complete data representing your control
material’s performance on your method on your instrument in your
labs,
start using that information.
What if you want tighter ranges than offered in the package insert but
you, don’t have 20 days to collect data?
you can consider running multiple controls over a shorter number of
days: run four control runs per day for five days.
How to set ranges?
If you have a really short shelf-life control – this often happens with
hematology control material you may need to work with even shorter
crossover intervals.
HOW?
● Establish a new mean for the new control with 8-10 values run over a
few days. This is statistically sound – you can establish a new mean
with as few as eight values.
How to set ranges?
● Pair up the new mean with the old CV, and then calculate
new mean x old CV = temporary SD
● As soon as you have enough data (about 20 measurements), calculate
the new SD.
● Continue to update the SD when you have the next month of data, and
the next, until the expiration of the control
How to set ranges?
➢ NOTE: Many labs believe that if the shelf life of a control is very short,
they do not need to perform cross-over studies. Do not fall into that
trap! You are required by regulation to establish ranges on all lot
numbers prior to use. This is not only a good lab practice, it’s essential
risk management
switching to a new lot of QC
➢ If you are starting a new control lot of a control material you’ve used
recently, and you have experience with and historical data for the
previous lot, you can consider using that historical mean and SD as a
bridge to the new lot.
➢ Assuming these lots are manufactured with the goal of producing
nearly identical performance, you can use the historical mean and SD
until you have enough data to calculate the new mean and new SD.
switching to a new lot of QC
➢ If you are starting a new control lot of a control material you’ve used
recently, and you have experience with and historical data for the
previous lot, you can consider using that historical mean and SD as a
bridge to the new lot. You can use that data until you have your enough
data to have your own SD and Mean.
What if your range doesnt match package insert range?
➢ Remember the range on your package insert is meant to be a guide.
➢ Your mean should fall within the package insert range, but the range of
values represented by the SD and mean is not required to fall within
the package insert range.
NB: If your mean is not within the package insert range, you should
examine your method, confirm that you stored and processed the control
correctly.
Levey-Jennings Charts & Westgard Rules
LJ CHART
● The Levey-Jennings chart is used to graph successive (run-to-run or
day-to-day) quality control values.
● This type of control chart on which individual values or single values
are plotted directly on the graph.
● Levey and Jennings introduced statistical process control to medical
laboratories
LJ CHART
● Once you have Levey-Jennings charts, you can begin plotting data, run
by run, level by level, and deciding what points constitute acceptable,
“in-control” behavior, and what points represent unacceptable, “out-of-
control” behavior
LJ CHART
The green line is the mean(average)
LJ CHART
● Standard deviation is commonly used for preparing Levey-Jennings (L-
J or LJ) charts.
● The first step is to calculate decision limits.
● These limits are ±1s, ±2s and ±3s from the mean.
From TABLE I mean= 4.1 mmol/L
Standard deviation = 0.1mmol/L
Then lets calculate these limits (±1s, ±2s and ±3s)
LJ CHART -Decision Limits
±1s
Mean - SD(1)=
4.1 - 0.1(1)= 4.0
Mean + SD(1)=
4.1 + 0.1(1) = 4.2
: ±1s range is 4.0 to 4.2 mmol/L
LJ CHART -Decision Limits
±2s
Mean - SD(2)=
4.1 - 0.1(2)= 3.9
Mean + SD(1)=
4.1 + 0.1(2) = 4.3
: ±1s range is 3.9 to 4.3 mmol/L
LJ CHART -Decision Limits
±3s
Mean - SD(3)=
4.1 - 0.1(3)= 3.8
Mean + SD(3)=
4.1 + 0.1(3) = 4.4
: ±1s range is 3.8 to 4.4 mmol/L
LJ CHART
LJ CHART
● When an analytical process is within control,
approximately 68% of all QC values fall within
±1 standard deviation (1s).
● Likewise 95.5% of all QC values fall within ±2
standard deviations (2s) of the mean.
LJ CHART
● About 4.5% of all data will be outside the ±2s limits
when the analytical process is in control.
● Approximately 99.7% of all QC values are found to
be within ±3 standard deviations (3s) of the mean.
Note
● Some laboratories consider any quality control
value outside its ±2s limits to be out of control.
● They incorrectly decide that the patient specimens
and QC values are invalid.
❖ An analytical run should not be rejected if a single
quality control value is outside the ±2s QC limits
but within the ±3s QC limits
Note
❖ Laboratories that use a ±2s limit frequently reject
good runs. That means patient samples are
repeated unnecessarily, labor and materials are
wasted, and patient results are unnecessarily
delayed.
Use Levey Jenning Chart to Evaluate Quality
❖ The laboratory needs to document that quality
control materials are assayed and that the quality
control results have been inspected to assure the
quality of the analytical run.
❖ This documentation is accomplished by
maintaining a QC Log and using the Levey-
Jennings chart on a regular basis.
Use Levey Jenning Chart to Evaluate Quality
❖ The QC Log can be maintained on a computer or
on paper,The log should identify
● The name of test
● The instrument and units
● Results of each level of control assayed
● Date test performed
● Initial of person perfoming test
● Level of the assayed control(normal
Systematic Error
● Systematic error is evidenced by a change in the
mean of the control values.
● The change in the mean may be gradual and
demonstrated as a trend in control values or it
may be abrupt and demonstrated as a shift in
control values.
TREND
● A trend indicates a gradual loss of reliability in the
test system.
Causes
● Deterioration of the instrument light source
● Gradual deterioration of calibration
● Deterioration of Control
● Aging of reagents
SHIFT
● Abrupt changes in the control mean.
Shifts may be caused by:
● Change of reagent lot
● Major instrument maintenance.
● Suddenly change in incubation temperature.
● Failure in sampling system
SHIFT &TREND
RANDOM ERROR
● Technically, random error is any deviation away
from an expected result.
Westgard Rules
Westgard Rules
● There are six basic rules in the Westgard scheme.
These rules are used individually or in combination
to evaluate the quality of analytical runs.
12s
● This is referred to Warning rule
● This means that the “violation” of this warning
only triggers careful inspection of the control data.
● This is a warning rule that is violated when a single
control observation is outside the ±2s limits
12s
● This rule merely warns that random error or
systematic error may be present in the test
system.
● Patient results can be reported
12s
13s
★ Any QC result outside ±3s violates this rule
★ A run is rejected when a single control
measurement exceeds the mean +3s or the mean
–3s control limit.
13s
22s
This rule identifies systematic error only.
The criteria for violation of this rule are:
•Two consecutive QC results
•Greater than 2s
•On the same side of the mean
22s
There are two applications to this rule:
● Within run and
● Across run
22s- Within Run
● For example, if a normal (Level I) and abnormal
(Level II) control are assayed in this run and both
levels of control are greater than 2s on the same
side of the mean, this run violates the within-run
22s- Across Run
● Example level I in run I was outside 2s and again
level I in the second run is outside 2s.
R4s
● This rule only applied within the current run.There
must be at least difference of 4s.
● example, assume both Level I and Level II have
been assayed within the current run.
R4s
● Level I is +2.8s above the mean and Level II is -
1.3s below the mean. The total difference between
the two control levels is greater than 4s.
(e.g. [+2.8s – (-1.3s)] = 4.1s).
R4s
31s
The criteria which must be met to violate this
rule are:
● Three consecutive results
● Greater than 1s
● On the same side of the mean
41s
The criteria which must be met to violate this
rule are:
● Four consecutive results
● Greater than 1s
● On the same side of the mean
41s
7x 8x 9x 10x 12x
● These rules are violated when there are: 7 or 8, or
9, or 10, or 12 control results.
● On the same side of the mean regardless of the
specific standard deviation in which they are
located.
QC HINTS
Reminder*
● Controls are tested at the same time and in the
same way as patient samples.
Purpose of control is to:
● Validate the reliability of the test system.
● To evaluate operator’s performance
● Evaluate Environment conditions that might
impact the result.
Differentiate Control and Calibrator
● It is important not to confuse between calibrator
and control materials.
Calibrators are solutions with a specified defined
concentration that are used to set or calibrate an
instrument, kit, or system before testing is begun.
● Calibrators are often provided by the manufacturer
of an instrument.
Differentiate Control and Calibrator
● They should not be used as controls since they are
used to set the instrument.
● Calibrators are sometimes called standards, but
the term calibrator is preferred. They usually do
not have the same consistency(commutability) as
patients’ samples.
BY JULIUS MATERN
Medical laboratory scientist
Visit Our Website: clinicallabgurus.com

More Related Content

Similar to Master Quality control for clinical laboratories.pptx

Types of validation & validation of specific dosage.pptx
Types of validation & validation of specific dosage.pptxTypes of validation & validation of specific dosage.pptx
Types of validation & validation of specific dosage.pptxankitanakashe21
 
Quality control lecture CPath master 2014 Ain Shams
Quality control lecture CPath master 2014 Ain ShamsQuality control lecture CPath master 2014 Ain Shams
Quality control lecture CPath master 2014 Ain ShamsAdel Elazab Elged
 
Total Quality Management (TQM) by Dr Anurag Yadav
Total Quality Management (TQM) by Dr Anurag YadavTotal Quality Management (TQM) by Dr Anurag Yadav
Total Quality Management (TQM) by Dr Anurag YadavDr Anurag Yadav
 
qualitycontrolandinspection-151025072001-lva1-app6891.pptx
qualitycontrolandinspection-151025072001-lva1-app6891.pptxqualitycontrolandinspection-151025072001-lva1-app6891.pptx
qualitycontrolandinspection-151025072001-lva1-app6891.pptxssusera85eeb1
 
ISO 15189 Accreditation Guide - Improving Laboratory Performance Through Qual...
ISO 15189 Accreditation Guide - Improving Laboratory Performance Through Qual...ISO 15189 Accreditation Guide - Improving Laboratory Performance Through Qual...
ISO 15189 Accreditation Guide - Improving Laboratory Performance Through Qual...Randox
 
Quality and Inspection indicators which are in details.
Quality and Inspection indicators which are in details.Quality and Inspection indicators which are in details.
Quality and Inspection indicators which are in details.RajviParmar5
 
Quality control and inspection
Quality control and inspectionQuality control and inspection
Quality control and inspectionSamiksha Sawant
 
Quality assurance in medical laboratory
Quality assurance in medical laboratoryQuality assurance in medical laboratory
Quality assurance in medical laboratoryFaiz Alkhawlani
 
(IQC) - Internal Quality Control.pptx
(IQC) - Internal Quality Control.pptx(IQC) - Internal Quality Control.pptx
(IQC) - Internal Quality Control.pptxDr.Rajeev Ranjan
 
Pharmaceutical validation QA I Year.pptx
Pharmaceutical validation QA I Year.pptxPharmaceutical validation QA I Year.pptx
Pharmaceutical validation QA I Year.pptxmanoharkasde123
 
Quality Assurance and validation
Quality Assurance and validationQuality Assurance and validation
Quality Assurance and validationKrishan Verma
 
Quality control in protozoal identification
Quality control in protozoal identificationQuality control in protozoal identification
Quality control in protozoal identificationAhmed Zaahir
 
Overview of Quality Control and its implementation in the laboratory.pptx
Overview of Quality Control and its implementation in the laboratory.pptxOverview of Quality Control and its implementation in the laboratory.pptx
Overview of Quality Control and its implementation in the laboratory.pptxDipesh Tamrakar
 
Quality assurance in the department of clinical biochemistry
Quality assurance in the department of clinical biochemistryQuality assurance in the department of clinical biochemistry
Quality assurance in the department of clinical biochemistryDipesh Tamrakar
 
basic-concepts-of-quality-assuramnce-quality-control.pdf
basic-concepts-of-quality-assuramnce-quality-control.pdfbasic-concepts-of-quality-assuramnce-quality-control.pdf
basic-concepts-of-quality-assuramnce-quality-control.pdfRajakumari Rajendran
 
Ensuring the validity of results
Ensuring the validity of resultsEnsuring the validity of results
Ensuring the validity of resultsGH Yeoh
 

Similar to Master Quality control for clinical laboratories.pptx (20)

Quality control
Quality controlQuality control
Quality control
 
Types of validation & validation of specific dosage.pptx
Types of validation & validation of specific dosage.pptxTypes of validation & validation of specific dosage.pptx
Types of validation & validation of specific dosage.pptx
 
Quality control lecture CPath master 2014 Ain Shams
Quality control lecture CPath master 2014 Ain ShamsQuality control lecture CPath master 2014 Ain Shams
Quality control lecture CPath master 2014 Ain Shams
 
Quality control
Quality controlQuality control
Quality control
 
Total Quality Management (TQM) by Dr Anurag Yadav
Total Quality Management (TQM) by Dr Anurag YadavTotal Quality Management (TQM) by Dr Anurag Yadav
Total Quality Management (TQM) by Dr Anurag Yadav
 
qualitycontrolandinspection-151025072001-lva1-app6891.pptx
qualitycontrolandinspection-151025072001-lva1-app6891.pptxqualitycontrolandinspection-151025072001-lva1-app6891.pptx
qualitycontrolandinspection-151025072001-lva1-app6891.pptx
 
ISO 15189 Accreditation Guide - Improving Laboratory Performance Through Qual...
ISO 15189 Accreditation Guide - Improving Laboratory Performance Through Qual...ISO 15189 Accreditation Guide - Improving Laboratory Performance Through Qual...
ISO 15189 Accreditation Guide - Improving Laboratory Performance Through Qual...
 
Quality and Inspection indicators which are in details.
Quality and Inspection indicators which are in details.Quality and Inspection indicators which are in details.
Quality and Inspection indicators which are in details.
 
Quality control and inspection
Quality control and inspectionQuality control and inspection
Quality control and inspection
 
Quality assurance in medical laboratory
Quality assurance in medical laboratoryQuality assurance in medical laboratory
Quality assurance in medical laboratory
 
(IQC) - Internal Quality Control.pptx
(IQC) - Internal Quality Control.pptx(IQC) - Internal Quality Control.pptx
(IQC) - Internal Quality Control.pptx
 
Pharmaceutical validation QA I Year.pptx
Pharmaceutical validation QA I Year.pptxPharmaceutical validation QA I Year.pptx
Pharmaceutical validation QA I Year.pptx
 
Quality Assurance and validation
Quality Assurance and validationQuality Assurance and validation
Quality Assurance and validation
 
daada Quality control
daada Quality controldaada Quality control
daada Quality control
 
Quality control in protozoal identification
Quality control in protozoal identificationQuality control in protozoal identification
Quality control in protozoal identification
 
Overview of Quality Control and its implementation in the laboratory.pptx
Overview of Quality Control and its implementation in the laboratory.pptxOverview of Quality Control and its implementation in the laboratory.pptx
Overview of Quality Control and its implementation in the laboratory.pptx
 
Quality assurance in the department of clinical biochemistry
Quality assurance in the department of clinical biochemistryQuality assurance in the department of clinical biochemistry
Quality assurance in the department of clinical biochemistry
 
Gaurav ppt
Gaurav pptGaurav ppt
Gaurav ppt
 
basic-concepts-of-quality-assuramnce-quality-control.pdf
basic-concepts-of-quality-assuramnce-quality-control.pdfbasic-concepts-of-quality-assuramnce-quality-control.pdf
basic-concepts-of-quality-assuramnce-quality-control.pdf
 
Ensuring the validity of results
Ensuring the validity of resultsEnsuring the validity of results
Ensuring the validity of results
 

Recently uploaded

Chandrapur Call girls 8617370543 Provides all area service COD available
Chandrapur Call girls 8617370543 Provides all area service COD availableChandrapur Call girls 8617370543 Provides all area service COD available
Chandrapur Call girls 8617370543 Provides all area service COD availableDipal Arora
 
Top Rated Bangalore Call Girls Richmond Circle ⟟ 8250192130 ⟟ Call Me For Gen...
Top Rated Bangalore Call Girls Richmond Circle ⟟ 8250192130 ⟟ Call Me For Gen...Top Rated Bangalore Call Girls Richmond Circle ⟟ 8250192130 ⟟ Call Me For Gen...
Top Rated Bangalore Call Girls Richmond Circle ⟟ 8250192130 ⟟ Call Me For Gen...narwatsonia7
 
Artifacts in Nuclear Medicine with Identifying and resolving artifacts.
Artifacts in Nuclear Medicine with Identifying and resolving artifacts.Artifacts in Nuclear Medicine with Identifying and resolving artifacts.
Artifacts in Nuclear Medicine with Identifying and resolving artifacts.MiadAlsulami
 
High Profile Call Girls Coimbatore Saanvi☎️ 8250192130 Independent Escort Se...
High Profile Call Girls Coimbatore Saanvi☎️  8250192130 Independent Escort Se...High Profile Call Girls Coimbatore Saanvi☎️  8250192130 Independent Escort Se...
High Profile Call Girls Coimbatore Saanvi☎️ 8250192130 Independent Escort Se...narwatsonia7
 
Call Girls Aurangabad Just Call 9907093804 Top Class Call Girl Service Available
Call Girls Aurangabad Just Call 9907093804 Top Class Call Girl Service AvailableCall Girls Aurangabad Just Call 9907093804 Top Class Call Girl Service Available
Call Girls Aurangabad Just Call 9907093804 Top Class Call Girl Service AvailableDipal Arora
 
Call Girls Colaba Mumbai ❤️ 9920874524 👈 Cash on Delivery
Call Girls Colaba Mumbai ❤️ 9920874524 👈 Cash on DeliveryCall Girls Colaba Mumbai ❤️ 9920874524 👈 Cash on Delivery
Call Girls Colaba Mumbai ❤️ 9920874524 👈 Cash on Deliverynehamumbai
 
(👑VVIP ISHAAN ) Russian Call Girls Service Navi Mumbai🖕9920874524🖕Independent...
(👑VVIP ISHAAN ) Russian Call Girls Service Navi Mumbai🖕9920874524🖕Independent...(👑VVIP ISHAAN ) Russian Call Girls Service Navi Mumbai🖕9920874524🖕Independent...
(👑VVIP ISHAAN ) Russian Call Girls Service Navi Mumbai🖕9920874524🖕Independent...Taniya Sharma
 
Call Girls Varanasi Just Call 9907093804 Top Class Call Girl Service Available
Call Girls Varanasi Just Call 9907093804 Top Class Call Girl Service AvailableCall Girls Varanasi Just Call 9907093804 Top Class Call Girl Service Available
Call Girls Varanasi Just Call 9907093804 Top Class Call Girl Service AvailableDipal Arora
 
Call Girls Coimbatore Just Call 9907093804 Top Class Call Girl Service Available
Call Girls Coimbatore Just Call 9907093804 Top Class Call Girl Service AvailableCall Girls Coimbatore Just Call 9907093804 Top Class Call Girl Service Available
Call Girls Coimbatore Just Call 9907093804 Top Class Call Girl Service AvailableDipal Arora
 
VIP Mumbai Call Girls Hiranandani Gardens Just Call 9920874524 with A/C Room ...
VIP Mumbai Call Girls Hiranandani Gardens Just Call 9920874524 with A/C Room ...VIP Mumbai Call Girls Hiranandani Gardens Just Call 9920874524 with A/C Room ...
VIP Mumbai Call Girls Hiranandani Gardens Just Call 9920874524 with A/C Room ...Garima Khatri
 
Night 7k to 12k Navi Mumbai Call Girl Photo 👉 BOOK NOW 9833363713 👈 ♀️ night ...
Night 7k to 12k Navi Mumbai Call Girl Photo 👉 BOOK NOW 9833363713 👈 ♀️ night ...Night 7k to 12k Navi Mumbai Call Girl Photo 👉 BOOK NOW 9833363713 👈 ♀️ night ...
Night 7k to 12k Navi Mumbai Call Girl Photo 👉 BOOK NOW 9833363713 👈 ♀️ night ...aartirawatdelhi
 
Call Girl Number in Panvel Mumbai📲 9833363713 💞 Full Night Enjoy
Call Girl Number in Panvel Mumbai📲 9833363713 💞 Full Night EnjoyCall Girl Number in Panvel Mumbai📲 9833363713 💞 Full Night Enjoy
Call Girl Number in Panvel Mumbai📲 9833363713 💞 Full Night Enjoybabeytanya
 
Call Girl Coimbatore Prisha☎️ 8250192130 Independent Escort Service Coimbatore
Call Girl Coimbatore Prisha☎️  8250192130 Independent Escort Service CoimbatoreCall Girl Coimbatore Prisha☎️  8250192130 Independent Escort Service Coimbatore
Call Girl Coimbatore Prisha☎️ 8250192130 Independent Escort Service Coimbatorenarwatsonia7
 
Kesar Bagh Call Girl Price 9548273370 , Lucknow Call Girls Service
Kesar Bagh Call Girl Price 9548273370 , Lucknow Call Girls ServiceKesar Bagh Call Girl Price 9548273370 , Lucknow Call Girls Service
Kesar Bagh Call Girl Price 9548273370 , Lucknow Call Girls Servicemakika9823
 
VIP Russian Call Girls in Varanasi Samaira 8250192130 Independent Escort Serv...
VIP Russian Call Girls in Varanasi Samaira 8250192130 Independent Escort Serv...VIP Russian Call Girls in Varanasi Samaira 8250192130 Independent Escort Serv...
VIP Russian Call Girls in Varanasi Samaira 8250192130 Independent Escort Serv...Neha Kaur
 
Vip Call Girls Anna Salai Chennai 👉 8250192130 ❣️💯 Top Class Girls Available
Vip Call Girls Anna Salai Chennai 👉 8250192130 ❣️💯 Top Class Girls AvailableVip Call Girls Anna Salai Chennai 👉 8250192130 ❣️💯 Top Class Girls Available
Vip Call Girls Anna Salai Chennai 👉 8250192130 ❣️💯 Top Class Girls AvailableNehru place Escorts
 
All Time Service Available Call Girls Marine Drive 📳 9820252231 For 18+ VIP C...
All Time Service Available Call Girls Marine Drive 📳 9820252231 For 18+ VIP C...All Time Service Available Call Girls Marine Drive 📳 9820252231 For 18+ VIP C...
All Time Service Available Call Girls Marine Drive 📳 9820252231 For 18+ VIP C...Arohi Goyal
 
Night 7k to 12k Chennai City Center Call Girls 👉👉 7427069034⭐⭐ 100% Genuine E...
Night 7k to 12k Chennai City Center Call Girls 👉👉 7427069034⭐⭐ 100% Genuine E...Night 7k to 12k Chennai City Center Call Girls 👉👉 7427069034⭐⭐ 100% Genuine E...
Night 7k to 12k Chennai City Center Call Girls 👉👉 7427069034⭐⭐ 100% Genuine E...hotbabesbook
 
Book Paid Powai Call Girls Mumbai 𖠋 9930245274 𖠋Low Budget Full Independent H...
Book Paid Powai Call Girls Mumbai 𖠋 9930245274 𖠋Low Budget Full Independent H...Book Paid Powai Call Girls Mumbai 𖠋 9930245274 𖠋Low Budget Full Independent H...
Book Paid Powai Call Girls Mumbai 𖠋 9930245274 𖠋Low Budget Full Independent H...Call Girls in Nagpur High Profile
 
Call Girl Number in Vashi Mumbai📲 9833363713 💞 Full Night Enjoy
Call Girl Number in Vashi Mumbai📲 9833363713 💞 Full Night EnjoyCall Girl Number in Vashi Mumbai📲 9833363713 💞 Full Night Enjoy
Call Girl Number in Vashi Mumbai📲 9833363713 💞 Full Night Enjoybabeytanya
 

Recently uploaded (20)

Chandrapur Call girls 8617370543 Provides all area service COD available
Chandrapur Call girls 8617370543 Provides all area service COD availableChandrapur Call girls 8617370543 Provides all area service COD available
Chandrapur Call girls 8617370543 Provides all area service COD available
 
Top Rated Bangalore Call Girls Richmond Circle ⟟ 8250192130 ⟟ Call Me For Gen...
Top Rated Bangalore Call Girls Richmond Circle ⟟ 8250192130 ⟟ Call Me For Gen...Top Rated Bangalore Call Girls Richmond Circle ⟟ 8250192130 ⟟ Call Me For Gen...
Top Rated Bangalore Call Girls Richmond Circle ⟟ 8250192130 ⟟ Call Me For Gen...
 
Artifacts in Nuclear Medicine with Identifying and resolving artifacts.
Artifacts in Nuclear Medicine with Identifying and resolving artifacts.Artifacts in Nuclear Medicine with Identifying and resolving artifacts.
Artifacts in Nuclear Medicine with Identifying and resolving artifacts.
 
High Profile Call Girls Coimbatore Saanvi☎️ 8250192130 Independent Escort Se...
High Profile Call Girls Coimbatore Saanvi☎️  8250192130 Independent Escort Se...High Profile Call Girls Coimbatore Saanvi☎️  8250192130 Independent Escort Se...
High Profile Call Girls Coimbatore Saanvi☎️ 8250192130 Independent Escort Se...
 
Call Girls Aurangabad Just Call 9907093804 Top Class Call Girl Service Available
Call Girls Aurangabad Just Call 9907093804 Top Class Call Girl Service AvailableCall Girls Aurangabad Just Call 9907093804 Top Class Call Girl Service Available
Call Girls Aurangabad Just Call 9907093804 Top Class Call Girl Service Available
 
Call Girls Colaba Mumbai ❤️ 9920874524 👈 Cash on Delivery
Call Girls Colaba Mumbai ❤️ 9920874524 👈 Cash on DeliveryCall Girls Colaba Mumbai ❤️ 9920874524 👈 Cash on Delivery
Call Girls Colaba Mumbai ❤️ 9920874524 👈 Cash on Delivery
 
(👑VVIP ISHAAN ) Russian Call Girls Service Navi Mumbai🖕9920874524🖕Independent...
(👑VVIP ISHAAN ) Russian Call Girls Service Navi Mumbai🖕9920874524🖕Independent...(👑VVIP ISHAAN ) Russian Call Girls Service Navi Mumbai🖕9920874524🖕Independent...
(👑VVIP ISHAAN ) Russian Call Girls Service Navi Mumbai🖕9920874524🖕Independent...
 
Call Girls Varanasi Just Call 9907093804 Top Class Call Girl Service Available
Call Girls Varanasi Just Call 9907093804 Top Class Call Girl Service AvailableCall Girls Varanasi Just Call 9907093804 Top Class Call Girl Service Available
Call Girls Varanasi Just Call 9907093804 Top Class Call Girl Service Available
 
Call Girls Coimbatore Just Call 9907093804 Top Class Call Girl Service Available
Call Girls Coimbatore Just Call 9907093804 Top Class Call Girl Service AvailableCall Girls Coimbatore Just Call 9907093804 Top Class Call Girl Service Available
Call Girls Coimbatore Just Call 9907093804 Top Class Call Girl Service Available
 
VIP Mumbai Call Girls Hiranandani Gardens Just Call 9920874524 with A/C Room ...
VIP Mumbai Call Girls Hiranandani Gardens Just Call 9920874524 with A/C Room ...VIP Mumbai Call Girls Hiranandani Gardens Just Call 9920874524 with A/C Room ...
VIP Mumbai Call Girls Hiranandani Gardens Just Call 9920874524 with A/C Room ...
 
Night 7k to 12k Navi Mumbai Call Girl Photo 👉 BOOK NOW 9833363713 👈 ♀️ night ...
Night 7k to 12k Navi Mumbai Call Girl Photo 👉 BOOK NOW 9833363713 👈 ♀️ night ...Night 7k to 12k Navi Mumbai Call Girl Photo 👉 BOOK NOW 9833363713 👈 ♀️ night ...
Night 7k to 12k Navi Mumbai Call Girl Photo 👉 BOOK NOW 9833363713 👈 ♀️ night ...
 
Call Girl Number in Panvel Mumbai📲 9833363713 💞 Full Night Enjoy
Call Girl Number in Panvel Mumbai📲 9833363713 💞 Full Night EnjoyCall Girl Number in Panvel Mumbai📲 9833363713 💞 Full Night Enjoy
Call Girl Number in Panvel Mumbai📲 9833363713 💞 Full Night Enjoy
 
Call Girl Coimbatore Prisha☎️ 8250192130 Independent Escort Service Coimbatore
Call Girl Coimbatore Prisha☎️  8250192130 Independent Escort Service CoimbatoreCall Girl Coimbatore Prisha☎️  8250192130 Independent Escort Service Coimbatore
Call Girl Coimbatore Prisha☎️ 8250192130 Independent Escort Service Coimbatore
 
Kesar Bagh Call Girl Price 9548273370 , Lucknow Call Girls Service
Kesar Bagh Call Girl Price 9548273370 , Lucknow Call Girls ServiceKesar Bagh Call Girl Price 9548273370 , Lucknow Call Girls Service
Kesar Bagh Call Girl Price 9548273370 , Lucknow Call Girls Service
 
VIP Russian Call Girls in Varanasi Samaira 8250192130 Independent Escort Serv...
VIP Russian Call Girls in Varanasi Samaira 8250192130 Independent Escort Serv...VIP Russian Call Girls in Varanasi Samaira 8250192130 Independent Escort Serv...
VIP Russian Call Girls in Varanasi Samaira 8250192130 Independent Escort Serv...
 
Vip Call Girls Anna Salai Chennai 👉 8250192130 ❣️💯 Top Class Girls Available
Vip Call Girls Anna Salai Chennai 👉 8250192130 ❣️💯 Top Class Girls AvailableVip Call Girls Anna Salai Chennai 👉 8250192130 ❣️💯 Top Class Girls Available
Vip Call Girls Anna Salai Chennai 👉 8250192130 ❣️💯 Top Class Girls Available
 
All Time Service Available Call Girls Marine Drive 📳 9820252231 For 18+ VIP C...
All Time Service Available Call Girls Marine Drive 📳 9820252231 For 18+ VIP C...All Time Service Available Call Girls Marine Drive 📳 9820252231 For 18+ VIP C...
All Time Service Available Call Girls Marine Drive 📳 9820252231 For 18+ VIP C...
 
Night 7k to 12k Chennai City Center Call Girls 👉👉 7427069034⭐⭐ 100% Genuine E...
Night 7k to 12k Chennai City Center Call Girls 👉👉 7427069034⭐⭐ 100% Genuine E...Night 7k to 12k Chennai City Center Call Girls 👉👉 7427069034⭐⭐ 100% Genuine E...
Night 7k to 12k Chennai City Center Call Girls 👉👉 7427069034⭐⭐ 100% Genuine E...
 
Book Paid Powai Call Girls Mumbai 𖠋 9930245274 𖠋Low Budget Full Independent H...
Book Paid Powai Call Girls Mumbai 𖠋 9930245274 𖠋Low Budget Full Independent H...Book Paid Powai Call Girls Mumbai 𖠋 9930245274 𖠋Low Budget Full Independent H...
Book Paid Powai Call Girls Mumbai 𖠋 9930245274 𖠋Low Budget Full Independent H...
 
Call Girl Number in Vashi Mumbai📲 9833363713 💞 Full Night Enjoy
Call Girl Number in Vashi Mumbai📲 9833363713 💞 Full Night EnjoyCall Girl Number in Vashi Mumbai📲 9833363713 💞 Full Night Enjoy
Call Girl Number in Vashi Mumbai📲 9833363713 💞 Full Night Enjoy
 

Master Quality control for clinical laboratories.pptx

  • 1.
  • 2. Basic and Advanced Full guide BY JULIUS MATERN
  • 3. Learning Path MAJOR SECTIONS ● Introduction to Quality Control. ● Quality control products. ● Selection of Quality Control Material. ● Handling of Quality control Material. ● Basic Statistics for Laboratory Quality Control. ● Calculation and use of QC Statistics. ● Quality Control Design. ● Levy-Jenning Charts . ● Westgard rules.
  • 4. Introduction to Quality control ● Achieving quality in the medical laboratory requires the use of many tools. ● These include procedure manuals, maintenance schedules, calibrations, a quality assurance program, training, continuing education, competency assessments, and quality control materials.
  • 6. Introduction to Quality control ● Quality control : Refers to the statistical procedure used to monitor and evaluate analytical process which is used to produce clients results. ● Monitor analytical phase ensure accuracy , reliable and timely results. ● Quality control involve regular testing of quality control material together with patients samples, and compare quality control results to specific statistical limits(range).
  • 7. ● Accuracy- Degree of closeness between measured value to the true value. ● Laboratory results should be as accurate as possible ● When making measurement there is always some degree of inaccuracy. Our target is to reduce the level of inaccuracy as much as possible
  • 8. Introduction to Quality control ● Accuracy of 99% may be good at some setting but think of that 1% inaccuracy which might cause a huge problem and effect to our clients.
  • 9. Introduction to Quality control ● Quality control product: Is a patient like material ideally made from human serum, urine or spinal fluid. ● Control product can be fluid or freeze- dried(lyophilized),can contain one or more analytes(Multi- Constituents) of known concentration. ● Control product should be tested and treated in the same manner as patient sample.
  • 10. Introduction to Quality control ● Sometimes control product are not human, control product can be animal in origin or commercial prepared from organic matrix. Note: Aim of quality control is to detect error and correct them before patient results are reported.
  • 11. Introduction to Quality control - Good laboratory practice require testing normal and abnormal control for each test at least daily to monitor analytical phase. - Normal control: Contain normal level for analytes being tested. - Abnormal control: Contain analytes at concentration above or below the normal range for analytes being tested.
  • 12. Introduction to Quality control - Regular testing of quality control products create a QC database that a laboratory used to validate the testing system. - Validation occur by comparing the QC result with the laboratory predefined range of QC value. - The lab defined range is calculated from the QC data collected from testing normal and abnormal control.
  • 13. What are result of not practicing Quality control ? - Unnecessary treatment - Failure to provide proper treatment - Delay in correct diagnosis - Laboratory error cost Time, Manpower and Resources
  • 15. Controls ● Substance, material, or article intended by the manufacturer to be used to verify the performance characteristics of an in vitro diagnostic medical device”
  • 16. A quality control product is a patient-like material ideally made from human serum, urine or spinal fluid.
  • 17. Control Material/Control products The key here is that the control material is something we use to verify that the medical device(test) is working correctly
  • 18. Types of Control There are some controls that are internal to the workings of the instrument, particularly highlighted at the point of care. If it’s a control that essentially doesn’t test anything like a patient sample or even a surrogate patient sample, but instead uses some electronic check, this is called Electronic QC This are useful especially for internal checks example when you switch on your Full blood picture machine it will do self check first before allowing you to proceed with other steps.
  • 19. Types of Control - You can't just rely on electronic QC to ensure your testing Quality. -Embedded QC - If the control materials are contained in on-board ampules or cartridges,provided they have similar matrices to patient specimens and follow all steps of the analytical process, those control materials may be used as a substitute for traditional quality control materials
  • 20. Types of Control Tradition QC- This involve the use of third party independent Quality control material that involves the operator using the control material like a patient sample. Even with devices that have Electronic QC or Embedded QC, the traditional steps of running QC should be performed at least periodically. This is termed as gold standard “best practice for Quality control”
  • 21. Control Material ● Important part of Quality control is to identify the proper quality control material. ● The goal of quality control materials in the laboratory is to have products that are used in the same manner as patient samples so that they can help assure that the test systems are functioning appropriately and producing high quality patient results. 15 25 22
  • 22. Control Material ● QC results are used to evaluate whether a test system (including instruments and assay reagents) is operating within pre-defined specifications, inferring that patient test results are reliable. Control material are made from ● Human serum ● Whole blood ● CSF ● Urine and other body fluids
  • 23. Control Material Control can be sometimes categorized into two major parts ● Independent Quality controls ● Dependent Quality controls Dependent Quality controls : Dependent controls are control materials developed and formulated to be run on specific test systems. These may be made by the test system manufacturer (sometimes called “first party controls”) or contracted out to another company (sometimes called “second party controls”).
  • 24. Control Material Independent Quality Control : Are control materials developed without direction or aid from the manufacturer of the test system. This can work on multiple test systems and across any reagent lots. These controls are frequently called “third party controls.” Independent controls may pick up errors that go undetected by dependent control materials.
  • 25. Control Material The use of Independent control material is emphasized by different guidelines including ISO 15189. ISO 15189: “Use of third-party internal quality control material should be considered, either as an alternative to, or in addition to, control material supplied by the reagent or instrument manufacturer.”
  • 26. Control Material Note: In addition of commercial QC there is also inhouse/laboratory made QC material.
  • 27. Forms of Control Material Liquid control ● No reconstitution is required,but are also frozen Lyophilized/freeze- dried) state. ● have good stability and shelf life, but need to be reconstituted prior to use. Deliverable 4 ● Lorem ipsum dolor sit amet ● Sed do eiusmod tempor incididunt ut labore The choice of either liquid or lyophilized control is upon the specific laboratory.
  • 28. cont… Control can have many analytes mixed together (Multi-Constituents) example is chemistry controls. But the choice of how many analytes should be in a given control depends with the need of the specific laboratory.
  • 29. Characteristics of Control Material ● Controls must be appropriate for the targeted diagnostic test ● The amount of the analyte present in the controls should be close to the medical decision points of the test; this means that controls should check both low values and high values. ● Controls should have the same matrix as patient samples
  • 30. Assayed ,Unassayed and In-House Control? ● Assayed: Target value pre-defined by manufacturer. After purchasing assayed control you need to Verify and start using it . ● When using assayed controls the laboratory must verify the value using its own methods. ● Assayed controls are more expensive to purchase than unassayed controls.
  • 31. Assayed ,Unassayed and In-House Control? ● Unassayed: Target value not predefined,it need fully assay before using it ● In-House: In house pooled sera,it need fully assay and validation..
  • 32. SELECTION OF QC MATERIALS
  • 33. cont… Many different Qc material are available for the laboratory. Choosing the right quality control product requires careful consideration. Factors which can be taken into consideration when selecting a best and quality control for your laboratory. ● Open-vial stability
  • 34. cont… ● Shelf-life ● Pricing/Volume ● Matrix ● medically relevant decision levels ● interlaboratory comparison programs and data management. ● Commutability ● Matrix effect
  • 35. Open-Vial stability Open-vial stability refers to the amount of time, after being opened, that the QC remains stable, and analytes do not degrade. When purchasing a quality control product, it is important to know the approximate volume of the control to be used each day to determine the open-vial stability requirements.
  • 36. Open-Vial stability Open vial stability refers to how long after the vial is open the control material is stable and produces optimal results before it deteriorates. ● Again, a longer open vial life will give you more time to utilize it. You don’t want to waste control material because you can’t consume the contents in the vial before its open vial expiration.
  • 37. Open-Vial stability For example, consider a general chemistry control material that can be purchased in 10 mL vials. Laboratories that use 10 mL or more per day would be less concerned with open-vial stability for this product. But for those laboratories that use a lower volume of control (1 mL/day for example), open-vial stability becomes an important issue. Quality control open-vial stability should match or exceed the laboratory’s normal usage rate to avoid waste.
  • 38. Interlaboratory Comparison Programs and Data Management Participation in inter-laboratory quality control comparison program is highly recommended. In such programs,laboratories anonymously submit QC results for different assay/platform combinations. This allows participating laboratories to compare their QC results with peer labs using the same test systems.
  • 39. Interlaboratory Comparison Programs and Data Management One of the easiest methods to assess trueness and imprecision is to compare the within-laboratory method means and standard deviations with other laboratories (peer group) using the same instrument and method.
  • 40. Shelf life Shelf life in this context refers to the expiration date of the unopened product. A long shelf life provides the ability to measure performance over a long time, including reagent and calibrator lot changes
  • 41. Pricing/Volume It is recommended to have an idea of the cost of the quality control product per mL and use this information when comparing QC materials.
  • 42. Matrix ● The matrix of a control is all the extra stabilizers, preservatives, and other ingredients present to support the analyte itself but are wholly unrelated to a patient sample. ● These additives may help keep the control material stable, or have a longer shelf life, but they do not make the control behave as a patient sample. ● As much as possible, labs need to avoid controls with heavily artificial matrices and need to have controls that are as commutable as possible
  • 43. Matrix The primary purpose of a control material is to evaluate a testing procedures ability to perform as expected and to confirm that the patient test results are suitable for use in providing medical care. When choosing a quality control material, it is important to choose a product that matches the matrix of the patient sample as closely as possible. The matrix is the substance that contains the measuring analytes. If a chemistry analyzer tests glucose on both serum and urine samples,QC material for each of these matrices should be used.
  • 44. Commutability ● Commutability is the ideal goal of any type of control. That is, the control material mimics as closely as possible a real patient sample. The opposite of commutability is often referred to as a Matrix Effect
  • 45. Medically Relevant Decision Levels It is important that the analyte concentration of quality control materials be at clinically relevant levels.
  • 46. Other factor to consider Qc technical and educational support from vendor/manufacturer. Another important evaluation to consider is checking whether the manufacturer has ISO (or other) certifications to indicate consistency in the observance of quality standards.
  • 47. HANDLING OF QC MATERIAL
  • 48. Processing steps Control materials are tested along with patient samples and should undergo all pre-treatments (if any) just like a patient sample. For example, if a patient sample goes through an extraction process, the control material should also go through the same process as well, if possible
  • 49. Product Inserts Product inserts for control materials provide a variety of important information. Printed paper inserts may be shipped with the product, but most manufacturers today have moved product inserts to an online, digital format. Product inserts are used to publish claims associated with each lot number of the control material. Claims typically include: ■ The stability for specific analytes after reconstitution or thaw ■ The expiration date (shelf life)
  • 50. Product Inserts ■ The stability for specific analytes after reconstitution or thaw ■ The open-vial stability of the product ■ Instructions for reconstitution ■ For quantitative products, an estimate of the mean for each analyte along with a range of acceptable means if it is an assayed control.
  • 51. Levels Many guidelines recommend running two levels of control for each day of patient testing. It's common to run a normal and abnormal level (or positive/negative for qualitative tests). Some laboratories may for some tests routinely test an abnormal low control and an abnormal high control, assuming that if the low and high controls are in control then the normal range will be in control as well.
  • 52. Storage and Handling The quality control product IFU will also contain information regarding appropriate storage and handling procedures. Before a laboratory decides to aliquot and freeze quality control material, the product insert should be reviewed to ensure the manufacturer states that this is acceptable.
  • 53. Training The use and handling of QC materials is an important activity that has a direct impact on the analytical performance of the laboratory. Continuing education is an important part of maintaining laboratory quality. A good QC provider can be a source of education and training on QC theory and good lab practices.
  • 54. BASIC STATISTICS IN LABORATORY QUALITYCONTROL
  • 55.
  • 56. cont… ● One important part of quality control in the medical laboratory is the statistical process used to monitor and evaluate the analytical process that produces patient results. ● Quality control data are produced in the same manner as patient sample. ● When the test is perfomed in the laboratory the outcome of the test is the result ,either patient results or quality control results. ● The result may be quantitative (i.e., a number) or qualitative(e.g., positive or negative) or semi-quantitative (e.g., +1, +2, +3, +4)1.
  • 57. cont… ● QC results are used to evaluate whether the instrument is operating within pre-defined specifications. ● Once the test system is evaluated, patient results can then be used to support diagnosis,prognosis, or treatment planning.
  • 58. scenario.. ● Let’s assume the measured value of potassium in a patient’s serum is 2.8 mmol/L (a unit of measure, millimoles per liter). ● This result is abnormally low and indicates an inappropriate loss of potassium. But how does the person performing the test know that this result is truly reliable? It could be possible that the instrument is out of calibration and the patient’s true potassium value is 4.2 mmol/L – a normal result. The question of reliability for most testing can be resolved by regular use of quality control materials and statistical process control
  • 59. Table 1 (Test-Potassium) Range Level I(3.7-4.3 mmol/L) Level II(6.7-7.3 mmol/L) Patient Result Oct 1 4.0 7.0 4.2,4.0,5.8,4.2,3.8 Oct 2 4.1 7.0 3.8,4.4,4.6,3.9,4.8 Oct 3 4.0 6.9 4.4,3.9,3.7,4.7 Oct 4 4.2 7.1 4.7,5.6,3.7,4.7 Oct 5 4.1 7.0 4.2,4.3,4.4.1,4.3 Oct 6 4.1 7.0 4.6,4.4,5.5,3.2 Oct 7 4.2 8.0 2.8,3.9,6.0,4.3
  • 60. Table 1 In Table 1, there are two ranges listed. The acceptable range for level 1 is 3.7 – 4.3 mmol/L. The range for level 2 is 6.7 – 7.3 mmol/L. When the daily QC result obtained for the level 1 control is compared to the range calculated for the level 1 control,it becomes apparent that each result lies somewhere within the expected range. This indicates that the analytical process is “in control” at the normal level on that day of testing
  • 61. Table 1 ● When the daily QC result for the level 2 control (high potassium) is compared to the defined range for the level 2 control,the analytical process is shown to be “in control” for each day of testing except for the last day (Oct 7). ● On Oct 1 through Oct 6, both controls were “in control” and patient values could be reliably reported. However, the laboratory was “out of control” for abnormal high potassiums on Oct 7 because the value obtained for the QC material (8.0 mmol/L) was outside the acceptable range (6.7 – 7.3 mmol/L).
  • 62. Table 1 ● This means that an error occurred which made the patient results unreliable. The laboratory should not report the test results from any patient samples until the error is resolved and the samples are re- tested.
  • 63. Calculation and use of QC Statistics
  • 64. QC Statistics ● QC statistics for each test performed in the laboratory are calculated from the QC data collected by regular testing of control products. ● The data collected is specific for each level and lot number of control. ● Also the statistics and ranges calculated from this data are also specific for each level and lot number of control.
  • 65. Calculating Mean ● The mean (or average) is the laboratory’s best estimate of the analyte’s true value for a specific level of control. ● This is one of the most fundamental calculation for the quality control. ● Simply put, take the sum of all the control values for that level, then divide by the number of measurements.
  • 66. Calculating Mean X - each value in the data set Σ= Sum N= The number of values in the data set
  • 67. Calculating Mean To calculate a mean for a specific level of control, first, add all the values collected for that control. Then divide the sum of these values by the total number of values. Example let us calculate the mean value for the level 1 control in the Table 1 - All values (4,4.1,4.0,4.2,4.1,4.1,4.2) - Total number of values (7) - Sum of all values(28.7)
  • 68. Calculating Mean - Then - Mean = 28.7/7 = 4.1 mmol/L Therefore, the mean for the Level 1 potassium control in Table 1 from Oct 1-7 is 4.1 mmol/L If you have an assayed control, you can compare your calculation to that assayed (the target value or expected value) mean
  • 69. Calculating Standard Deviation(SD) Standard deviation is a statistic that quantifies how close numerical values (i.e., QC values) are in relation to each other. Imprecision is used to express how far apart numerical values are from each other. It provides the laboratory an estimate of test consistency at specific concentrations. The repeatability of a test may be consistent (low standard deviation, low imprecision) or inconsistent (high standard deviation, high imprecision).
  • 70. Calculating Standard Deviation(SD) ● Inconsistent repeatability may be due to the chemistry involved or to a malfunction. ● It is desirable to get repeated measurements of the same specimen as close as possible. Good precision is especially needed for tests that are repeated regularly on the same patient to track treatment or disease progress. Standard deviation may also be used to monitor on-going day-to-day
  • 71. Calculating Standard Deviation(SD) For instance, if during the next week of testing, the standard deviation calculated in the example for the normal potassium control increases from 0.08 to 0.16 mmol/L, this indicates a serious loss of precision. This instability may be due to various factors and you should ask yourself few questions ● Has the reagent lot changed? ● Has maintenance performed ? ● Are reagent and sample pipetted correctly?
  • 72. Calculating Standard Deviation(SD) ● Was new operatory added recently? ● Has calibration being perfomed recently? FORMULA Although many software calculate SD but it is good to know SD = √∑(xi−x ̄ )2 /n)
  • 73. Calculating Standard Deviation(SD) SD = standard deviation x = mean (average) of the QC values Σ(xn - x)2 = the sum of the squares of differences between individual QC values and the mean n = the number of values in the data set
  • 74. Calculating Standard Deviation(SD) From Table 1 Now we have mean lets calculate SD Mean = 4.1 mmol/L Our Control data = (4,4.1,4.0,4.2,4.1,4.1,4.2)
  • 75. Calculating Standard Deviation(SD) Subtract the mean (4.1) from each data point and square the result: (4 - 4.1)² = 0.01 (4.1 - 4.1)² = 0 (4.0 - 4.1)² = 0.01 (4.2 - 4.1)² = 0.01 (4.1 - 4.1)² = 0 (4.1 - 4.1)² = 0 (4.2 - 4.1)² = 0.01 Sum up these squared differences: 0.01 + 0 + 0.01 + 0.01 + 0 + 0 + 0.01 = 0.04
  • 76. Calculating Standard Deviation(SD) ● Divide the sum by the total number of data points (N), which is 7 in this case: 0.04 / 7 = 0.00571428571 (approximately) ● Finally, take the square root of this result to get the standard deviation: σ ≈ √0.00571428571 ≈ 0.0756 (rounded to four decimal places) ● So, the standard deviation of the given data set with a mean of 4.1 is approximately 0.0756.≈ 0.1
  • 77. Calculating Standard Deviation(SD) ● NB: The smaller the SD, the better the precision. The larger the SD, the worse the imprecision
  • 78. Coefficient of Variation [CV] The Coefficient of Variation [CV] is the ratio of the standard deviation to the mean and is expressed as a percentage. ● The CV allows the laboratory professional to make easier comparisons of the overall precision. ● Since standard deviation typically increases as the concentration of the analyte increases, the CV can be regarded as a statistical equalizer. FORMULA: CV = (SD / MEAN) X 100%
  • 79. Coefficient of Variation [CV]-Scenario ● For example, a comparison between hexokinase and glucose oxidase (two methods for assaying glucose) is required ● The standard deviation for the hexokinase method is 4.8 and it is 4.0 for glucose oxidase ● If the comparison only uses standard deviation, it can be incorrectly assumed that the glucose oxidase method is more precise than the hexokinase method. If, however, a CV is calculated, it might show that both methods are equally precise
  • 80. Coefficient of Variation [CV]-Scenario Assume the mean for the hexokinase method is 120 and the glucose oxidase mean is 100. The CV then, for both methods, is 4%. They are equally precise Hope you get hexokinase =4.8/120 x 100% = 4% Then oxidase = 4/100 x 100% = 4% ● NB The Coefficient of Variation can also be used when comparing instrument performance.
  • 81. Coefficient of Variation [CV]-Scenario ● The CV allows you to look at imprecision across multiple control levels, even compare imprecision between methods and instruments, and compare them against the manufacturer’s expectations. ● Many accrediting organizations have requirements that the CV must be monitored monthly for all quantitative assays.
  • 82. Coefficient of Variation [CV]-Scenario ● The lower the CV, the lower the test system’s imprecision
  • 84. How to set ranges? ● You have an absolutely new control – no previous lots, no previous data, nothing cumulative from the past. ● Today is the first day you’re running it. How do you set up your ranges? ● [By ranges, we are referring to the mean, SD, and the Levey-Jennings chart, by the way.
  • 85. How to set ranges? ❖ The best practice is to establish your own mean and SD over a period of 20 days for each level of control. Clearly, that means during the first 20 days of your new control, you’re waiting for the mean and SD, but what are you going to use in the meantime? ❖ This is where the package insert range is most valuable ❖ If you have an assayed control, there is a data sheet supplied, either in digital format or on old-fashioned paper, providing expected or target means as well as standard deviations.
  • 86. How to set ranges? ❖ If you have absolutely no other information, start by setting up your mean and SD with the information from this package insert. ❖ [Fun fact: The mean and SD in the package insert are commonly determined by running the control on a number of instruments or by sending the control out to a select group of laboratories to run on their variety of instruments.
  • 87. How to set ranges? ❖ Since it comprises multiple instruments, even multiple labs, the SD will be larger, possibly MUCH larger,than any individual laboratory’s SD. ❖ Therefore, it is important to switch to your own SD as soon as possible after you have derived it from the data you have captured ❖ The longer you use the package insert SD, the longer you are at risk of having your control limits too wide and missing significant errors. Okay, that’s not so fun.]
  • 88. How to set ranges? ❖ Since it comprises multiple instruments, even multiple labs, the SD will be larger, possibly MUCH larger,than any individual laboratory’s SD. ❖ Therefore, it is important to switch to your own SD as soon as possible after you have derived it from the data you have captured ❖ The longer you use the package insert SD, the longer you are at risk of having your control limits too wide and missing significant errors.
  • 89. How to set ranges? ❖ So, once you have more complete data representing your control material’s performance on your method on your instrument in your labs, start using that information. What if you want tighter ranges than offered in the package insert but you, don’t have 20 days to collect data? you can consider running multiple controls over a shorter number of days: run four control runs per day for five days.
  • 90. How to set ranges? If you have a really short shelf-life control – this often happens with hematology control material you may need to work with even shorter crossover intervals. HOW? ● Establish a new mean for the new control with 8-10 values run over a few days. This is statistically sound – you can establish a new mean with as few as eight values.
  • 91. How to set ranges? ● Pair up the new mean with the old CV, and then calculate new mean x old CV = temporary SD ● As soon as you have enough data (about 20 measurements), calculate the new SD. ● Continue to update the SD when you have the next month of data, and the next, until the expiration of the control
  • 92. How to set ranges? ➢ NOTE: Many labs believe that if the shelf life of a control is very short, they do not need to perform cross-over studies. Do not fall into that trap! You are required by regulation to establish ranges on all lot numbers prior to use. This is not only a good lab practice, it’s essential risk management
  • 93. switching to a new lot of QC ➢ If you are starting a new control lot of a control material you’ve used recently, and you have experience with and historical data for the previous lot, you can consider using that historical mean and SD as a bridge to the new lot. ➢ Assuming these lots are manufactured with the goal of producing nearly identical performance, you can use the historical mean and SD until you have enough data to calculate the new mean and new SD.
  • 94. switching to a new lot of QC ➢ If you are starting a new control lot of a control material you’ve used recently, and you have experience with and historical data for the previous lot, you can consider using that historical mean and SD as a bridge to the new lot. You can use that data until you have your enough data to have your own SD and Mean.
  • 95. What if your range doesnt match package insert range? ➢ Remember the range on your package insert is meant to be a guide. ➢ Your mean should fall within the package insert range, but the range of values represented by the SD and mean is not required to fall within the package insert range. NB: If your mean is not within the package insert range, you should examine your method, confirm that you stored and processed the control correctly.
  • 96. Levey-Jennings Charts & Westgard Rules
  • 97. LJ CHART ● The Levey-Jennings chart is used to graph successive (run-to-run or day-to-day) quality control values. ● This type of control chart on which individual values or single values are plotted directly on the graph. ● Levey and Jennings introduced statistical process control to medical laboratories
  • 98. LJ CHART ● Once you have Levey-Jennings charts, you can begin plotting data, run by run, level by level, and deciding what points constitute acceptable, “in-control” behavior, and what points represent unacceptable, “out-of- control” behavior
  • 99. LJ CHART The green line is the mean(average)
  • 100. LJ CHART ● Standard deviation is commonly used for preparing Levey-Jennings (L- J or LJ) charts. ● The first step is to calculate decision limits. ● These limits are ±1s, ±2s and ±3s from the mean. From TABLE I mean= 4.1 mmol/L Standard deviation = 0.1mmol/L Then lets calculate these limits (±1s, ±2s and ±3s)
  • 101. LJ CHART -Decision Limits ±1s Mean - SD(1)= 4.1 - 0.1(1)= 4.0 Mean + SD(1)= 4.1 + 0.1(1) = 4.2 : ±1s range is 4.0 to 4.2 mmol/L
  • 102. LJ CHART -Decision Limits ±2s Mean - SD(2)= 4.1 - 0.1(2)= 3.9 Mean + SD(1)= 4.1 + 0.1(2) = 4.3 : ±1s range is 3.9 to 4.3 mmol/L
  • 103. LJ CHART -Decision Limits ±3s Mean - SD(3)= 4.1 - 0.1(3)= 3.8 Mean + SD(3)= 4.1 + 0.1(3) = 4.4 : ±1s range is 3.8 to 4.4 mmol/L
  • 105. LJ CHART ● When an analytical process is within control, approximately 68% of all QC values fall within ±1 standard deviation (1s). ● Likewise 95.5% of all QC values fall within ±2 standard deviations (2s) of the mean.
  • 106. LJ CHART ● About 4.5% of all data will be outside the ±2s limits when the analytical process is in control. ● Approximately 99.7% of all QC values are found to be within ±3 standard deviations (3s) of the mean.
  • 107. Note ● Some laboratories consider any quality control value outside its ±2s limits to be out of control. ● They incorrectly decide that the patient specimens and QC values are invalid. ❖ An analytical run should not be rejected if a single quality control value is outside the ±2s QC limits but within the ±3s QC limits
  • 108. Note ❖ Laboratories that use a ±2s limit frequently reject good runs. That means patient samples are repeated unnecessarily, labor and materials are wasted, and patient results are unnecessarily delayed.
  • 109. Use Levey Jenning Chart to Evaluate Quality ❖ The laboratory needs to document that quality control materials are assayed and that the quality control results have been inspected to assure the quality of the analytical run. ❖ This documentation is accomplished by maintaining a QC Log and using the Levey- Jennings chart on a regular basis.
  • 110. Use Levey Jenning Chart to Evaluate Quality ❖ The QC Log can be maintained on a computer or on paper,The log should identify ● The name of test ● The instrument and units ● Results of each level of control assayed ● Date test performed ● Initial of person perfoming test ● Level of the assayed control(normal
  • 111. Systematic Error ● Systematic error is evidenced by a change in the mean of the control values. ● The change in the mean may be gradual and demonstrated as a trend in control values or it may be abrupt and demonstrated as a shift in control values.
  • 112. TREND ● A trend indicates a gradual loss of reliability in the test system. Causes ● Deterioration of the instrument light source ● Gradual deterioration of calibration ● Deterioration of Control ● Aging of reagents
  • 113. SHIFT ● Abrupt changes in the control mean. Shifts may be caused by: ● Change of reagent lot ● Major instrument maintenance. ● Suddenly change in incubation temperature. ● Failure in sampling system
  • 115. RANDOM ERROR ● Technically, random error is any deviation away from an expected result.
  • 117. Westgard Rules ● There are six basic rules in the Westgard scheme. These rules are used individually or in combination to evaluate the quality of analytical runs.
  • 118. 12s ● This is referred to Warning rule ● This means that the “violation” of this warning only triggers careful inspection of the control data. ● This is a warning rule that is violated when a single control observation is outside the ±2s limits
  • 119. 12s ● This rule merely warns that random error or systematic error may be present in the test system. ● Patient results can be reported
  • 120. 12s
  • 121. 13s ★ Any QC result outside ±3s violates this rule ★ A run is rejected when a single control measurement exceeds the mean +3s or the mean –3s control limit.
  • 122. 13s
  • 123. 22s This rule identifies systematic error only. The criteria for violation of this rule are: •Two consecutive QC results •Greater than 2s •On the same side of the mean
  • 124. 22s There are two applications to this rule: ● Within run and ● Across run
  • 125. 22s- Within Run ● For example, if a normal (Level I) and abnormal (Level II) control are assayed in this run and both levels of control are greater than 2s on the same side of the mean, this run violates the within-run
  • 126. 22s- Across Run ● Example level I in run I was outside 2s and again level I in the second run is outside 2s.
  • 127.
  • 128. R4s ● This rule only applied within the current run.There must be at least difference of 4s. ● example, assume both Level I and Level II have been assayed within the current run.
  • 129. R4s ● Level I is +2.8s above the mean and Level II is - 1.3s below the mean. The total difference between the two control levels is greater than 4s. (e.g. [+2.8s – (-1.3s)] = 4.1s).
  • 130. R4s
  • 131. 31s The criteria which must be met to violate this rule are: ● Three consecutive results ● Greater than 1s ● On the same side of the mean
  • 132. 41s The criteria which must be met to violate this rule are: ● Four consecutive results ● Greater than 1s ● On the same side of the mean
  • 133. 41s
  • 134. 7x 8x 9x 10x 12x ● These rules are violated when there are: 7 or 8, or 9, or 10, or 12 control results. ● On the same side of the mean regardless of the specific standard deviation in which they are located.
  • 136. Reminder* ● Controls are tested at the same time and in the same way as patient samples. Purpose of control is to: ● Validate the reliability of the test system. ● To evaluate operator’s performance ● Evaluate Environment conditions that might impact the result.
  • 137. Differentiate Control and Calibrator ● It is important not to confuse between calibrator and control materials. Calibrators are solutions with a specified defined concentration that are used to set or calibrate an instrument, kit, or system before testing is begun. ● Calibrators are often provided by the manufacturer of an instrument.
  • 138. Differentiate Control and Calibrator ● They should not be used as controls since they are used to set the instrument. ● Calibrators are sometimes called standards, but the term calibrator is preferred. They usually do not have the same consistency(commutability) as patients’ samples.
  • 139. BY JULIUS MATERN Medical laboratory scientist Visit Our Website: clinicallabgurus.com