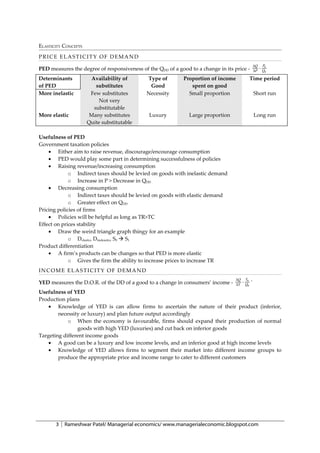
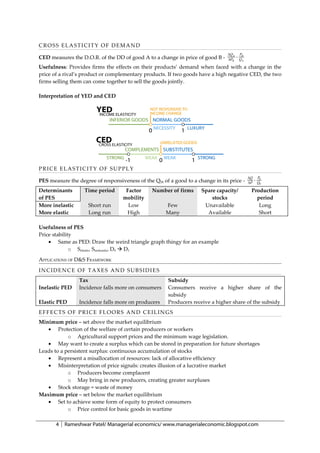
The document discusses key concepts in market systems including the production possibility curve, productive efficiency, allocative efficiency, and distributive efficiency. It then covers factors that influence market demand and supply such as income, population, tastes/preferences, and costs of production. Elasticity concepts like price elasticity of demand and supply are also defined. Applications of demand and supply frameworks like the incidence of taxes and subsidies and effects of price floors and ceilings are summarized.
> Resources: DepEd SHS curriculum guide and Rex Book AE
> This helping material comes with a worksheet on a separate document. Message me for any questions. Hope this helps!
Applied Economics: Application of Demand and Supply (Chapter 2.1)
- The Market
- Demand
- The Law of Demand
- Non-Price Determinants of Demand
- Shifts of Demand Curve
- Supply
- The Law of Supply
- Non-Price Determinants of Supply
- Shits of Supply Curve
Demand and Supply Analysis (Economics) Lecture NotesFellowBuddy.com
FellowBuddy.com is an innovative platform that brings students together to share notes, exam papers, study guides, project reports and presentation for upcoming exams.
We connect Students who have an understanding of course material with Students who need help.
Benefits:-
# Students can catch up on notes they missed because of an absence.
# Underachievers can find peer developed notes that break down lecture and study material in a way that they can understand
# Students can earn better grades, save time and study effectively
Our Vision & Mission – Simplifying Students Life
Our Belief – “The great breakthrough in your life comes when you realize it, that you can learn anything you need to learn; to accomplish any goal that you have set for yourself. This means there are no limits on what you can be, have or do.”
Like Us - https://www.facebook.com/FellowBuddycom
Microeconomics mainly deals with an individual’s behavior and decisions that affect the demand and supply of goods and services. www.unitedworld.edu.in
There are simply some things that all marketers must do during a downturn. In this section we’ll cover the essentials of how to think about pricing, discounting and coupon strategies on a downturn along with some essential discussion on budgets and marketing spending. We’ll review case examples of what leading marketers from all industries have done in recessions and learn from their results.
Encryption in Microsoft 365 - ExpertsLive Netherlands 2024Albert Hoitingh
In this session I delve into the encryption technology used in Microsoft 365 and Microsoft Purview. Including the concepts of Customer Key and Double Key Encryption.
Builder.ai Founder Sachin Dev Duggal's Strategic Approach to Create an Innova...Ramesh Iyer
In today's fast-changing business world, Companies that adapt and embrace new ideas often need help to keep up with the competition. However, fostering a culture of innovation takes much work. It takes vision, leadership and willingness to take risks in the right proportion. Sachin Dev Duggal, co-founder of Builder.ai, has perfected the art of this balance, creating a company culture where creativity and growth are nurtured at each stage.
Elevating Tactical DDD Patterns Through Object CalisthenicsDorra BARTAGUIZ
After immersing yourself in the blue book and its red counterpart, attending DDD-focused conferences, and applying tactical patterns, you're left with a crucial question: How do I ensure my design is effective? Tactical patterns within Domain-Driven Design (DDD) serve as guiding principles for creating clear and manageable domain models. However, achieving success with these patterns requires additional guidance. Interestingly, we've observed that a set of constraints initially designed for training purposes remarkably aligns with effective pattern implementation, offering a more ‘mechanical’ approach. Let's explore together how Object Calisthenics can elevate the design of your tactical DDD patterns, offering concrete help for those venturing into DDD for the first time!
GraphRAG is All You need? LLM & Knowledge GraphGuy Korland
Guy Korland, CEO and Co-founder of FalkorDB, will review two articles on the integration of language models with knowledge graphs.
1. Unifying Large Language Models and Knowledge Graphs: A Roadmap.
https://arxiv.org/abs/2306.08302
2. Microsoft Research's GraphRAG paper and a review paper on various uses of knowledge graphs:
https://www.microsoft.com/en-us/research/blog/graphrag-unlocking-llm-discovery-on-narrative-private-data/
State of ICS and IoT Cyber Threat Landscape Report 2024 previewPrayukth K V
The IoT and OT threat landscape report has been prepared by the Threat Research Team at Sectrio using data from Sectrio, cyber threat intelligence farming facilities spread across over 85 cities around the world. In addition, Sectrio also runs AI-based advanced threat and payload engagement facilities that serve as sinks to attract and engage sophisticated threat actors, and newer malware including new variants and latent threats that are at an earlier stage of development.
The latest edition of the OT/ICS and IoT security Threat Landscape Report 2024 also covers:
State of global ICS asset and network exposure
Sectoral targets and attacks as well as the cost of ransom
Global APT activity, AI usage, actor and tactic profiles, and implications
Rise in volumes of AI-powered cyberattacks
Major cyber events in 2024
Malware and malicious payload trends
Cyberattack types and targets
Vulnerability exploit attempts on CVEs
Attacks on counties – USA
Expansion of bot farms – how, where, and why
In-depth analysis of the cyber threat landscape across North America, South America, Europe, APAC, and the Middle East
Why are attacks on smart factories rising?
Cyber risk predictions
Axis of attacks – Europe
Systemic attacks in the Middle East
Download the full report from here:
https://sectrio.com/resources/ot-threat-landscape-reports/sectrio-releases-ot-ics-and-iot-security-threat-landscape-report-2024/
SAP Sapphire 2024 - ASUG301 building better apps with SAP Fiori.pdfPeter Spielvogel
Building better applications for business users with SAP Fiori.
• What is SAP Fiori and why it matters to you
• How a better user experience drives measurable business benefits
• How to get started with SAP Fiori today
• How SAP Fiori elements accelerates application development
• How SAP Build Code includes SAP Fiori tools and other generative artificial intelligence capabilities
• How SAP Fiori paves the way for using AI in SAP apps
The Art of the Pitch: WordPress Relationships and SalesLaura Byrne
Clients don’t know what they don’t know. What web solutions are right for them? How does WordPress come into the picture? How do you make sure you understand scope and timeline? What do you do if sometime changes?
All these questions and more will be explored as we talk about matching clients’ needs with what your agency offers without pulling teeth or pulling your hair out. Practical tips, and strategies for successful relationship building that leads to closing the deal.
UiPath Test Automation using UiPath Test Suite series, part 3DianaGray10
Welcome to UiPath Test Automation using UiPath Test Suite series part 3. In this session, we will cover desktop automation along with UI automation.
Topics covered:
UI automation Introduction,
UI automation Sample
Desktop automation flow
Pradeep Chinnala, Senior Consultant Automation Developer @WonderBotz and UiPath MVP
Deepak Rai, Automation Practice Lead, Boundaryless Group and UiPath MVP
DevOps and Testing slides at DASA ConnectKari Kakkonen
My and Rik Marselis slides at 30.5.2024 DASA Connect conference. We discuss about what is testing, then what is agile testing and finally what is Testing in DevOps. Finally we had lovely workshop with the participants trying to find out different ways to think about quality and testing in different parts of the DevOps infinity loop.
Accelerate your Kubernetes clusters with Varnish CachingThijs Feryn
A presentation about the usage and availability of Varnish on Kubernetes. This talk explores the capabilities of Varnish caching and shows how to use the Varnish Helm chart to deploy it to Kubernetes.
This presentation was delivered at K8SUG Singapore. See https://feryn.eu/presentations/accelerate-your-kubernetes-clusters-with-varnish-caching-k8sug-singapore-28-2024 for more details.
Accelerate your Kubernetes clusters with Varnish Caching
Market Managerial Economics
1. MARKET SYSTEMS,
The Production Possibility Curve is the graph that shows maximum attainable combinations of two
goods or services that can be produced in an economy when all resources are used fully and
efficiently, at a given state of technology
Productive Efficiency refers to the absence of waste in the production process. (How to produce)
All points on the PPC are productive efficient
Points inside the PPC are inefficient
o Unemployment – not all available resources are used in the production process
o Underemployment – resources are not engaged fully in the production process
Allocative Efficiency is the situation in which society consumes a combination of goods and services
that maximizes its welfare (What to produce)
• Maximum utility: only one point on the PPC is allocative efficient
o Where the slope of the PPC is tangential to the slow of the indifference curve
Distributive Efficiency is achieved when goods and services are produced to those who want or
need them – not affected by an economy’s position on the PPC (For whom to produce)
SUPPLY AND DEMAND FRAMEWORKS
FACTORS INFLUENCING MARKET DEMAND
Population Affects the number of potential customers – the size of the market
• An absolute increase or decrease in total population,
o Immigration or emigration
• A change in composition of the population,
o Changes in age distribution: baby boom or ageing population
Interrelated goods Change in prices of substitutes or complements
Taste & Fads may lead to sudden and temporary increases or decreases in demand
Preferences New inventions and technology may lead to a permanent decreases in demand
Seasonal changes Climatic conditions, or festivities/holidays may lead to increases in demand for
particular goods like flowers on Valentines day
Expectations of the Changes as a result of expectations of future price changes
future
Income (Y) An increase in income leads to an increase in spending on luxury goods, and a
decrease in demand for inferior goods
FACTORS INFLUENCING MARKET SUPPLY
Costs Changes in costs of production due to changes in prices of factor inputs like
RMs, fuel and power will cause the supply curve to shift
Related products, Affected depending on whether the good is in joint or competitive supply with
prices of other products
Innovations Improvements in techniques of production will lower production costs and shift
the supply curve rightward
Natural factors Favourable climatic conditions lead to increase in supply, while natural
catastrophes will decrease the supply of agricultural produce
Government Taxation and subsidy policies affect the cost of production
policies • Subsidies decrease the minimum price at which producers will supply
• Taxes, on the other hand, increase the minimum price
Expectations of the Changes as a result of expectations of future price changes
future
1 Rameshwar Patel/ Managerial economics/ www.managerialeconomic.blogspot.com
2. INTERRELATED DEMAND INTERRELATED SUPPLY
Goods in joint demands are complements Goods in joint supply are produced together
E.g. petrol and cars E.g. milk and leather
Goods in competitive demand are substitutes Goods in competitive supply are produced at the
E.g. beer and ale expense of each other
Derived demand refers to the demand of a factor E.g. milk and leather
of production for a good
E.g. steel for cars
2 Rameshwar Patel/ Managerial economics/ www.managerialeconomic.blogspot.com
3. ELASTICITY CONCEPTS
PRICE ELASTICITY OF DEMAND
∆Q P
PED measures the degree of responsiveness of the QDD of a good to a change in its price - ∆P ⋅ Q00
Determinants Availability of Type of Proportion of income Time period
of PED substitutes Good spent on good
More inelastic Few substitutes Necessity Small proportion Short run
Not very
substitutable
More elastic Many substitutes Luxury Large proportion Long run
Quite substitutable
Usefulness of PED
Government taxation policies
• Either aim to raise revenue, discourage/encourage consumption
• PED would play some part in determining successfulness of policies
• Raising revenue/increasing consumption
o Indirect taxes should be levied on goods with inelastic demand
o Increase in P > Decrease in QDD
• Decreasing consumption
o Indirect taxes should be levied on goods with elastic demand
o Greater effect on QDD
Pricing policies of firms
• Policies will be helpful as long as TR>TC
Effect on prices stability
• Draw the weird triangle graph thingy for an example
o Delastic, Dineleastic, S0 S1
Product differentiation
• A firm’s products can be changes so that PED is more elastic
o Gives the firm the ability to increase prices to increase TR
INCOME ELASTICITY OF DEMAND
∆Q Y
YED measures the D.O.R. of the DD of a good to a change in consumers’ income - ∆Y ⋅ Q00 '
Usefulness of YED
Production plans
• Knowledge of YED is can allow firms to ascertain the nature of their product (inferior,
necessity or luxury) and plan future output accordingly
o When the economy is favourable, firms should expand their production of normal
goods with high YED (luxuries) and cut back on inferior goods
Targeting different income goods
• A good can be a luxury and low income levels, and an inferior good at high income levels
• Knowledge of YED allows firms to segment their market into different income groups to
produce the appropriate price and income range to cater to different customers
3 Rameshwar Patel/ Managerial economics/ www.managerialeconomic.blogspot.com
4. CROSS ELASTICITY OF DEMAND
∆Q A
CED measures the D.O.R. of the DD of good A to a change in price of good B - ∆PB ⋅ QBA
P
Usefulness: Provides firms the effects on their products’ demand when faced with a change in the
price of a rival’s product or complementary products. If two goods have a high negative CED, the two
firms selling them can come together to sell the goods jointly.
Interpretation of YED and CED
PRICE ELASTICITY OF SUPPLY
∆Q P
PES measure the degree of responsiveness of the QSS of a good to a change in its price - ∆P ⋅ Q00
Determinants Time period Factor Number of firms Spare capacity/ Production
of PES mobility stocks period
More inelastic Short run Low Few Unavailable Long
More elastic Long run High Many Available Short
Usefulness of PES
Price stability
• Same as PED: Draw the weird triangle graph thingy for an example
o Selastic, Sineleastic, D0 D1
APPLICATIONS OF D&S FRAMEWORK
INCIDENCE OF TAXES AND SUBSIDIES
Tax Subsidy
Inelastic PED Incidence falls more on consumers Consumers receive a higher share of the
subsidy
Elastic PED Incidence falls more on producers Producers receive a higher share of the subsidy
EFFECTS OF PRICE FLOORS AND CEILINGS
Minimum price – set above the market equilibrium
• Protection of the welfare of certain producers or workers
o Agricultural support prices and the minimum wage legislation.
• May want to create a surplus which can be stored in preparation for future shortages
Leads to a persistent surplus: continuous accumulation of stocks
• Represent a misallocation of resources: lack of allocative efficiency
• Misinterpretation of price signals: creates illusion of a lucrative market
o Producers become complacent
o May bring in new producers, creating greater surpluses
• Stock storage = waste of money
Maximum price – set below the market equilibrium
• Set to achieve some form of equity to protect consumers
o Price control for basic goods in wartime
4 Rameshwar Patel/ Managerial economics/ www.managerialeconomic.blogspot.com
5. o Rent control
Resultant shortages create problems
• Also represents a misallocation of resources: lack of allocative efficiency
• Prices no long serve as signals to distribute scarce resources
o Alternative allocative mechanisms: balloting, rationing
• Emergence of the black market
5 Rameshwar Patel/ Managerial economics/ www.managerialeconomic.blogspot.com
6. FIRMS & HOW THEY OPERATE
The production function is the relationship between output and factor inputs
The short run refers to period of time over which at least one FOP is fixed
• The following assumptions are made during the SR
o TP = f(labour, capital) only
o Labour is the variable FOP and is considered homogenous
o Capital is the fixed FOP and technology is held constant
The Law of Diminishing Marginal Returns states that as more units of variable factors are applied to
a given quantity of a fixed factor, there comes a point beyond which each additional unit variable
factor adds less to the total output than the previous variable factor.
SHORT RUN COST CURVES
6 Rameshwar Patel/ Managerial economics/ www.managerialeconomic.blogspot.com
7. OBJECTIVES OF THE FIRM
Explicit costs are payments made to outside suppliers of inputs
Implicit costs are costs which do not involve a direct payment to a third party
Accounting cost is the monetary value of the explicit costs of production
Economic cost is the total monetary value of explicit and implicit costs of production
Revenue The firm knows its demand curve, and whether its elastic or otherwise
• The firm will choose a level of output that maximizes profits
o The level of output affects both costs and production, and hence revenue as well
Total revenue = Price × Quantity
Average revenue = Price = Demand
Marginal revenue is the change in the firms total revenue resulting from a change in its sale by one
unite
• The shape of the MR curve reflects the shape of a firm’s DD curve
• The MR curve is always below a firm’s DD curve
Profit Maximization
Normal Profits Accounting Profit = Implicit Cost Zero economic profit
Supernormal Profits Accounting Profit > Implicit Costs Positive economic profit
Subnormal Profits Accounting Profit < Implicit Costs Negative economic profit
…and if you really don’t know anything at all,
PROFIT MAXIMISATION at MR=MC
COSTS IN THE LONG RUN
Increasing returns to scale take place when output increase more than proportionately to the increase
in inputs (technical economies of scale)
Constant returns to scale take place when output increases proportionately to the increase in inputs
Decreasing returns to scale take place when output increases less than proportionately to the increase
in inputs (technical diseconomies of scale)
The LRAC curve is a typically U-shaped curve
• All points on the LRAC are productive efficient
• The downward sloping half of the LRAC reflect technical EOS
• The upward sloping half of the LRAC reflect technical DOS
EOS and DOS are measured in terms of a firm’s money cost of production Cost saving
INTERNAL ECONOMIES OF SCALE
IEOS are savings in average costs that occur to a firm as a result of expansion of the firm (LRAC falls)
Technical EOS: Technical and engineering factors
Factor indivisibility – Equipment cannot be used fully when output is small
• Higher output = more efficient use of machines
Increased dimensions – Large machines may be more efficient
• More output for a given amount of input
• Less people needed to operate machines
Linked processes – A large factory may take a product through several stages in its production
• Save times and costs – no need to move semi-finished products from one factory to another
Specialization and division of labour – In large scale factories, worker do simpler and repetitive jobs
• Less training is needed
• More efficient in a particular job
• More time saved in switching from one operation to another
By-product economies – waste to a small plant may be used in manufacture by larger plants
7 Rameshwar Patel/ Managerial economics/ www.managerialeconomic.blogspot.com
8. Managerial EOS: Employment of specialists like financial experts etc.
• Division of work increases efficiency of workers in their own areas of responsibility
• Decentralisation of decision making also increase efficiency of management
o Distortion and delays of information are avoided
8 Rameshwar Patel/ Managerial economics/ www.managerialeconomic.blogspot.com
9. Marketing/Commercial Economies: Large firms have bargaining advantage
• Preferential treatment – buying in bulk
• Unit costs of transportation is decreased as well
Financial Economies: Large firms find it easier and cheaper to raise funds
Risk-bearing Economies: Large firms have an advantage in bearing non-insurable risk
R&D Economies: Large firms can afford R&D facilities
Welfare Economies: Efficiency of workers can be increased by provision of welfare services
Economies of Scope: Large firms enjoy can enjoy economies of scope by increasing the range of
products being produced – fixed costs are shared among products
INTERNAL DISECONOMIES OF SCALE
IDOS are increases in average costs that occur to a firm as a result of expansion (LRAC rises)
Complexity Management: A more complex organization requires more skilful entrepreneurs and
managers to coordinate and control
• Expansion of ownership – incentives for manages to reduce costs/increase profits decrease
• Long chains of authority leads to a time-lag in decision implementation
• Extensive red-tape leads to slow responses to change in D&S conditions
Strained Relationships: Lack of personal loyalties on behalf on workers toward the company
EXTERNAL EOS
EEOS are the savings in average costs that occur to all firms in an industry as a result of expansion of
the industry, or the concentration of firms in a certain location (LRAC shifts down)
Economies of Concentration: More firms located in the same area derive mutual benefit
Availability of Skilled Labour – increased demand for particular skills give benefits
• Educational institutions set up
• Joint development of research and training facilities
Well developed infrastructure – Better infrastructure is set up to cater for economies of concentration
Reputation – large, well established industries builds up a name which customers associate with
quality
1. Brand loyalty, steady clientele
Economies of Disintegration: Creation of subsidiary industries to cater to need of a major industry
Economies of Information: Publication of trade journals increase productivity of individual firms
EXTERNAL DOS
EDOS are increases in average costs that occur to all firms in an industry as a result of the expansion
of the industry or the concentration of firms in a certain location. (LARC shifts up)
Increased strain on infrastructure: Infrastructure will be taxed to its limits
2. Congestion, increased fuel consumption
Rising costs of FOPs: Growing industries may create a shortage of RMs or skilled labour
9 Rameshwar Patel/ Managerial economics/ www.managerialeconomic.blogspot.com
10. GROWTH OF FIRMS
MEASURING GROWTH
1. Quantity of output sold
2. Turnover (total annual revenue)
3. Market share
4. Capital stock (amount of real assets)
5. Number of employees
METHODS OF GROWTH
Internal Expansion: Making more of a product, or extending a firm’s product range
Mergers & Acquisitions: Forming of new enterprises by the merging with, or taking over of one or
more existing firms.
1. Vertical Integration
o Merger between firms engaged in different stages of a production process
Backward integration (oil refineries buying oil wells)
Forward integration (breweries buying pubs)
2. Horizontal Integration
o Usually an acquisition of firm(s) at the same stage of production in the industry
Market dominance due to reduced competition
Greater specialization and economies of scale
3. Conglomeration
o Mergers involving firms which are not directly related to each other
Diversify output
Reduce risks of trading
Ensure long term growth
MOTIVES FOR GROWTH
See “Measuring Growth”
1. Exploit EOS
2. Gaining market share
3. Security through economies of scope
4. Increase market valuation
5. Reduce chances of acquisition by another firm
SURVIVAL OF SMALL FIRMS
Demand Supply
Nature of product DOS setting in early
Bulky and perishable products: bricks, fresh fish MES is low: tailor shops
Products for which variety is preferred: clothes Vertical disintegration
Specialized products: machines, religious items Small firms perform small parts of a larger
Prestige markets production process when disintegration occurs
Markets limited by prices: luxury vehicles, Low entry barriers
jewelery Lack of capital
Direct, personalized services Product-life cycles
G&S where direct, individual attention Is Banding allows small firms to band together to
required: lawyers, doctors, dentists, hairdressers gain advantages of bulk buyinh
Geographical limitations Non-traditional motives
Local markets due to larger bulk as compared to etc. etc.
value and transport costs
10 Rameshwar Patel/ Managerial economics/ www.managerialeconomic.blogspot.com
11. MARKET STRUCTURE: THINGS TO NOTE
The Econs Dept has provided excellent summaries on market structure,
so there’s no need to repeat an already well done piece of work here. :)
Bases for comparison of market structures efficiency and equity
The Theory of Contestable Markets shows how monopolies or near monopolies may practice
competitive pricing due to low barriers to entry and exit
• The market for low cost carriers is extremely contestable (~$10m investments)
The concentration ratio of an industry measures the output of an industry largest firm (or firms) as a
proportion of the industry’s total output.
• For PC, the concentration ratio extremely low
• For a monopoly, the concentration ratio is almost 100%
Market saturation refers to the situation in which a product has become diffused within a market. A
diffused product is one that is available to almost all consumers, or more applicably, almost all
households, for example the refrigerator or an automobile. Market growth is constrained when a
market is saturated.
The factors affecting market saturation include
• Consumer purchasing power and prices
• Competition
• Technology (dynamic efficiency)
• Product life cycles (when products will get replaced by newer products)
• Population growth
PRICE DISCRIMINATION
Price discrimination is the situation where (a) a producer sells a good to different buyers at two or
more different prices or (b) when the same consumer is charged different prices for the same product
for reasons not associated with cost differences.
CONDITIONS NECESSARY FOR PRICE DISCRIMINATION
1. Control over market supply
2. Ability to segment the market without possibility arbitrage
3. Market segments must have different PEDs
TYPES OF PRICE DISCRIMINATION
First degree Second degree (block pricing) Third degree
Each customer is charged his Different prices are charged for Same product sold at different
reservation price (the maximum different blocks of the same prices to different customers.
price they are willing to pay) good.
Auctions Utilities, taxi fare Admission tickets to parks, etc.
COSTS AND BENEFITS OF PRICE DISCRIMINATION
Costs
1. Loss of consumer surplus
Benefits
1. Higher output
2. Higher profits for the firm
3. Provision of goods that would otherwise not be produced
a. With PD, a firm may be able to cover costs
11 Rameshwar Patel/ Managerial economics/ www.managerialeconomic.blogspot.com
13. MARKET FAILURE RECAP: EFFICIENCY CONCEPTS
Market failure occurs when the free market fails Static Efficiency refers to efficiency at a given
to allocated resources in an optimum and point in time – how much output is possible
efficient manner. There are three main sources of given a stock of resources at a point in time.
market failure: Dynamic efficiency occurs in a market over a
period of time. It focuses on the change in the
EXTERNALITIES
amount of consumer choice available, as well as
Externalities occur when some of the costs or the quality of goods and services. Questions
benefits associated with production or asked include whether new technology is being
consumption of goods and services spills over developed and adopted at the best rate, and are
onto third parties. costs being reduced. DE is boosted by R&D
When market failure is present, allocative spending, greater investment in human capital
efficiency is achieved when MSB=MSC and greater competitive pressures.
Allocative efficiency is the situation in which
society consumes a combination of goods and
services that maximizes its welfare
Positive externalities (from consumption) occur when society benefits from the consumption of a
commodity or service, examples include education and vaccination.
Negative externalities (from production) occurs when costs are imposed on society from the
production of a commodity or service by private firms – pollution being the most obvious example.
Merit goods Demerit goods
Goods that society values and judges that Goods that society values and judges to be bad
everyone should have whether the individual for and individual
wants them or not.
Underconsumption due to imperfect information Overconsumption due to imperfect information –
– individuals are unaware of long-term benefits individuals are unaware of long-term detriments
and positive externalities and negative externalities
Consumption of merit goods is believed to Consumption of demerit goods leads to a fall in
generate positive externalities (MSB exceeds social welfare (MPB exceeds MSB)
MPB)
Healthcare, education, public libraries Alcohol, cigarettes, drugs, addiction to gambling
ZERO PROVISION OF PUBLIC GOODS
A public good is a good/service which is
1. Non-rivalrous – its benefits are not depleted by an additional user
o MC = 0, for allocative efficiency, P = MC = 0
o Public goods have to be provided at no charge
2. Non-excludable – impossible (or difficult) to exclude people from its benefits
o ‘Free rider’ problem arises – no one will pay for what he can get free
o Private firms will not provide public goods (unable to charge for consumption)
o Public goods, therefore, have to be provided by the government
Examples of public goods include streetlamps and public libraries
Note: a private good is one that is both rivalrous and excludable – automobiles, clothing, food etc.
IMPERFECT COMPETITION
Prefect competition does not always exist in real markets, and more often than not, free market forces
do not lead to optimum efficiency in resource allocation. One example is the monopoly: the
monopolist’s output is not allocative efficient as it produces at a point where P > MC, creating a DWL
of loss in both consumer and producer surplus.
13 Rameshwar Patel/ Managerial economics/ www.managerialeconomic.blogspot.com
14. EQUITY AND EQUALITY
I’m not sure if this is tested. I hope not.
Watch this space (it wouldn’t help) or ask me (it might help, but no guarantees).
Btw, inequity and inequality are sources of market failure too.
14 Rameshwar Patel/ Managerial economics/ www.managerialeconomic.blogspot.com
15. GOVERNMENT INTERVENTION
Problem Intervention Evaluation
Zero provision Direct provision of public goods
of public goods
Negative Financial intervention: taxes (equal to Advantages
externalities the monetary value of the MEC) are • Leaves space for market forces to
imposed on individuals or a firm, interact
internalizing ECs • Provision of revenue for the
government
Disadvantages
• Difficulty in valuating EC
• Overvaluation means output is below
social optimum, as with
undervaluation means that output is
not sufficiently lowered (ie, society’s
welfare is not always maximized)
• Effectiveness of tax dependent on
PED (see PED)
Legislation: laws and administrative Enforcement is difficult and expensive
rules are passed to prohibit or
regulate behaviour that imposes an
EC, e.g. pollution permits
Education, campaigns and Benefits must outweigh the costs of
advertisements solve the problem of implementation.
imperfect information by allowing the A lot of time may be needed for effects to
external costs to be made known to be felt
the consumer, discouraging demand
Positive Financial intervention: subsidies Advantages
externalities made to the producer or consumer • Considered the most effective way of
solving underconsumption as it is
easily implemented
Disadvantages
• Like taxes, the valuation of EB is
difficult
• High government expenditure is
required
Legislation include regulation seatbelt Enforcement requires constant checking
usage, compulsory education etc. which may translate to high costs.
Non provision There is a need to produce merit goods (which are naturally underconsumed) at
of merit goods low prices or for free due to four reasons
1. Social justice: they should be provided according to need and not ability to
pay
2. Large positive externalities, for example in the provision of free health
services helps to contain and combat the spread of disease
3. Dependants are subject to their guardians decision which are not necessarily
the best, therefore the provision of services like free education and dental
treatment is needed to protect dependants from uninformed or bad decisions
4. Ignorance: The problem of imperfect information makes consumers unaware
of the positive externalities and benefits that arise from consumption
15 Rameshwar Patel/ Managerial economics/ www.managerialeconomic.blogspot.com
16. Imperfect Imposition of a lump-sum tax on a monopolist (shifts AC upwards), and
markets supernormal profits are taken as tax
Government may impose regulations to control a monopolies
1. Forbidding the formation of monopolies (e.g., antitrust laws)
2. Forbidding monopolistic behaviour (like predatory pricing)
3. Ensuring standards of provision
4. Ensuring competition exists (e.g., deregulation)
16 Rameshwar Patel/ Managerial economics/ www.managerialeconomic.blogspot.com
17. NATIONALIZATION AND PRIVATIZATION
Nationalization refers to the public (governmental) ownership of certain firms to provide goods or
services sold in the market, that is, public corporations engaged in commercial activities.
Governments often take over natural monopolies to prevent monopoly pricing and examples include
public utilities.
Advantages Disadvantages
Consumers protected from high prices Cross inefficiency may arise
Ensuring social costs and benefits are taken into No profit motive may lead to nationalized
account when production decisions are made enterprises being allocatively inefficient
Privatization refers to a change in ownership of an activity from the public to the private sector.
State owned companies having lost money may privatize to give new owners the responsibility of
restructuring the enterprise.
FORMS OF PRIVATIZATION
1. Denationalization: Privatization of ownership – sales of assets or shares. The government
may retain some shares in the enterprise, and acts as a regulator in this case to ensure that
public interest is protected.
2. Franchising: Gives the private sector a right to operate a particular service/activity for a given
length of time. May be exclusive or competitive
3. Privatization of production: Government buys goods and services instead of producing them
o Refuse collection services being contracted to private firms
4. Privatization of financing: Government relies on consumer charges rather than tax revenue
to subsidize operations. (e.g., independent school fees)
5. Deregulation: Liberalization of regulation to promote competition through the removal of
barriers to entry (creation of contestable markets)
o Telecommunications, financial industry, airline (US ‘open skies’ policy)
EVALUATION OF PRIVATIZATION
For Against
Revenue for the government – reduces public- Long term revenue loss – future profits from
sector borrowing requirement. Allows the industries are lost by the state
government to make tax cuts without reducing Natural monopolies are best left to the public
spending. Revenue might come in from higher sector as duplication of services is unnecessary –
corporate tax receipts from the privatized wasteful and inefficient and not in the best
companies interests of consumers
Increased competition due to contestable Competition may not increase replacing a
markets and profit motives which translates to public-sector monopoly with a private-sector one
Benefits for consumers in the form of lower does not increase competition as firms are still
prices, wider choices and better qualities as X- able to act like monopolists
inefficiency is reduced (see Nationalization)
Increased efficiency and flexibility as private Market forces may not ensure greater efficiency
companies are normally more successful in – like before, remaining as private-sector
raising capital, lowering prices and cutting out monopolies are likely to earn supernormal profits
waste. Little governmental interference allows even if they are inefficient. Large firm size also
the company to respond to market forces, and prevents firms from being taken over
make commercially sensible decisions and
investments
Wider share ownership increases accountability Private-sector firms may not act in public
to the public interest as they do not take into account negative
externalities (like resultant unemployment) and
17 Rameshwar Patel/ Managerial economics/ www.managerialeconomic.blogspot.com
18. are unlikely to base their output and pricing on
social justice and equity
Cost-push inflation is reduced. Private firms are
less willing to accept inefficient working
practices. Wage raises have to be justified by
higher productivity.
18 Rameshwar Patel/ Managerial economics/ www.managerialeconomic.blogspot.com
19. DEALING WITH INEQUALITY AND INEQUITY
The tax system can be used to reduce inequalities in income and wealth.
• Progressive taxes: people earning higher incomes are taxed a higher percentage of their
income
o Reducing income differentials
o May create disincentives to work with excessive progressivity
• Direct tax imposition on wealth (e.g., inheritance taxes)
Monetary provision: money raised through the tax system is paid to low-income groups to increase
YD
• Means-tested benefits are paid to those that fit certain criteria
Unemployment benefits
o Might create disincentives to work
o Not always claimed by those for whom they are designed
o Expensive to administer
o Low take up rates: bureaucracy and social stigma
• Universal benefits are paid out to everyone in certain categories regardless of income/wealth
State pensions, child benefits
o May imply paying out money to those who do not need it
o More expensive
Direct provision of goods and services are also financed through the tax system. Free provision
means that if services are used equally by all, lower income groups gain more advantage, reducing
inequality
• Healthcare and education
o Subject to market failure, but justified by inequity
GOVERNMENT FAILURE
Government failure arises when government intervention in the market to improve market failure
worsens the situation: increases market distortions and reduces welfare and economic efficiency
instead of otherwise.
REASONS FOR GOVERNMENT FAILURE
Problem of incentives: undesirable incentives may create inefficiencies
• Taxation distorts incentives
o Disincentives to work harder with progressive tax
o DWL of a tax may cause a disincentive to consume and produce
• Politicians motivated by political power rather than economic imperatives
o Policies designed to retain power rather than maximize efficiency
o Political pressures dominates societal welfare
Unpopular taxes that reduce externalities may be unpopular are avoided
• Inappropriate incentives of public enterprises
o Lack of incentive to produce the products well?
Problems of information arise as, just as the markets lack information, more often than not,
governments do too. The government may not know the full costs/benefits of policies even though it
wishes to work to the interests of the consumer
• Imperfect information about the true value of a negative externality
o Difficult to trace the source of a negative externality
o Problems of taxation – difficult to put a figure to EC (see Government Intervention)
• Imperfect information about the level of consumer demand
o Public goods provided may not be needed, or produced are wrong quantities
Problems of distribution arise as policies may affect different groups of people differently
19 Rameshwar Patel/ Managerial economics/ www.managerialeconomic.blogspot.com
20. Bureaucracy and inefficiency arise when policies are wide reaching and detailed, more people and
resources will be involved. Inflexibility due to bureaucracy leads to a lack of fine-tuning
(governments respond more slowly to problems when circumstances change)
Time lags in planning and implementation of policies cause policies to be ineffective, irrelevant, or
come too late to solve a mounting problem
Frequent shifts in government policy may cause economic efficiency to suffer as firms find it
difficult to plan without knowledge of tax rates, subsidies, wage controls etc.
Vicious circle of government intervention
20 Rameshwar Patel/ Managerial economics/ www.managerialeconomic.blogspot.com