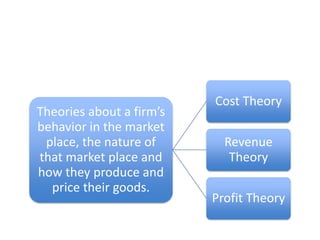
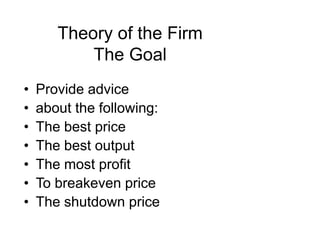
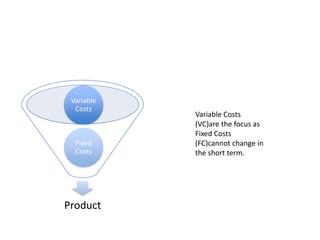
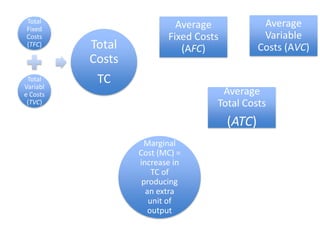
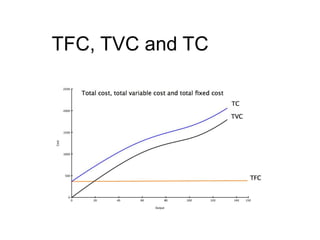
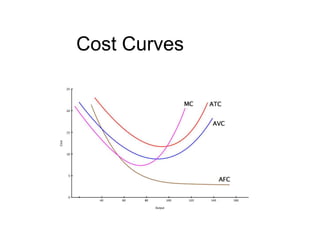
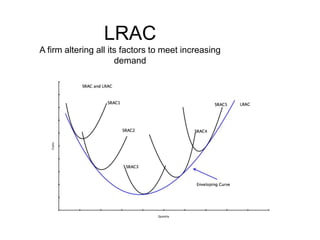
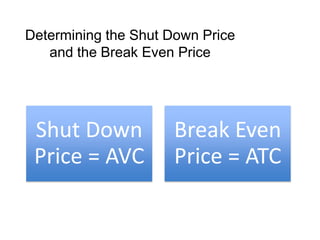
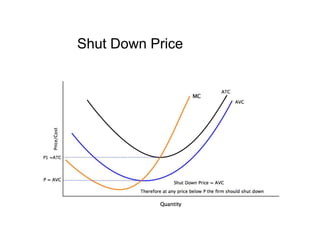
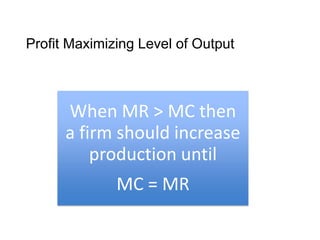
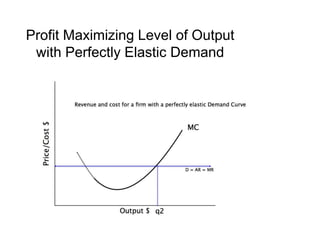
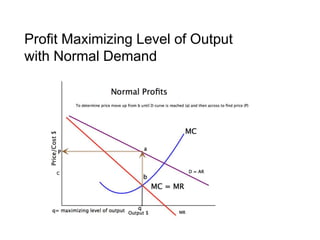
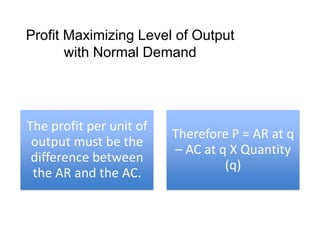
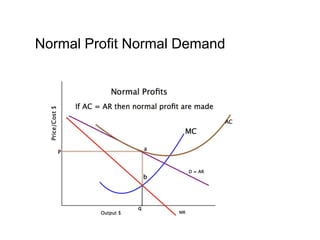
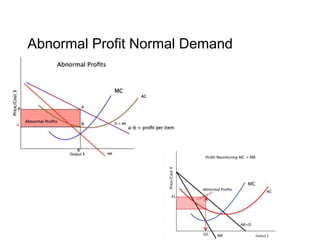
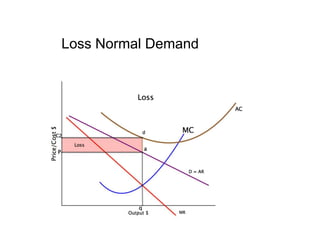
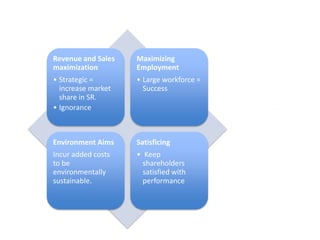
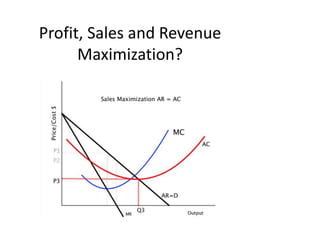
Diagrams and DefinitionsSection 2
What is a market? A market is any situation or place that enables the buying and selling of goods and services and factors of production. A market may be a physical location (a street market), it may also be a virtual one (internet buying and selling) or a national one (the market for teachers or doctors). Triple A
Markets exist when buyers and sellers interact. This interaction determines market prices and thereby allocates scarce good and services.    DemandA schedule (curve) that shows the quantity of a good that consumers are able and willing to buy at a certain price during a specified period of time.
Change in Quantity Demanded
Law of Demand
Determinants of Demand: Price
Determinants of Demand: Non-price
 Determinants of Demand
Change in Demand
Movements versus ShiftsChange in Quantity DemandedChange in Demand
Veblen Goods
GiffenGoods
Expectations
SupplyA schedule (curve) showing how much of a product producers will supply at each of a series of prices over a specific period of time.
Law of Supply
Why Does Supply Rise when Price Rises? I can make more profit!
Determinants of Supply: Price
Change in Quantity Supplied
Determinants of Supply: Non-price
 Determinants of Supply
Change in Supply
Movements Versus Shift  Change in Quantity SuppliedChange in Supply
Equilibrium
Consumer and Producer Surplus
PriceConsumer SurplusA + B = Maximum Willingness to Pay for QoWhat is paidDQuantityConsumer SurplusBPoAQo
PriceProducer SurplusWhat is paidMinimum Amount Needed to Supply QoQuantityProducer SurplusSPoQo
PriceQuantityConsumer and Producer SurplusSConsumer SurplusPoProducer SurplusDQo
PriceNew Consumer SurplusOriginal Consumer SurplusLoss in Surplus: Consumers paying moreP1Loss in Surplus: Consumers buying lessPoDQoQ1Change in Consumer Surplus: Price IncreaseQuantity
Price Ceilings
Price Floor
Price Ceiling & Price Floor
Price Support/Buffer Stock SchemesGovernments intervene when there are extreme price fluctuations brought about by seasons factors (agricultural products) and/or economic factors (commodities).
PriceLost Consumer SurplusNew Consumer SurplusLost Producer SurplusNew Producer SurplusQuantityLoss in Efficiency Too High a Price (Price Floor)SPHPrice FloorPoDQoQL
PriceLost Consumer SurplusNew Consumer SurplusLost Producer SurplusNew Producer SurplusQuantityLoss in Efficiency Too Low a Price (Price Ceiling)SPoPLPrice CeilingDQoQL
ElasticitiesPrice elasticity of demand PEDCross elasticity of demand XEDIncome elasticity of demand YEDPrice elasticity of supply PES
Price Elasticity of Demand (PED)
Range of PED values
Price Inelastic Demand
Price Elastic Demand
Range of PED
Extreme Cases
Perfectly Elastic Demand
Perfectly Inelastic Demand
Unit Elastic Demand
 Determinants of PED
Determinants of PEDIncome
Determinants of PESTime
Determinants of PESSpare Capacity
Impact on Total Revenue of FirmsTotal revenue is the amount paid by buyers and received by sellers of a good. TR = P x Q With an inelastic demand curve, an increase in price leads to a decrease in quantity that is proportionately smaller. Thus, total revenue increases.With an elastic demand curve, an increase in price leads to a increase in quantity that is proportionately smaller. Thus, total revenue decreases.
Taxation Governments levy taxes to raise revenue for public projects Critics of taxation argue that:Taxes discourage market activity.When a good or service is taxed, the quantity sold is smaller.
Indirect Tax Specific Tax
Indirect Tax Ad Valorem Tax
Tax IncidenceTax incidence is the manner in which the burden of a tax is shared among participants in a market.How this burden is shared depends on elasticity.
Tax and Relatively Inelastic Demand
Tax and Relatively Inelastic DemandPrice for Buyers = .35Price for Sellers= .2(150m X .35)(150m X .2)(150m X .15)
Tax and Relatively Inelastic DemandBefore Tax Buyers paid .25After Tax Buyers pay .35 Buyers contribute 15 m to Revenue (150 X .1) Price for Buyers = .35Price for Sellers = .25
Tax and Relatively Elastic Demand
SummaryThe incidence of a tax refers to who bears the burden of a tax.The incidence of a tax does not depend on whether the tax is levied on buyers or sellers.The incidence of the tax depends on the price elasticities of supply and demand.The burden tends to fall on the side of the market that is less elastic.
Total Revenue and Price Elastic Demand
Total Revenue and Price Inelastic Demand
Some Practical Applications of PEDWith an elastic demand curve, an increase in the price leads to a decrease in quantity demanded that is proportionately larger. Thus, total revenue decreases.
Theory of the Firm The GoalProvide advice about the following:The best priceThe best outputThe most profitTo breakeven priceThe shutdown price
Variable Costs (VC)are the focus as Fixed Costs (FC)cannot change in the short term.
Ways to Measure Output
The Total Product Curve
Average and Marginal Product Curves
Diminishing Average Returns
Diminishing Marginal Returns
Total Costs (TC) = total cost to produce a certain output. TC = TFC + TVCTotal Fixed Costs (TFC) = total cost of fixed assets used in a given time period. Total Variable Costs (TVC) = total cost of the variable assets that a firm uses in a given period of time.
Average Fixed Costs (AFC)Average Variable Costs (AVC) Total Fixed Costs (TFC)Marginal Cost (MC) = increase in TC of producing an extra unit of outputTotal CostsTCAverage Total Costs(ATC)Total Variable Costs (TVC)
TFC, TVC and TC
Cost Curves
LRAC A firm altering all its factors to meet increasing demand
Economies and Diseconomies of Scale
Financial SavingsTransport SavingsBulk Buying of InputsTechnologyEconomies of ScaleSpecializationAdvertising and promotion
Control and CommunicationAlienation/work satisfactionDiseconomies of Scale
Total Revenue
Marginal Revenue
Revenue Curves: Perfectly Elastic DemandPriceD=AR=MR5Output
Accounting Profit
Economic Profit
Determining the Shut Down Price and the Break Even Price
Shut Down Price
Profit Maximizing Level of Output
Profit Maximizing Level of Output with Perfectly Elastic Demand
Profit Maximizing Level of Output with Normal Demand
Normal Profit Normal Demand
Abnormal Profit Normal Demand
Loss Normal Demand
Is it always about profit?
Profit, Sales and Revenue Maximization?
Section 2 definitions diagrams

Section 2 definitions diagrams