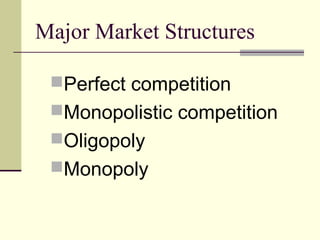
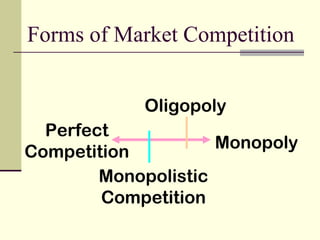
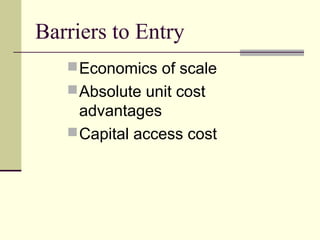
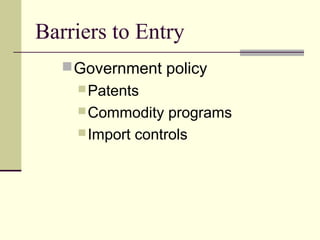
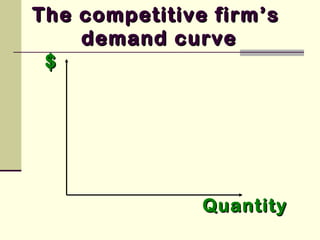
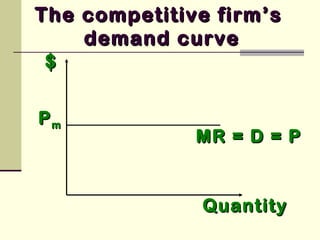
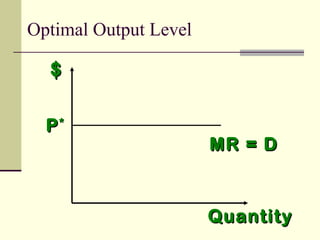
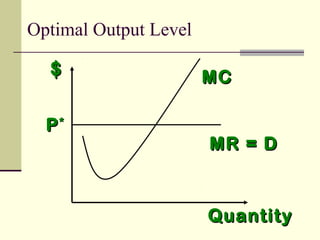
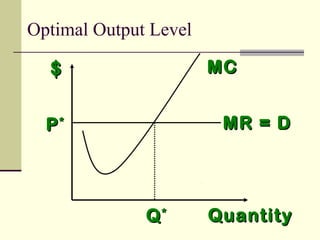
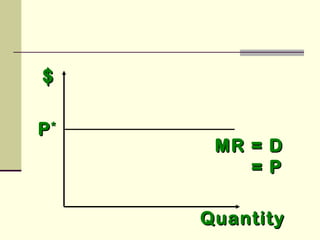
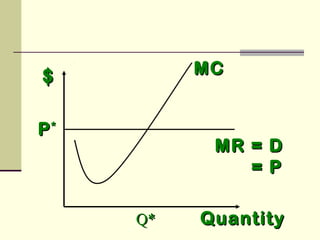
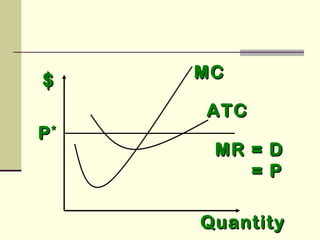
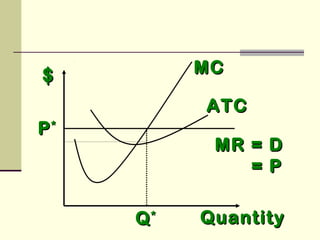
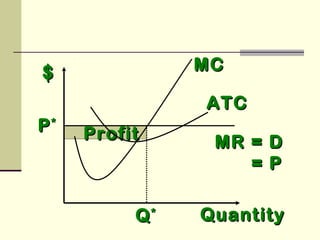
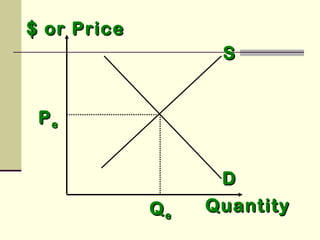
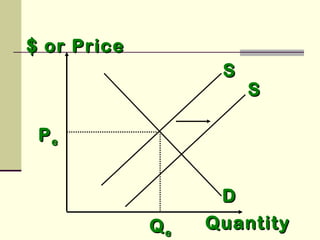
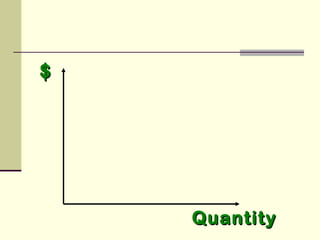
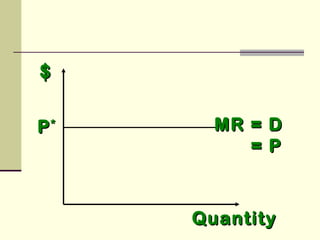
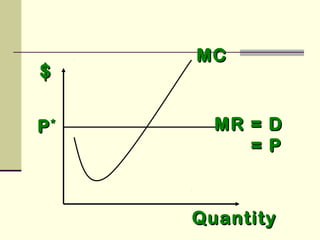
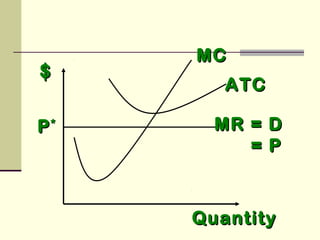
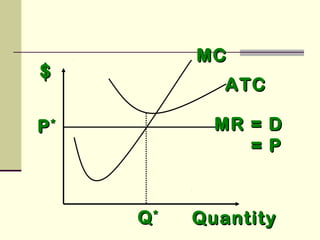
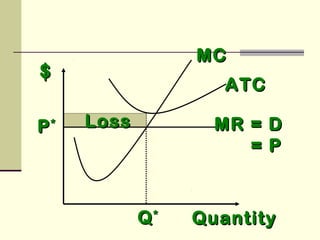
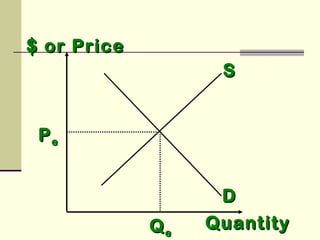
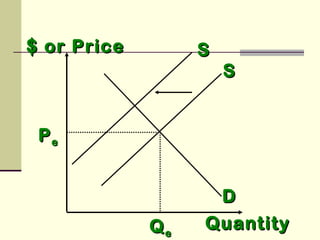
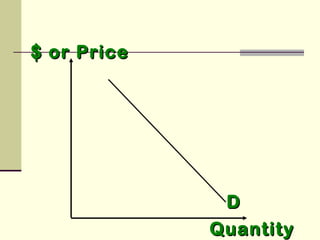
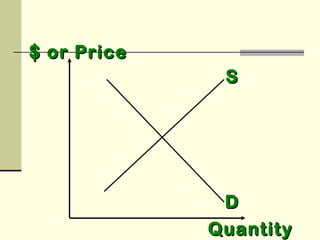
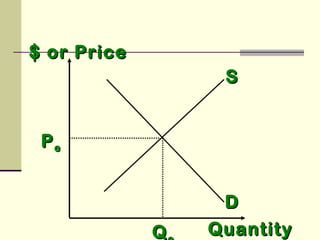
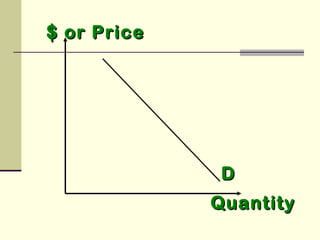
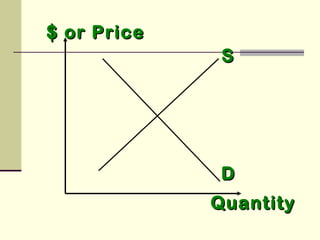
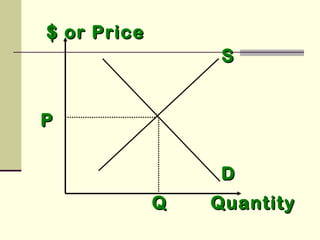
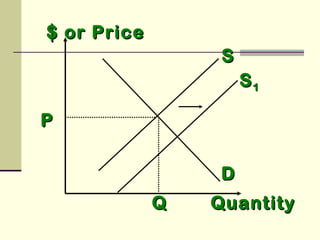
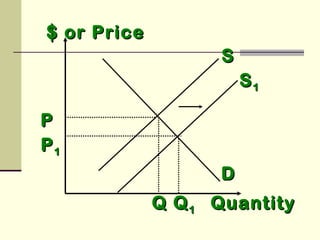
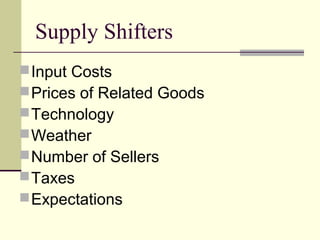
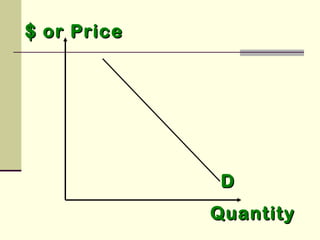
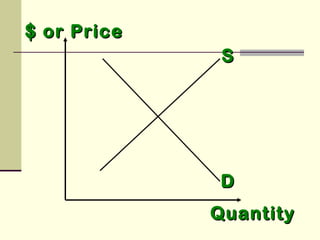
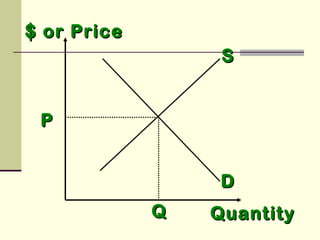
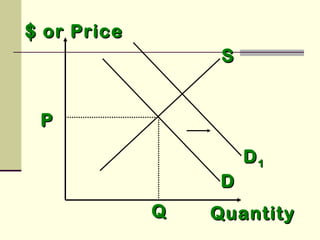
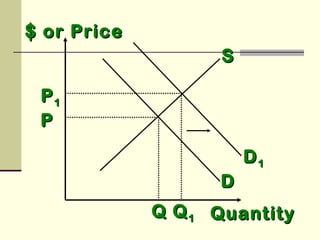
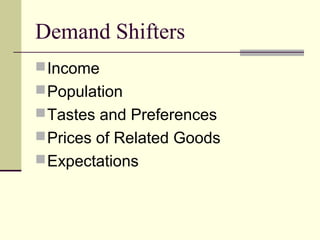
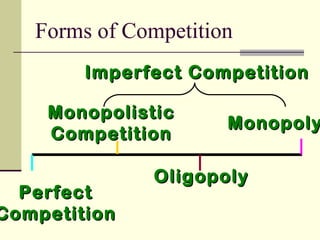
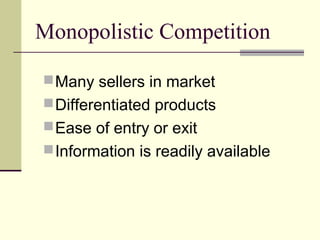
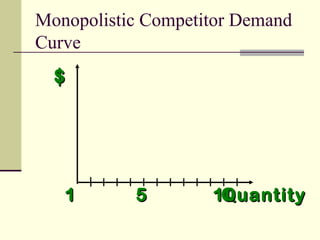
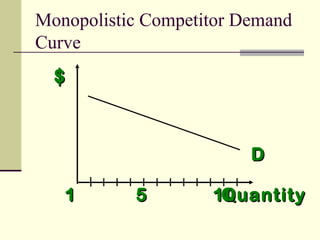
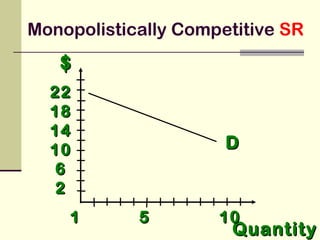
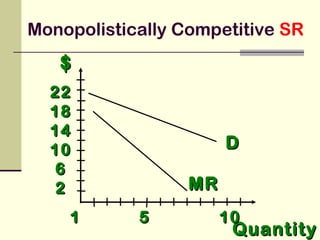
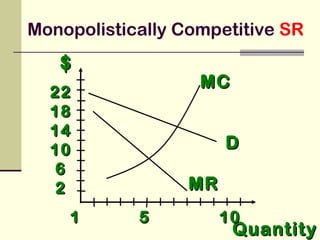
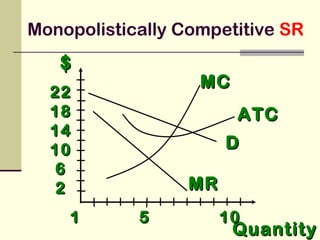
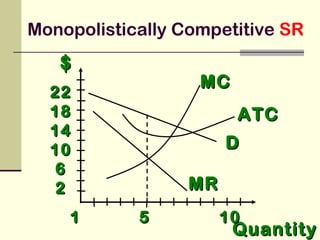
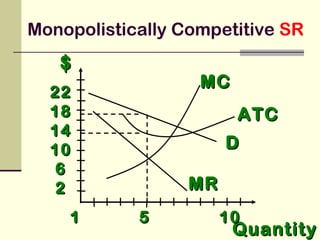
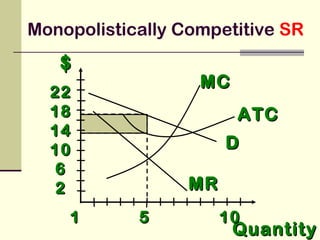
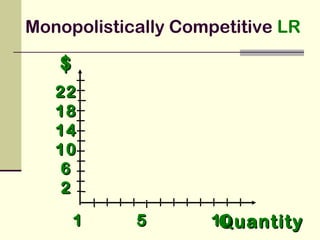
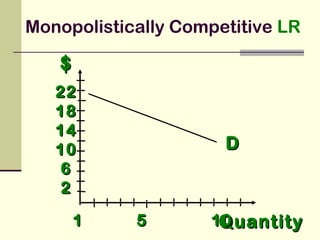
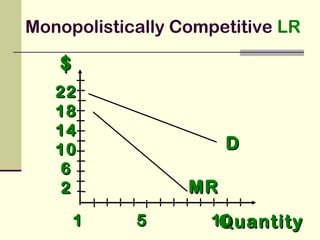
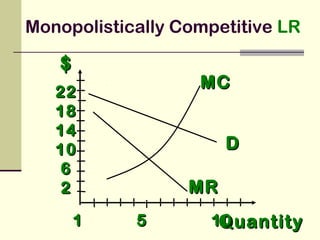
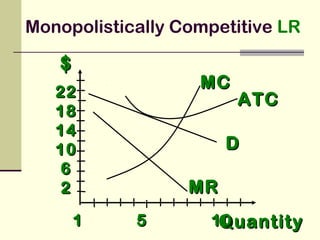
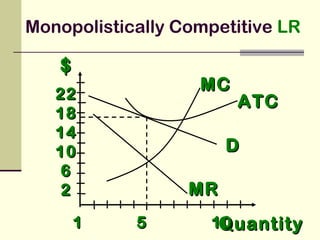
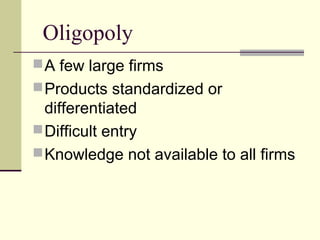
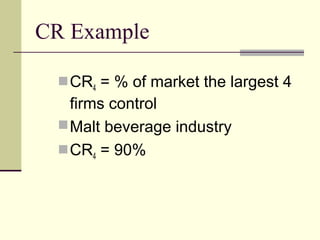
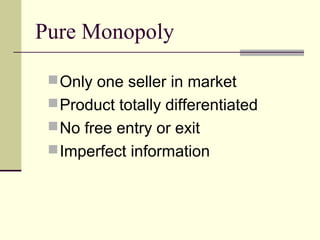
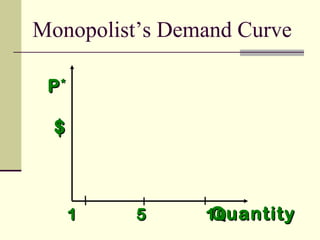
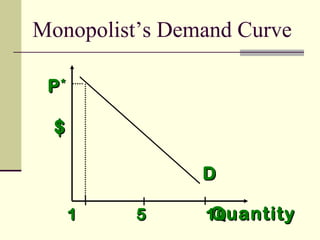
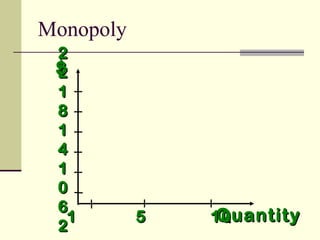
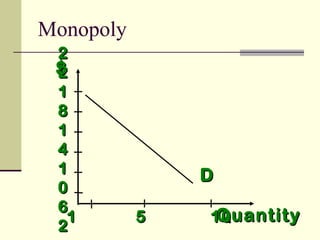
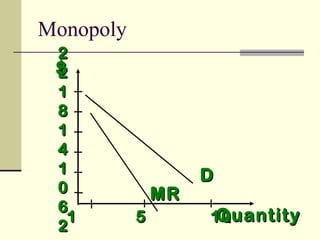
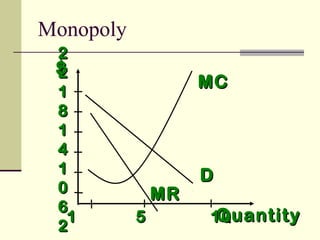
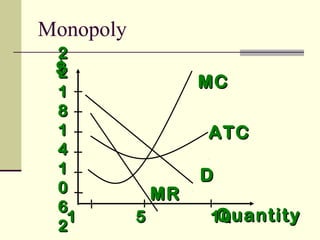
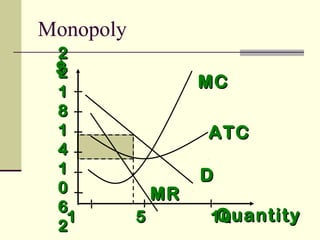
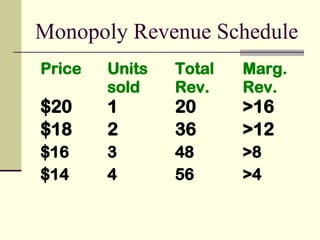
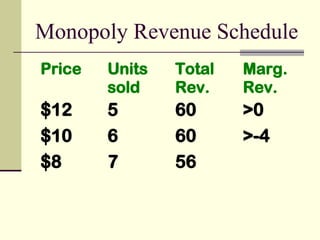
Competition and the
Market
Chapter 7
The function of Price
Price brings quantity supplied in
line with quantity demanded.
As a good becomes relatively more
scarce, price will go up.
How does this impact firms and
consumers?
Markets can be characterized
by how prices for goods and
services are determined
Major Market Structures
Perfect competition
Monopolistic competition
Oligopoly
Monopoly
Forms of Market Competition
Perfect
Competition
Monopoly
Monopolistic
Competition
Oligopoly
The Competitive Model
The process of competition
involves a rivalry among firms
and is prevalent throughout our
economy.
The Competitive Model
The state of competition is the
end result of the competitive
process under certain conditions.
Factors Affecting the Form
of Market Competition an
Industry Expresses
Factors
The number and size distribution of
buyers and sellers
The degree of product
differentiation
Factors
The extent of barriers to entry
Amount of information available
Factor #1:
The number and size
distribution of buyers and
sellers
Number and Size Distribution
E.g. farmers and consumers
2 million farms in US
1.2 million are small with < $20,000
annual income
Number and Size Distribution
Most farm’s output is so small,
any one’s output, compared to
total output, is imperceptible.
What one farmer does has no
influence on what any other
farmer does.
Number and Size Distribution
The same can be said for
consumers.
Marketplace has many consumers
and the vast majority consume small
amounts.
Factor #2:
Product Differentiation
A competitive market is
characterized by
undifferentiated or
homogeneous products.
Product Differentiation
Homogeneous or undifferentiated
products cannot be distinguished
from one another.
E.g. No. 2 yellow corn
Product Differentiation
If you feed livestock and have
two different corn sellers you can
buy from, how do you determine
which to buy from?
Product Differentiation
Grain elevator
A
No. 2 yellow
corn
$2.10/bu
Grain elevator
B
No. 2 yellow
corn
$2.11/bu
Product Differentiation
What determines decision?
Price!
Identical product
5000 bu x $.01 less/bu = $50
savings by using elevator A
Factor #3:
Barriers to Entry
Barriers to Entry
Barriers are things that prevent
other firms from entering the
market.
Barriers to Entry
Economics of scale
Absolute unit cost
advantages
Capital access cost
Barriers to Entry
Government policy
Patents
Commodity programs
Import controls
Factor #4:
Perfect Knowledge and
Information
Knowledge and Info
In a perfectly competitive market,
firms would have same access to
new knowledge and information
about market prices, quantities, and
quality.
Profit Maximizing Entrepreneurial
Firms
For perfect competition to exist,
firms must have a singular goal of
profit maximization.
The Profit Motive
and the Results of
Competition
The competitive firm’s demand curve
$$
QuantityQuantity
The competitive firm’sThe competitive firm’s
demand curvedemand curve
$$
MR = D = PMR = D = P
QuantityQuantity
PPmm
The competitive firm’sThe competitive firm’s
demand curvedemand curve
The optimal level of output for a
competitive firm is determined
where Marginal Revenue (MR)
is equal to Marginal Cost (MC).
$$
QuantityQuantity
Optimal Output Level
$$
MR = DMR = D
QuantityQuantity
PP**
Optimal Output Level
$$ MCMC
MR = DMR = D
QuantityQuantity
PP**
Optimal Output Level
$$ MCMC
MR = DMR = D
QuantityQuantityQQ**
PP**
Optimal Output Level
Average Total Cost (ATC) can be
added to the graph to demonstrate
the firm’s profit potential.
Average Total Cost
The per unit cost of producing a
specific good.
The difference between ATC and
product’s price equals the profit
per unit of product.
$$
QuantityQuantity
Average Total Cost
ATCATC
$$
QuantityQuantity
Average Total Cost
Average Total Cost
Price - ATC = Profit per unit of
output
Note: Price > ATC indicates a
profit
$$
QuantityQuantity
$$
MR = DMR = D
= P= P
QuantityQuantity
PP**
$$ MCMC
MR = DMR = D
= P= P
QuantityQuantityQ*Q*
PP**
$$ MCMC
MR = DMR = D
= P= P
QuantityQuantity
ATCATC
PP**
$$ MCMC
MR = DMR = D
= P= P
QuantityQuantity
ATCATC
QQ**
PP**
ProfitProfit
$$ MCMC
MR = DMR = D
= P= P
QuantityQuantity
ATCATC
QQ**
PP**
Profit
Price - ATC = Profit per unit of
output
Note: Price < ATC indicates a
loss
Profit
 It is important to note that profit in a
perfectly competitive market will lead
to firms wanting to enter that market
 If enough firms enter, then the
market supply curve will shift to the
right.
$ or Price$ or Price
SS
DD
QuantityQuantity
PPee
QQee
$ or Price$ or Price
SS
DD
QuantityQuantity
PPee
QQee
SS
Profit
With the increase in Supply, price
will be driven down.
With the lower price, profits will be
driven out.
$$
QuantityQuantity
$$
MR = DMR = D
= P= P
QuantityQuantity
PP**
$$
MCMC
MR = DMR = D
= P= P
QuantityQuantity
PP**
$$
MCMC
MR = DMR = D
= P= P
QuantityQuantity
ATCATC
PP**
$$
MCMC
MR = DMR = D
= P= P
QuantityQuantity
ATCATC
QQ**
PP**
$$
MCMC
MR = DMR = D
= P= P
QuantityQuantity
ATCATC
QQ**
PP** LossLoss
$ or Price$ or Price
SS
DD
QuantityQuantity
PPee
QQee
$ or Price$ or Price
SS
DD
QuantityQuantity
PPee
QQee
SS
Profit
With the decrease in Supply, price
will be driven up.
With the higher price, the losses
will be driven out.
Market Price and Quantity
What are the factors that generate
the market price that firms use to
make their production decisions?
The interaction of the Market
Supply and Market Demand curves
will determine the price consumers
will pay and producers will receive.
Market Supply and Demand
Relationship for a Competitive
Market
$ or Price$ or Price
QuantityQuantity
$ or Price$ or Price
DD
QuantityQuantity
$ or Price$ or Price
SS
DD
QuantityQuantity
$ or Price$ or Price
SS
DD
QuantityQuantity
PPee
QQ
Specific Results of
Competition
Price takers
Optimal output
No product
differentiation
Specific Results of
Competition
Market equilibrium
Technological advancements
Efficiency
Changes in Supply
or Demand
An Increase in
Supply
An Increase in Supply
 Note the supply curve shifts to the right.
 This lowers price and increases quantity
supplied.
An Increase in Supply
 A decrease in supply would be represented
by a shift of the supply curve to the left.
$ or Price$ or Price
QuantityQuantity
$ or Price$ or Price
DD
QuantityQuantity
$ or Price$ or Price
SS
DD
QuantityQuantity
$ or Price$ or Price
SS
DD
QuantityQuantity
PP
QQ
$ or Price$ or Price
SS
DD
QuantityQuantity
PP
QQ
SS11
$ or Price$ or Price
SS
DD
QuantityQuantity
PP
QQ
SS11
PP11
QQ11
Supply Shifters
Input Costs
Prices of Related Goods
Technology
Weather
Number of Sellers
Taxes
Expectations
An Increase in
Demand
$ or Price$ or Price
QuantityQuantity
$ or Price$ or Price
DD
QuantityQuantity
$ or Price$ or Price
SS
DD
QuantityQuantity
$ or Price$ or Price
SS
DD
QuantityQuantity
PP
QQ
$ or Price$ or Price
SS
DD
QuantityQuantity
PP
QQ
DD11
$ or Price$ or Price
SS
DD
QuantityQuantity
PP
QQ
DD11
PP11
QQ11
An Increase in Demand
Note Demand Curve shifts right
Increases price
Increases quantity demanded
A Decrease in Demand
Demand Curve would shift left
Decreases price
Decreases quantity demanded
Demand Shifters
Income
Population
Tastes and Preferences
Prices of Related Goods
Expectations
Agriculture’s Competitive Side
2.1 mil farms
Homogeneous products
Freedom of entry and exit
Information is available
Agriculture’s Departure from
Competition
Soviet grain deal of 1973
Marketing cooperatives
High land prices
Technology availability
Models of Imperfect
Competition
Imperfect competition exists
whenever a firm has some control
over the price it charges for its
product.
Forms of Competition
PerfectPerfect
CompetitionCompetition
MonopolyMonopoly
MonopolisticMonopolistic
CompetitionCompetition
OligopolyOligopoly
Imperfect CompetitionImperfect Competition
Monopolistic Competition
Many sellers in market
Differentiated products
Ease of entry or exit
Information is readily available
Monopolistic Competition
Non-price competition usually
occurs
$$
QuantityQuantity1 5 101 5 10
Monopolistic Competitor Demand
Curve
$$
QuantityQuantity
DD
1 5 101 5 10
Monopolistic Competitor Demand
Curve
Monopolistically
Competitive Firm’s Price,
Quantity, and Profit
Short Run
$$
QuantityQuantity
1 5 101 5 10
2222
1818
1414
1010
66
22
Monopolistically Competitive SR
$$
QuantityQuantity
DD
1 5 101 5 10
2222
1818
1414
1010
66
22
Monopolistically Competitive SR
$$
QuantityQuantity
DD
1 5 101 5 10
2222
1818
1414
1010
66
22 MRMR
Monopolistically Competitive SR
$$
QuantityQuantity
DD
1 5 101 5 10
2222
1818
1414
1010
66
22 MRMR
MCMC
Monopolistically Competitive SR
$$
QuantityQuantity
DD
1 5 101 5 10
2222
1818
1414
1010
66
22 MRMR
MCMC
ATCATC
Monopolistically Competitive SR
$$
QuantityQuantity
DD
1 5 101 5 10
2222
1818
1414
1010
66
22 MRMR
MCMC
ATCATC
Monopolistically Competitive SR
$$
QuantityQuantity
DD
1 5 101 5 10
2222
1818
1414
1010
66
22 MRMR
MCMC
ATCATC
Monopolistically Competitive SR
$$
QuantityQuantity
DD
1 5 101 5 10
2222
1818
1414
1010
66
22 MRMR
MCMC
ATCATC
Monopolistically Competitive SR
Monopolistically
Competitive Firm’s Price,
Quantity, and Profit
Long Run
$$
QuantityQuantity1 5 101 5 10
2222
1818
1414
1010
66
22
Monopolistically Competitive LR
$$
QuantityQuantity
DD
1 5 101 5 10
2222
1818
1414
1010
66
22
Monopolistically Competitive LR
$$
QuantityQuantity
DD
1 5 101 5 10
2222
1818
1414
1010
66
22 MRMR
Monopolistically Competitive LR
$$
QuantityQuantity
DD
1 5 101 5 10
2222
1818
1414
1010
66
22 MRMR
MCMC
Monopolistically Competitive LR
$$
QuantityQuantity
DD
1 5 101 5 10
2222
1818
1414
1010
66
22 MRMR
MCMC
ATCATC
Monopolistically Competitive LR
$$
QuantityQuantity
DD
1 5 101 5 10
2222
1818
1414
1010
66
22 MRMR
MCMC
ATCATC
Monopolistically Competitive LR
Oligopoly
A few large firms
Products standardized or
differentiated
Difficult entry
Knowledge not available to all firms
Oligopoly Industries
Sugar
Light bulbs
Gas
Steel
Glass
Oligopoly Industries
Autos
Breakfast cereals
Cigarette makers
Soap
Beer
Concentration Ratio
A rough measure to gauge
whether or not an industry is an
oligopoly
% of market the largest firms
control
Usually 4-8 firms
CR Example
CR4 = % of market the largest 4
firms control
Malt beverage industry
CR4 = 90%
Pure Monopoly
Only one seller in market
Product totally differentiated
No free entry or exit
Imperfect information
Pure Monopoly
Where a perfectly competitive
firm is a price taker, the
monopolist is a price searcher.
$$
QuantityQuantity
PP**
1 5 101 5 10
Monopolist’s Demand Curve
$$
QuantityQuantity
PP**
DD
1 5 101 5 10
Monopolist’s Demand Curve
Monopoly Price,
Quantity, and Revenue
Schedules
$$
QuantityQuantity1 5 101 5 10
22
22
11
88
11
44
11
00
66
22
Monopoly
$$
QuantityQuantity
DD
1 5 101 5 10
22
22
11
88
11
44
11
00
66
22
Monopoly
$$
QuantityQuantity
DD
1 5 101 5 10
22
22
11
88
11
44
11
00
66
22
MRMR
Monopoly
$$
QuantityQuantity
DD
1 5 101 5 10
22
22
11
88
11
44
11
00
66
22
MRMR
MCMC
Monopoly
$$
QuantityQuantity
DD
1 5 101 5 10
22
22
11
88
11
44
11
00
66
22
MRMR
MCMC
ATCATC
Monopoly
$$
QuantityQuantity
DD
1 5 101 5 10
22
22
11
88
11
44
11
00
66
22
MRMR
MCMC
ATCATC
Monopoly
Monopoly Revenue Schedule
Price Units
sold
Total
Rev.
Marg.
Rev.
$20 1 20 >16
$18 2 36 >12
$16 3 48 >8
$14 4 56 >4
Monopoly Revenue Schedule
Price Units
sold
Total
Rev.
Marg.
Rev.
$12 5 60 >0
$10 6 60 >-4
$8 7 56
Efficiency Comparisons
The Growth of Firms
Internal Growth
External Growth
The Growth of Firms
 Horizontal Mergers
 Combinations of firms in the same
industry
 Vertical Mergers
 Two or more firms in different production
or marketing stages within the same
industry.
 Conglomerate mergers
 Combinations of firms in unlike
industries
Antitrust Laws
Sherman Antitrust Act
Section 1 makes it Illegal to act in
restraint of trade
Section 2 makes it illegal to
monopolize interstate trade,
forbidding the use of economic
power.
Agricultural Bargaining
The more the market is
concentrated, the more power the
larger firms have.
A large number of farmers facing a
single buyer could be an example.
Farmers can resolve this situation
by organizing themselves into an
agricultural bargaining group.
Agricultural Bargaining
Clayton Act started the process of
giving farm groups immunity from
Sherman Act.
These farm groups must form as
non-profit groups, and could not
have capital stock.
Agricultural Bargaining
 Capper Volstead Act of 1922 was sought to clarify
that section of the Clayton act that applied to
agriculture.
 CV 1922 provided stock or nonstock corporations to
operate provided:
 They operated for the mutual benefit of their
membership
 They did not deal in the products of non-members to
an amount greater in value than such as are handled
by it for its members.
 No member is allowed more than one vote
 Association does not pay dividends on stock or
membership capital in excess of 8 percent a year.
 They can’t use their market power to enhance prices.

Chapter 7 competition and the market