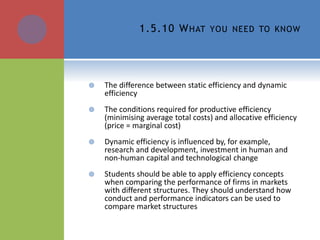
1. The document discusses different types of economic efficiency including productive efficiency, allocative efficiency, and dynamic efficiency.
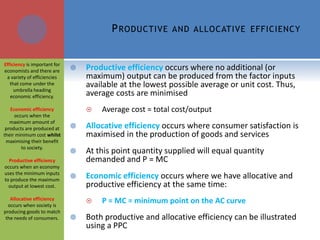
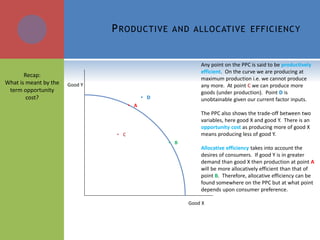
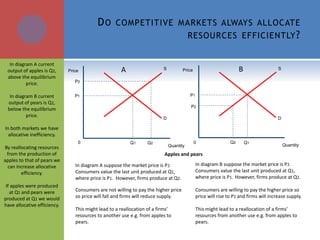
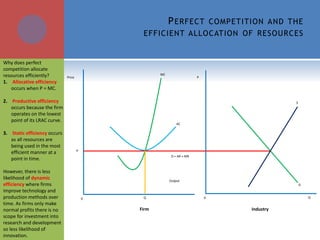
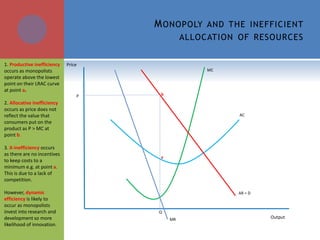
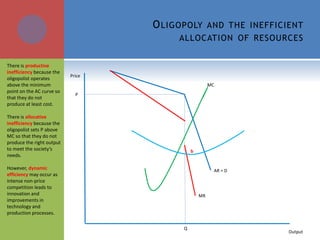
2. Productive efficiency occurs when maximum output is produced at minimum cost, while allocative efficiency occurs when production matches consumer demand.
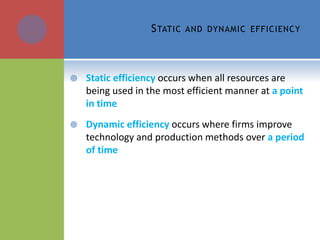
3. Dynamic efficiency refers to improvements in technology and production methods over time that allow firms to better satisfy consumer needs.