
![Sending to Broker
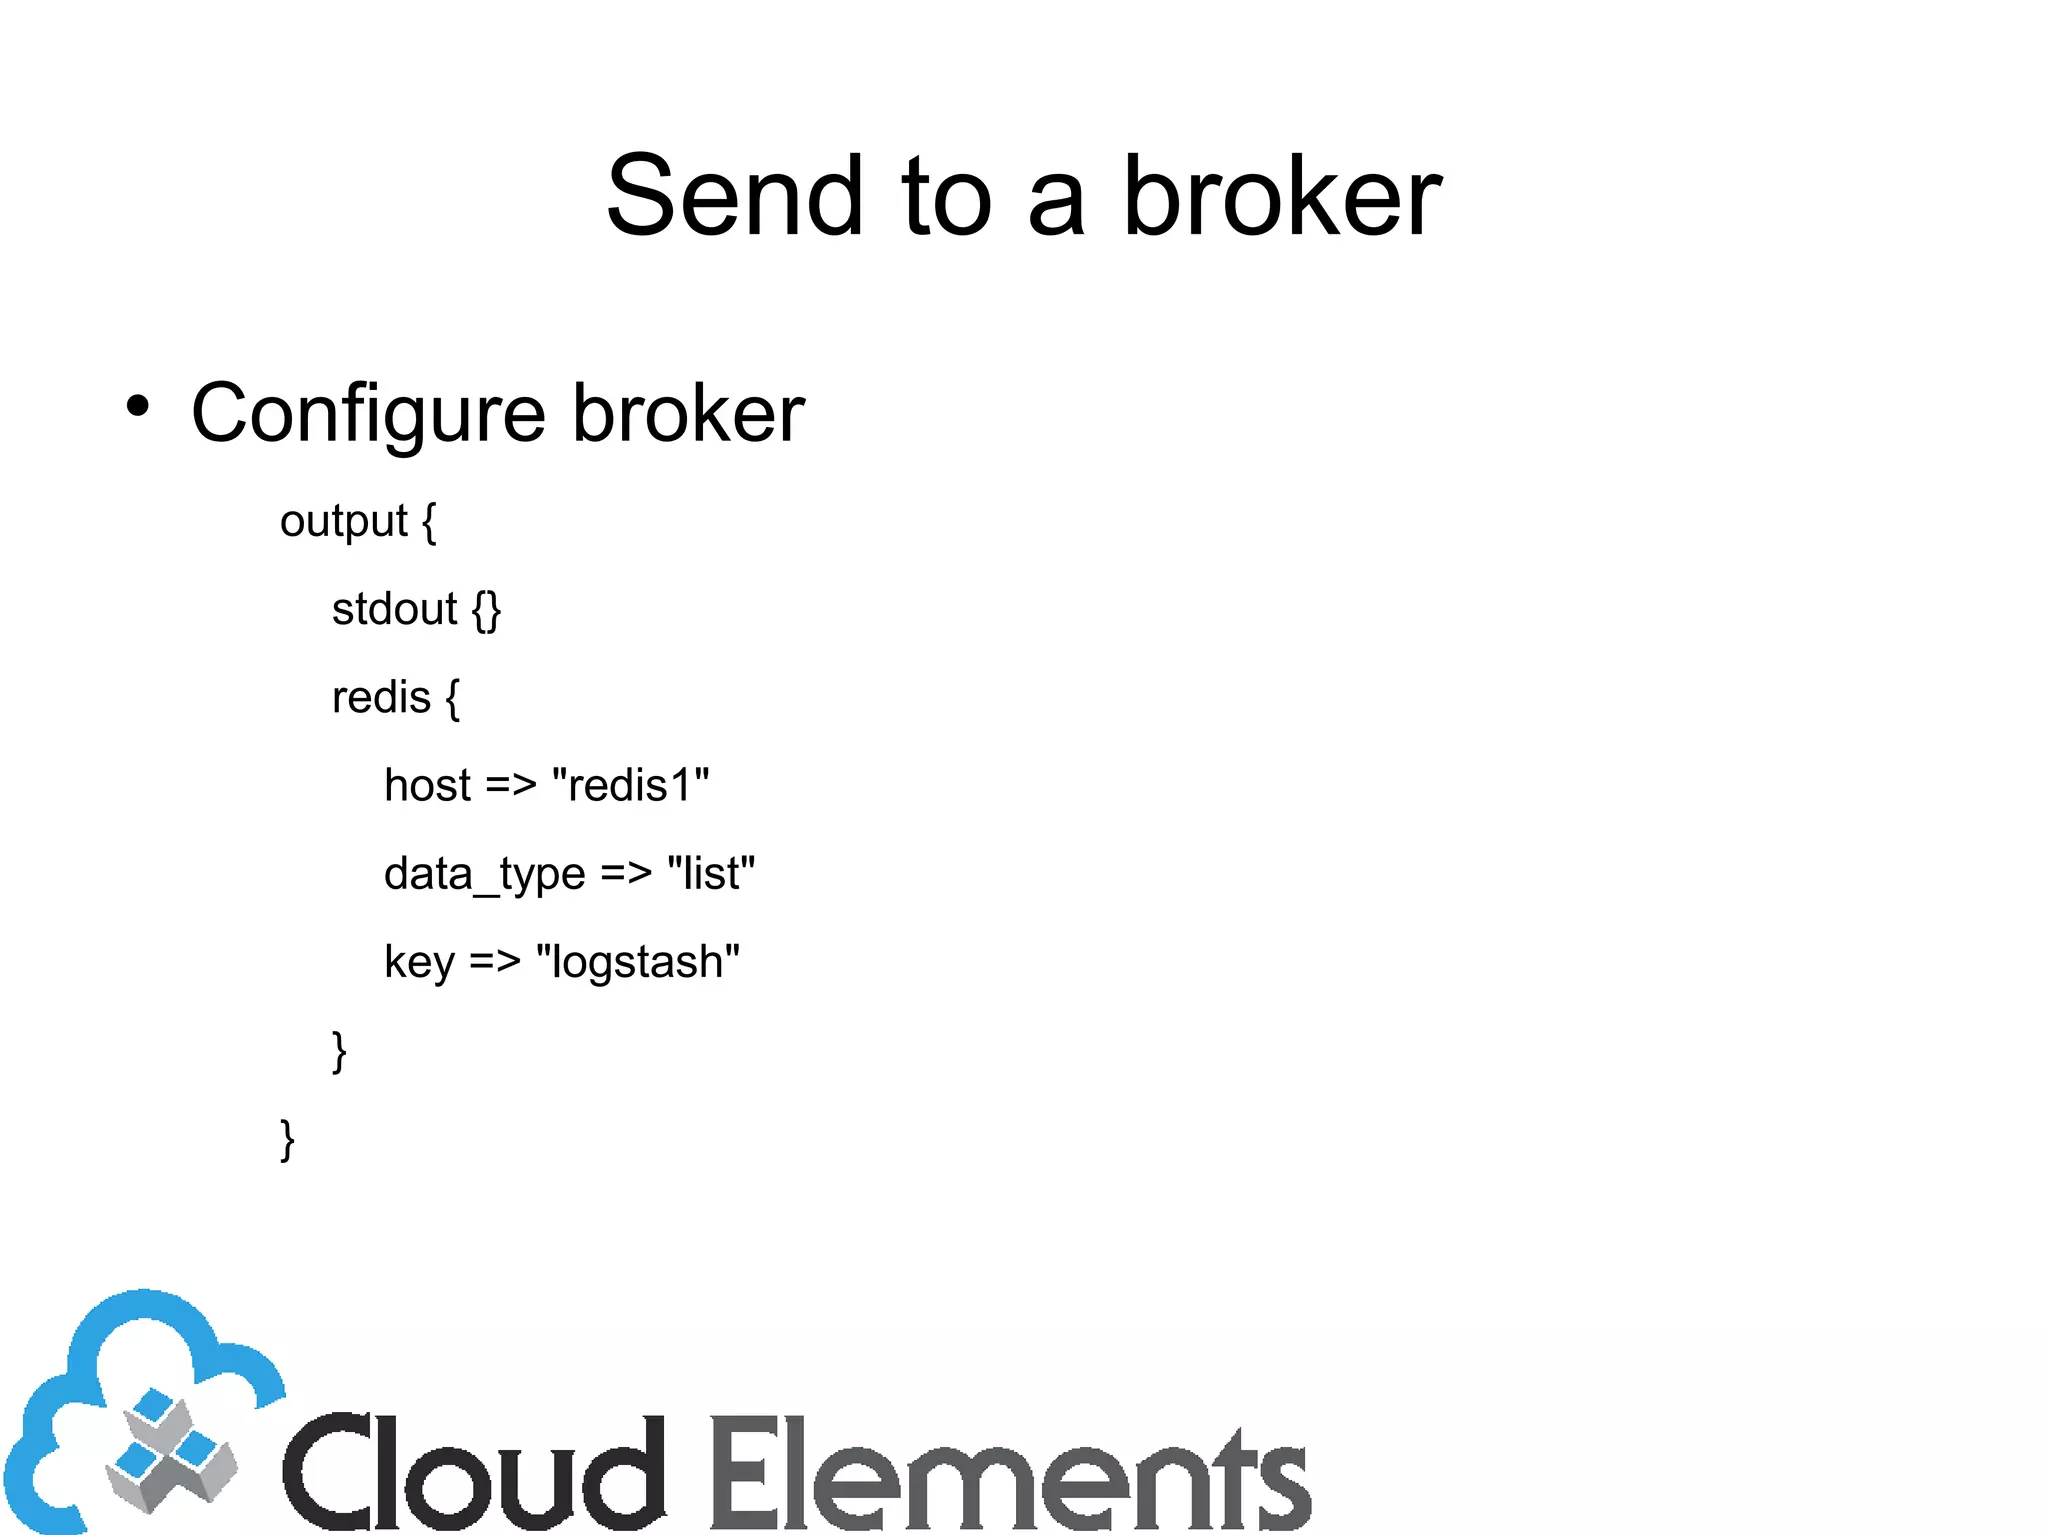
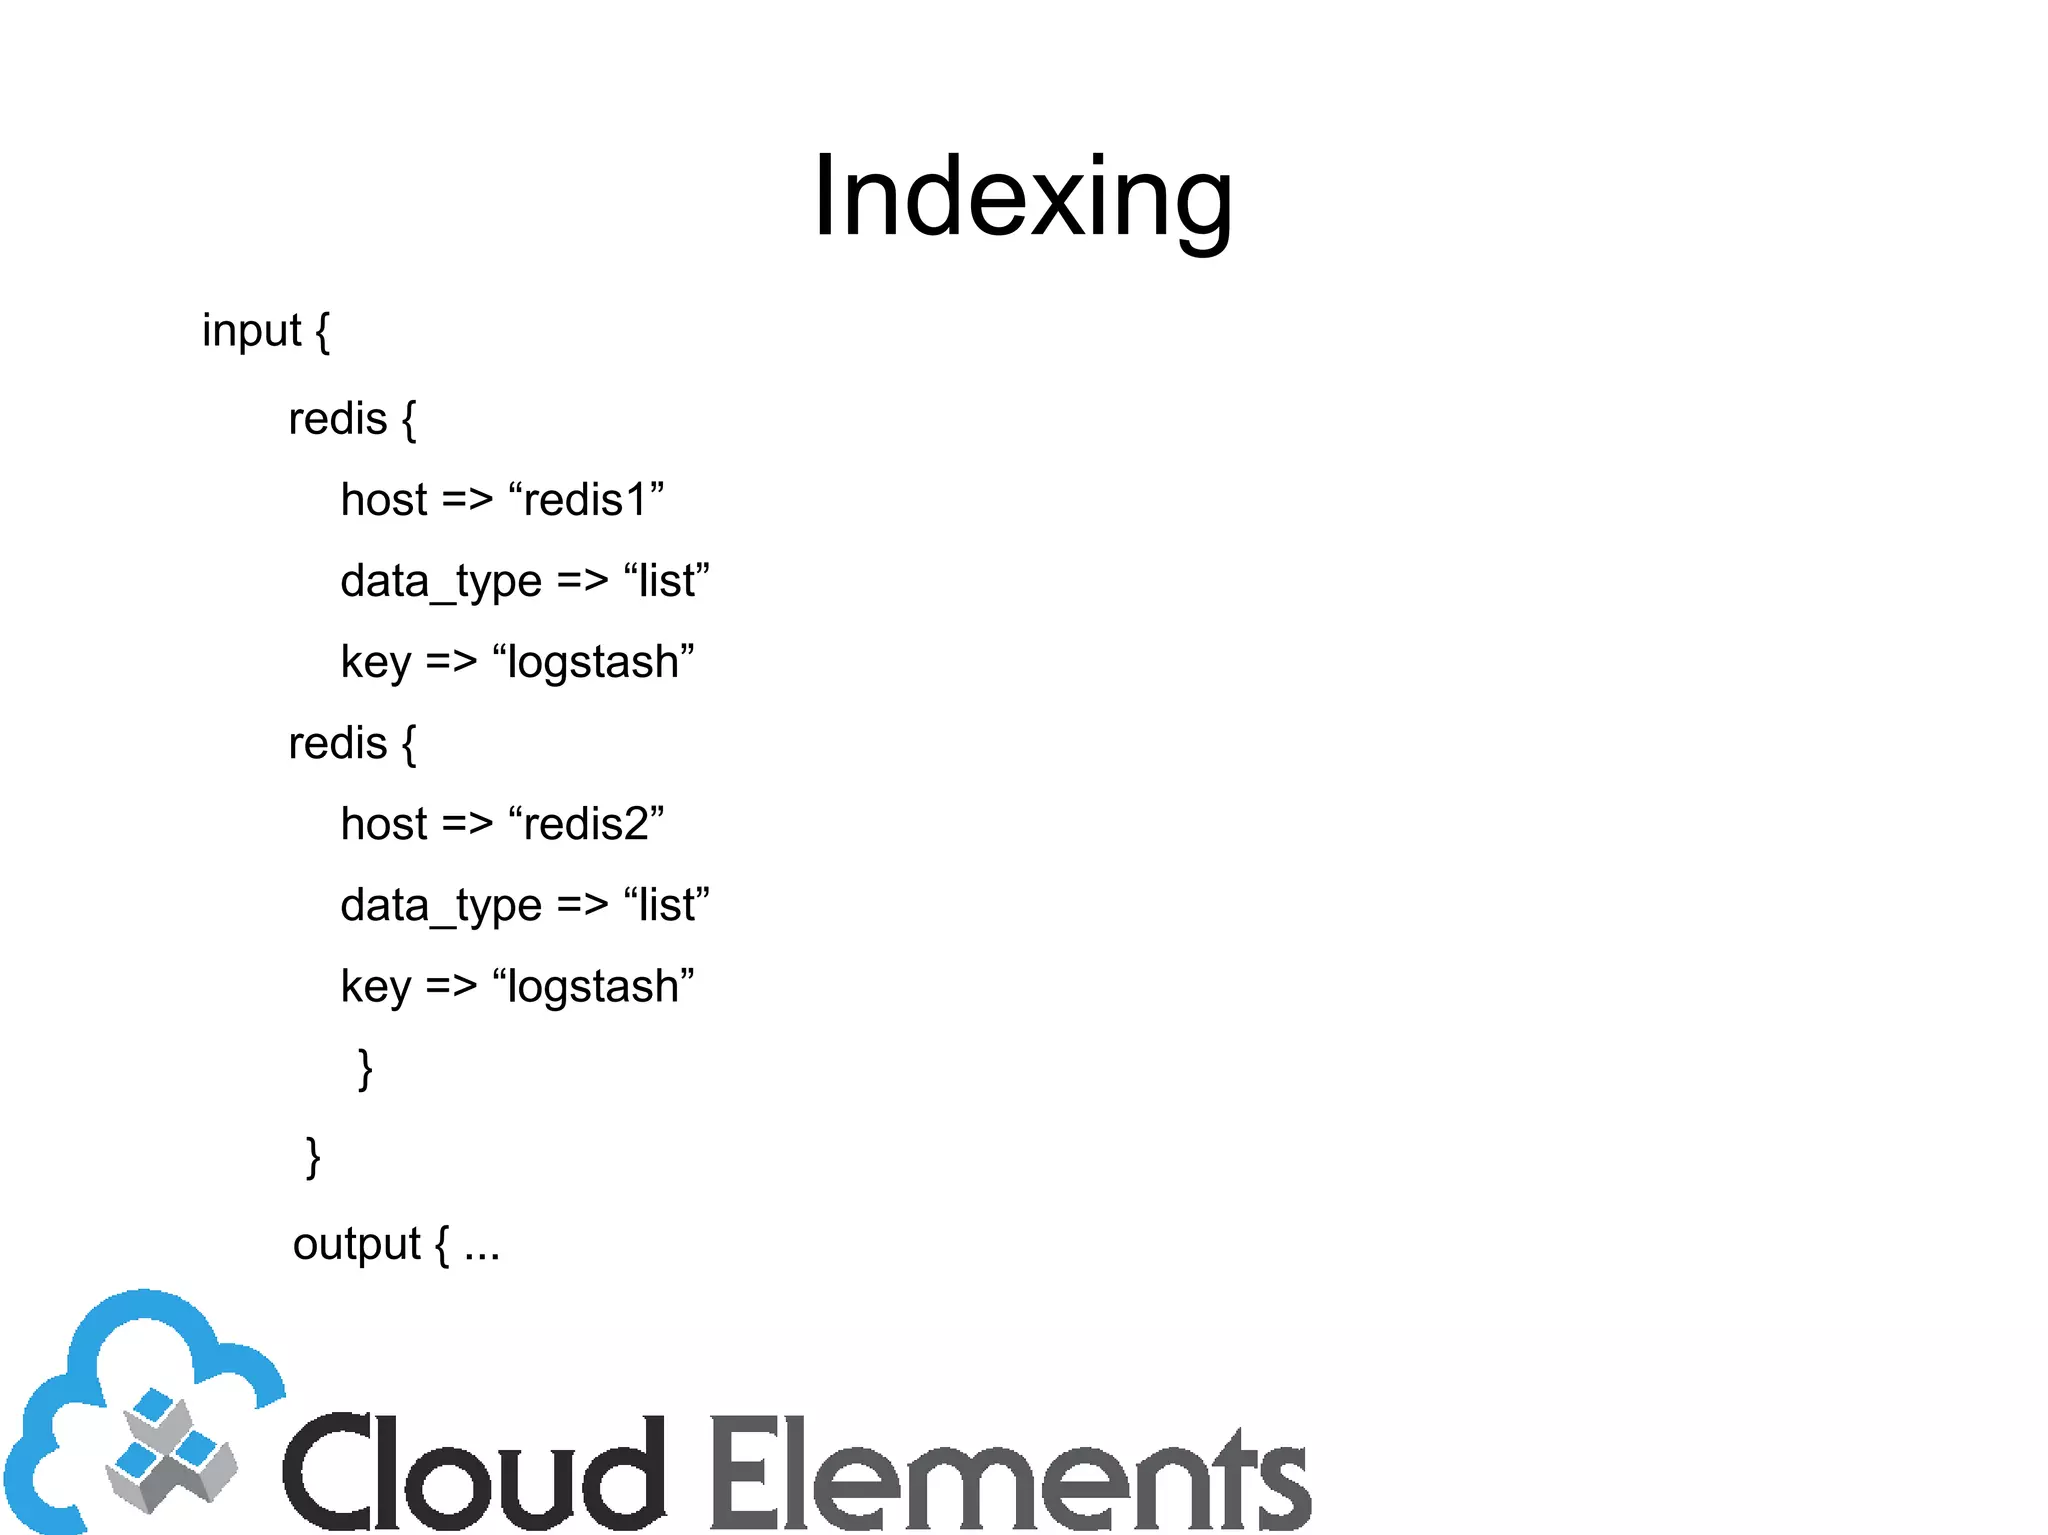
output {
stdout {}
redis {
host => ["redis1", “redis2”]
data_type => "list"
shuffle_hosts => true
key => "logstash"
}
}](https://image.slidesharecdn.com/logstash-140409105729-phpapp02/75/Scalable-Logging-and-Analytics-with-LogStash-21-2048.jpg)

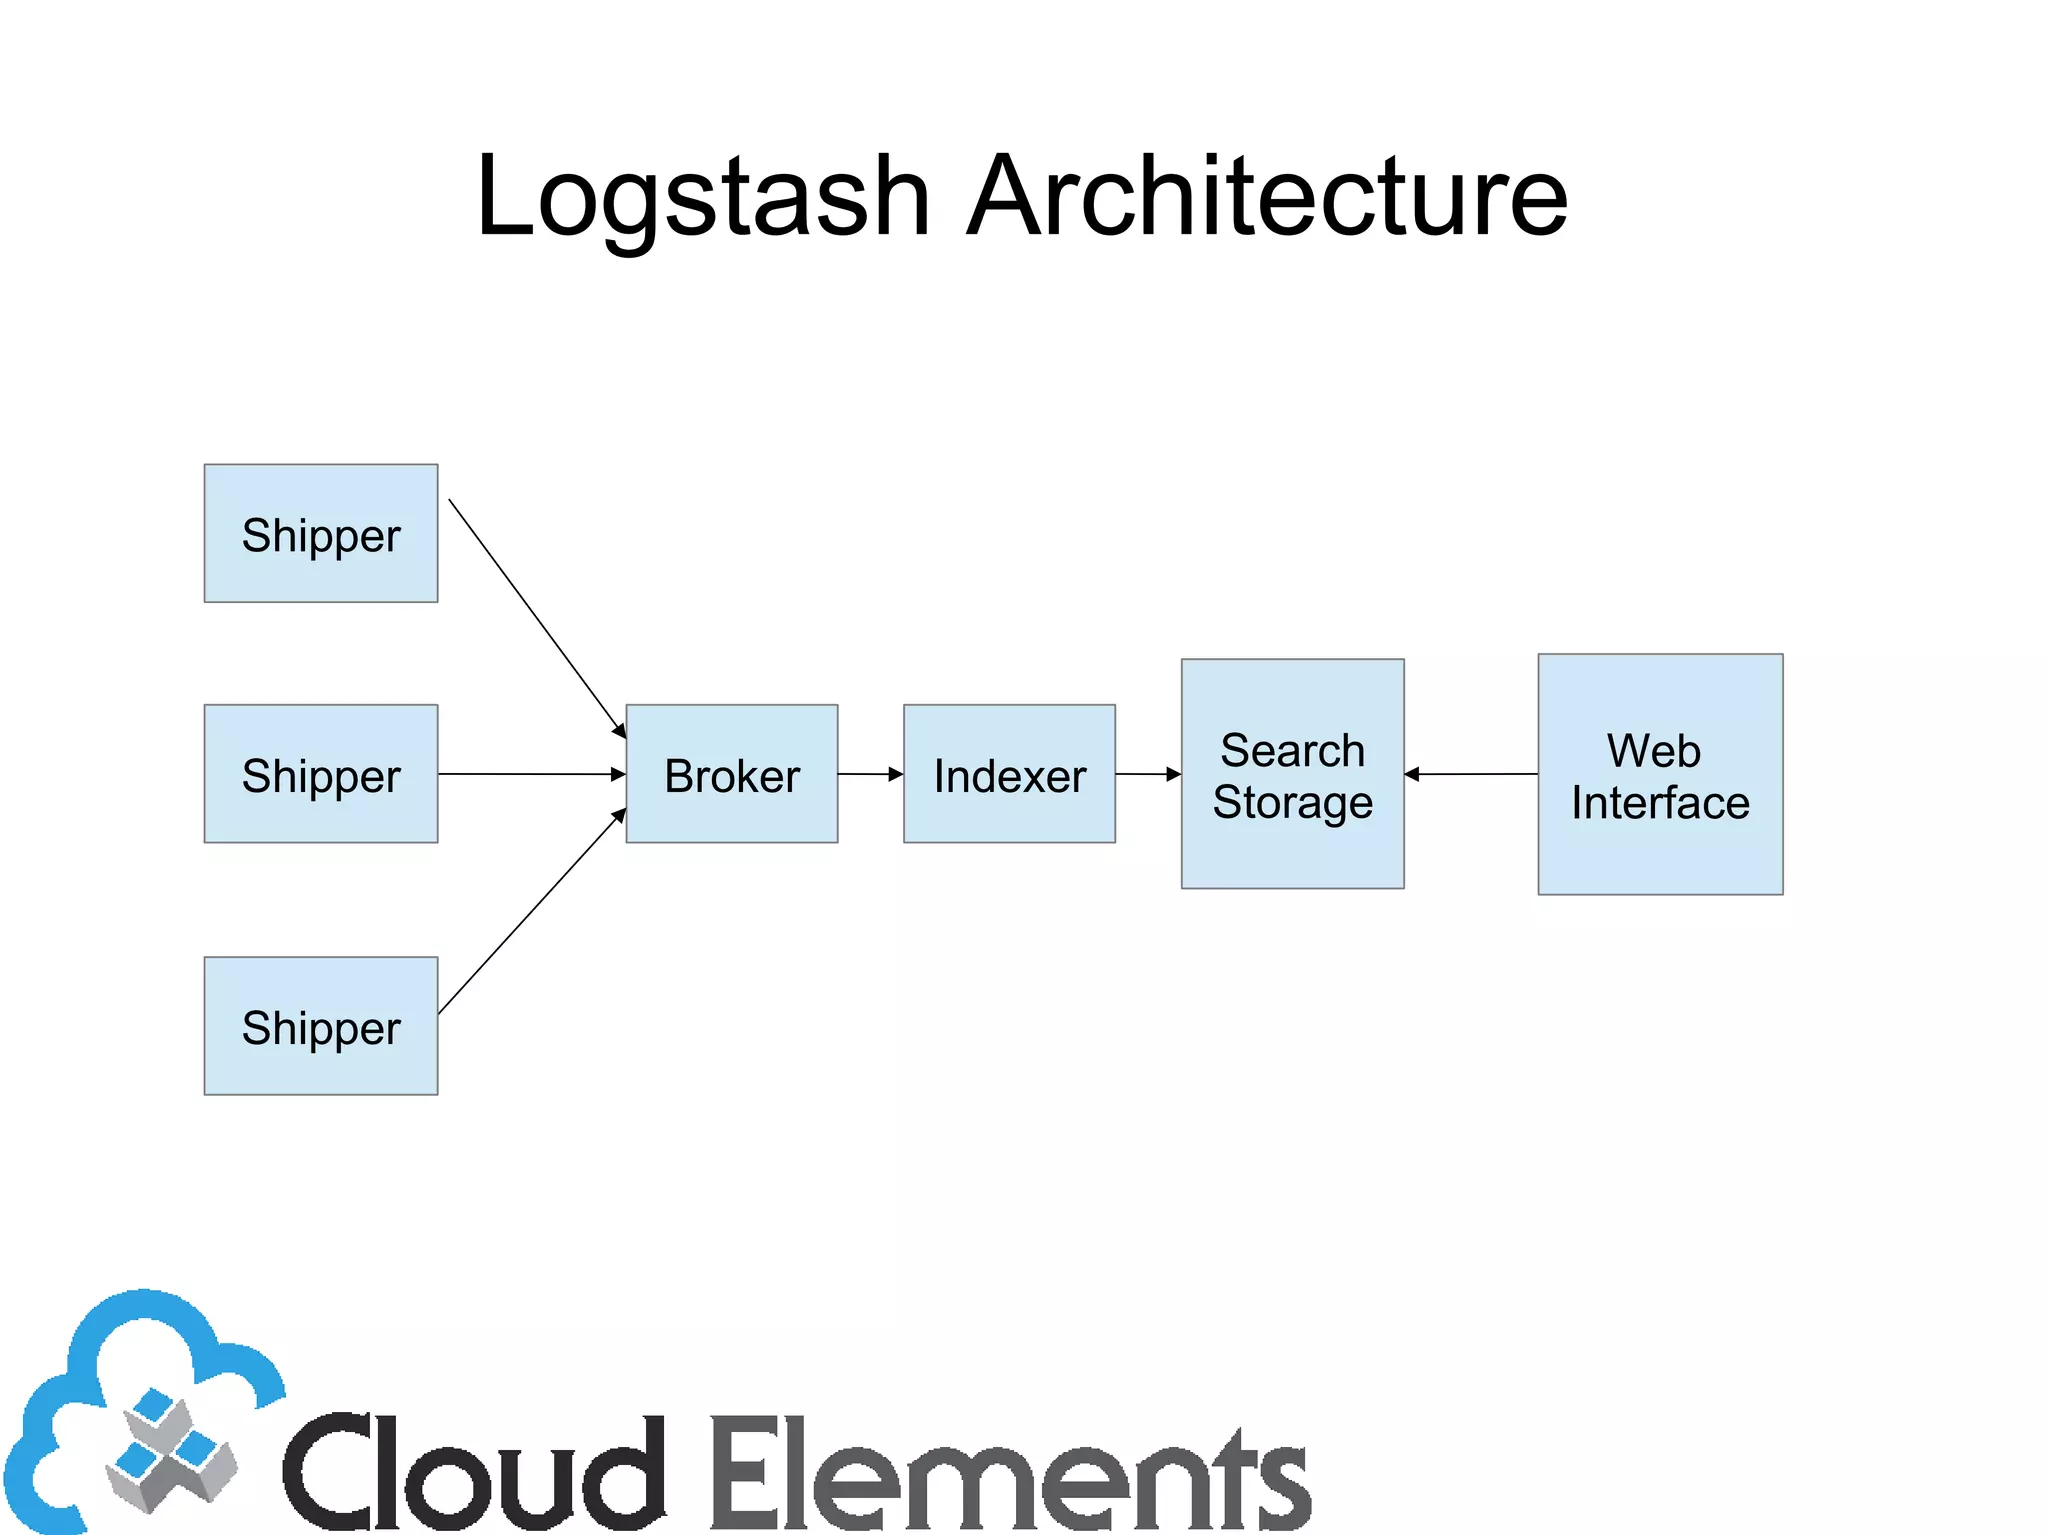
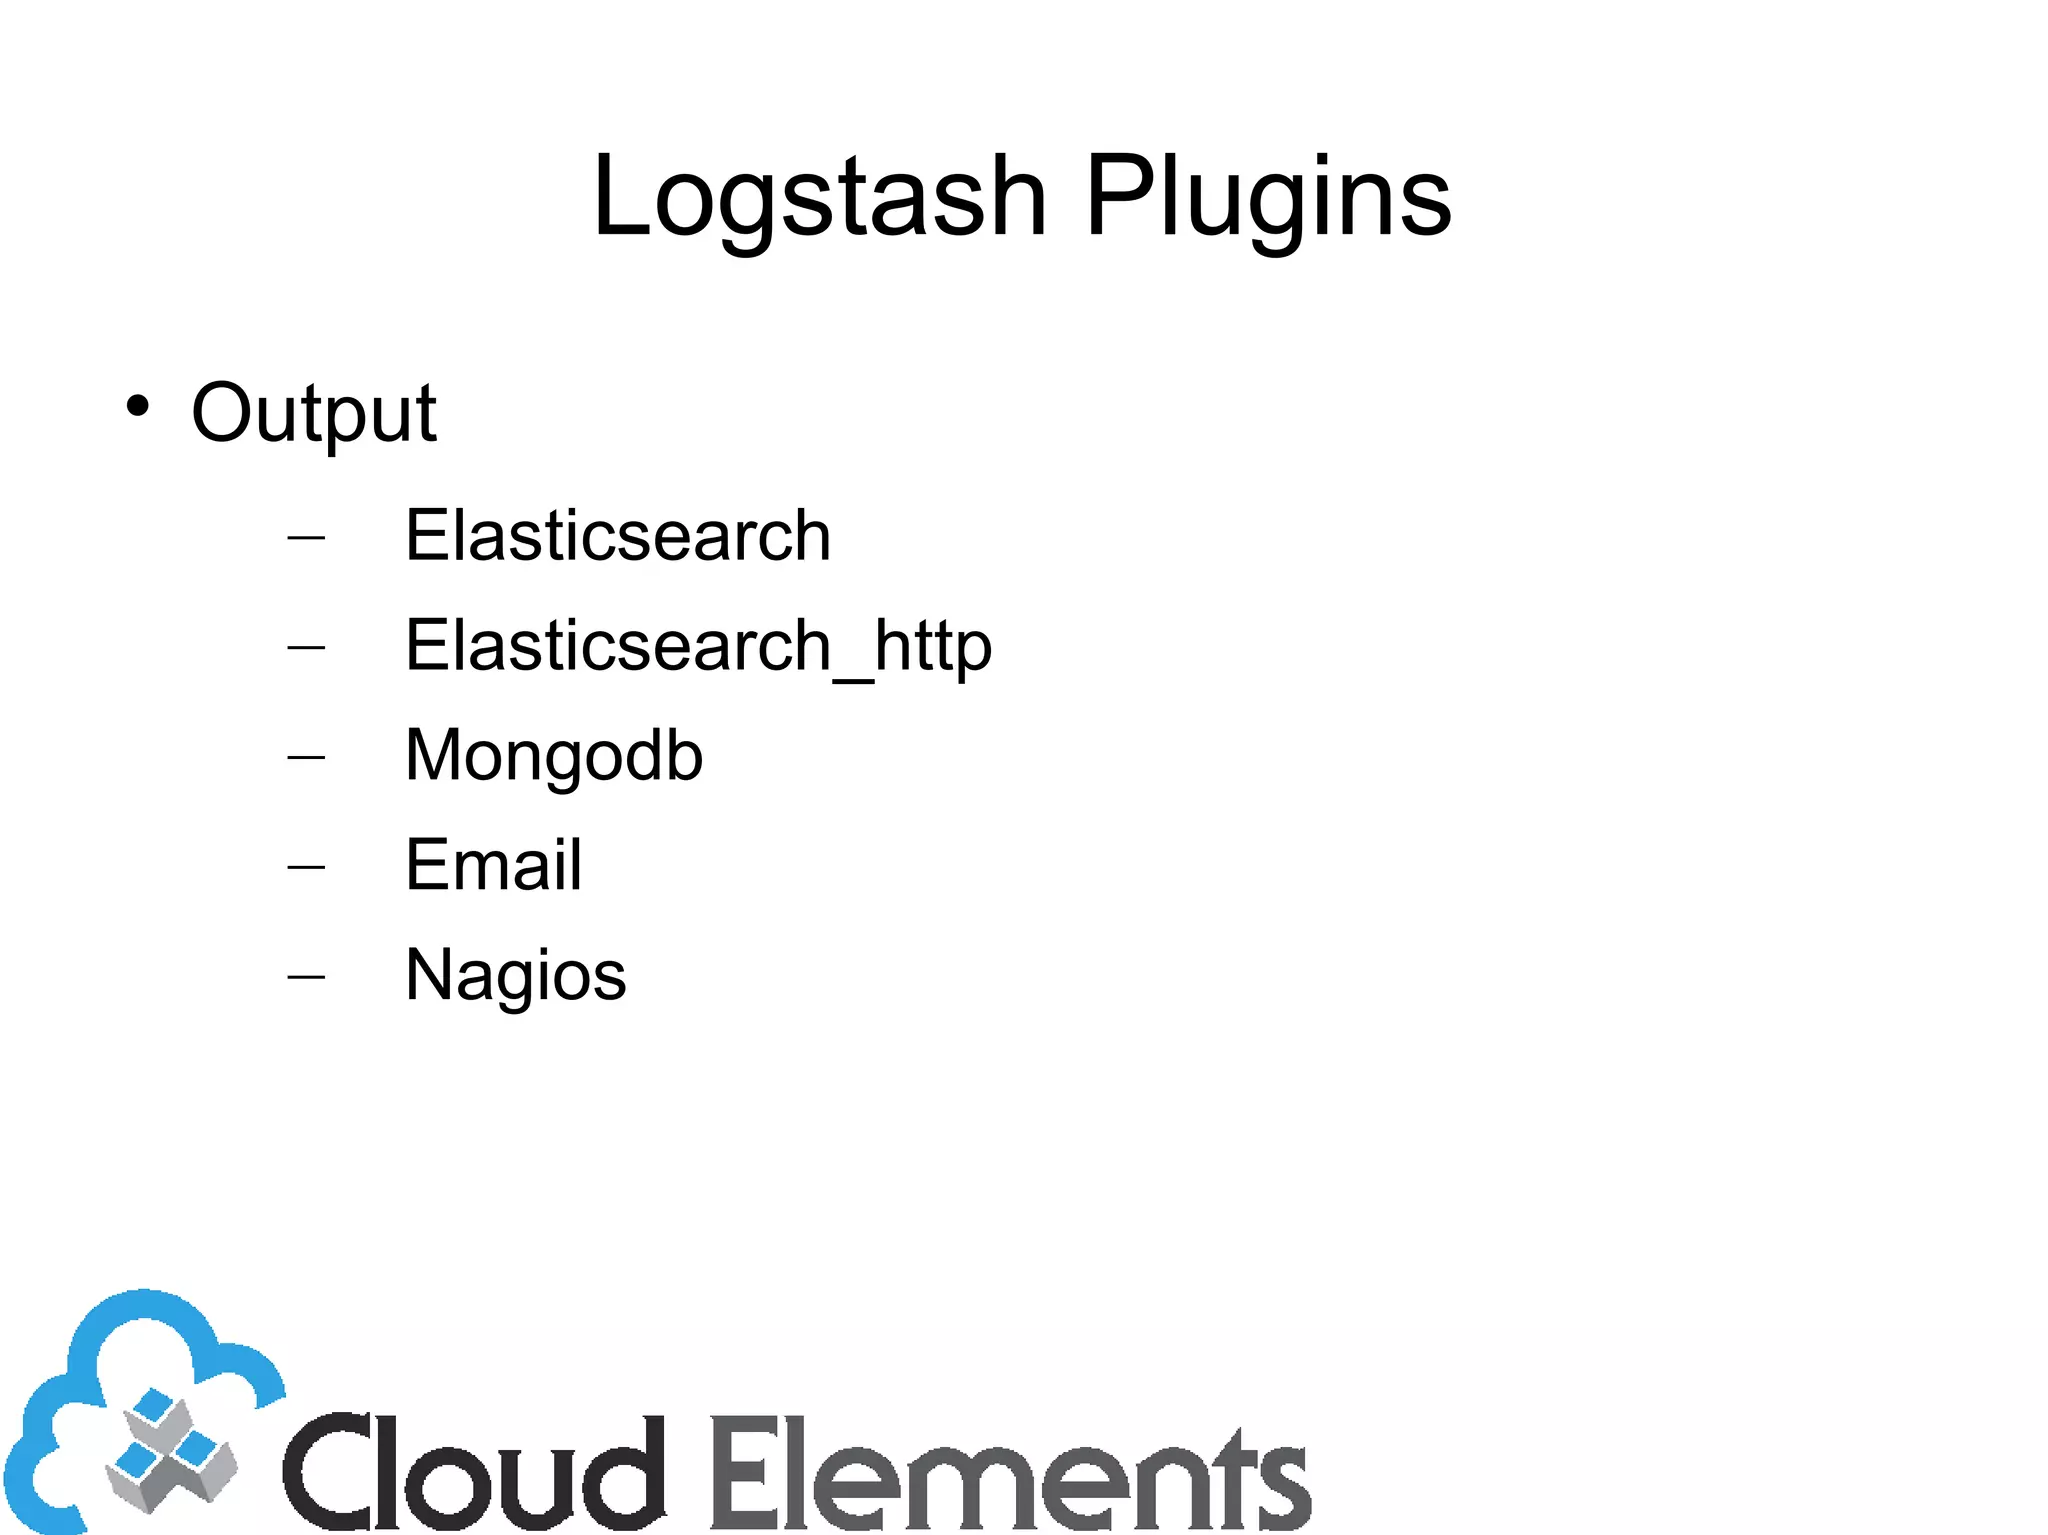
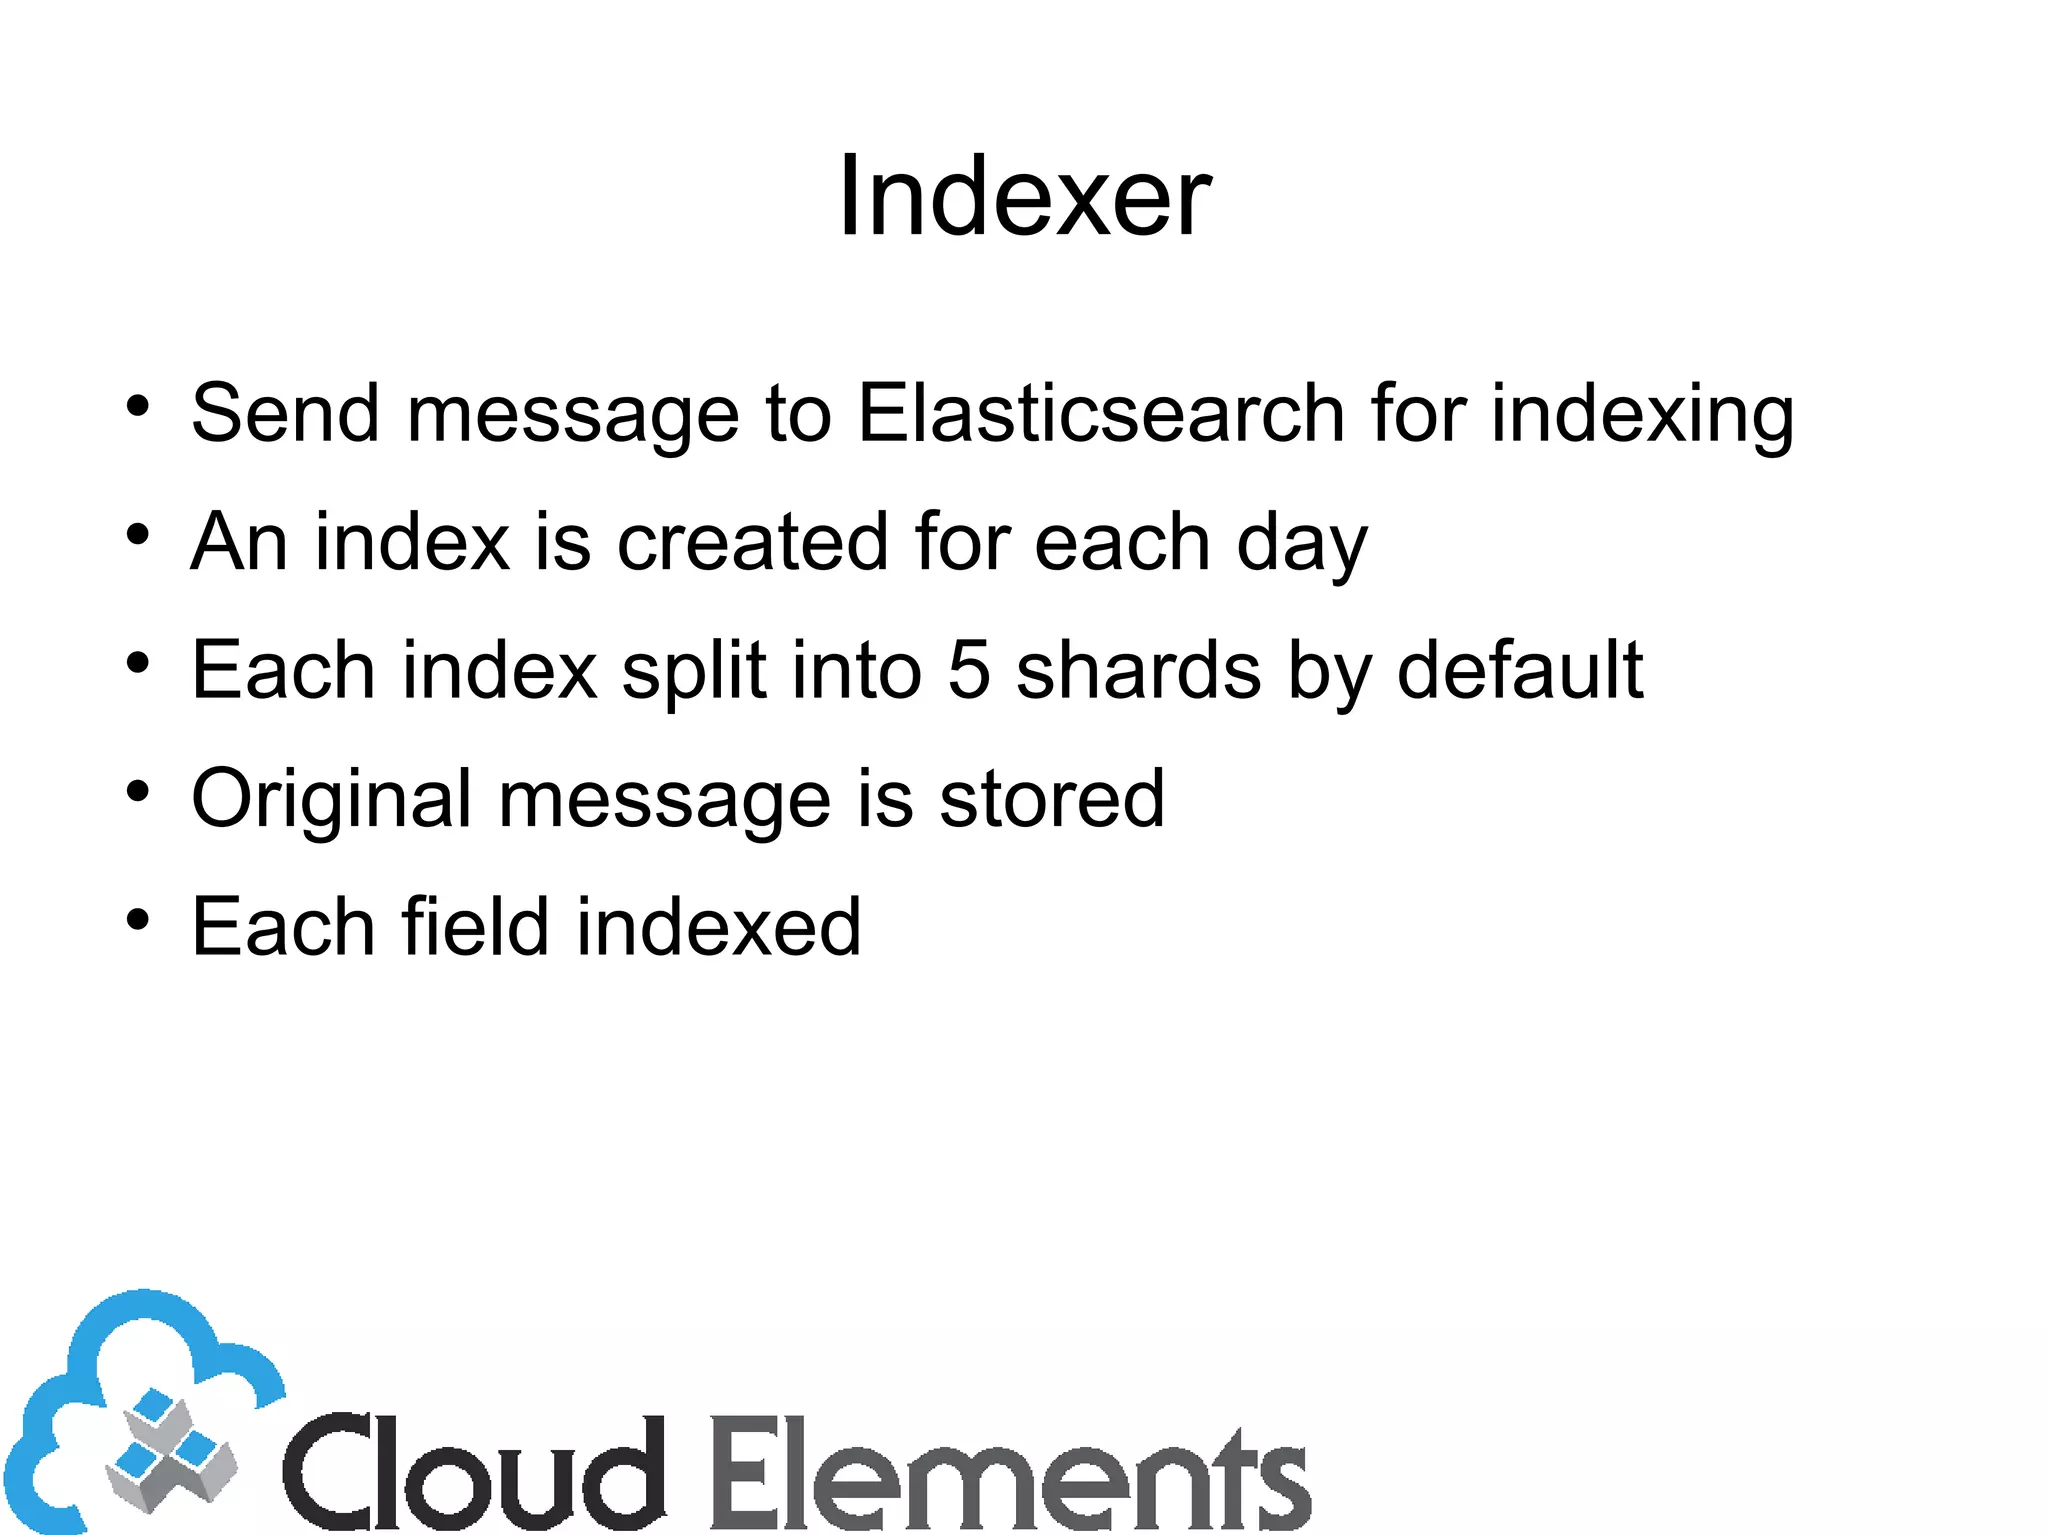
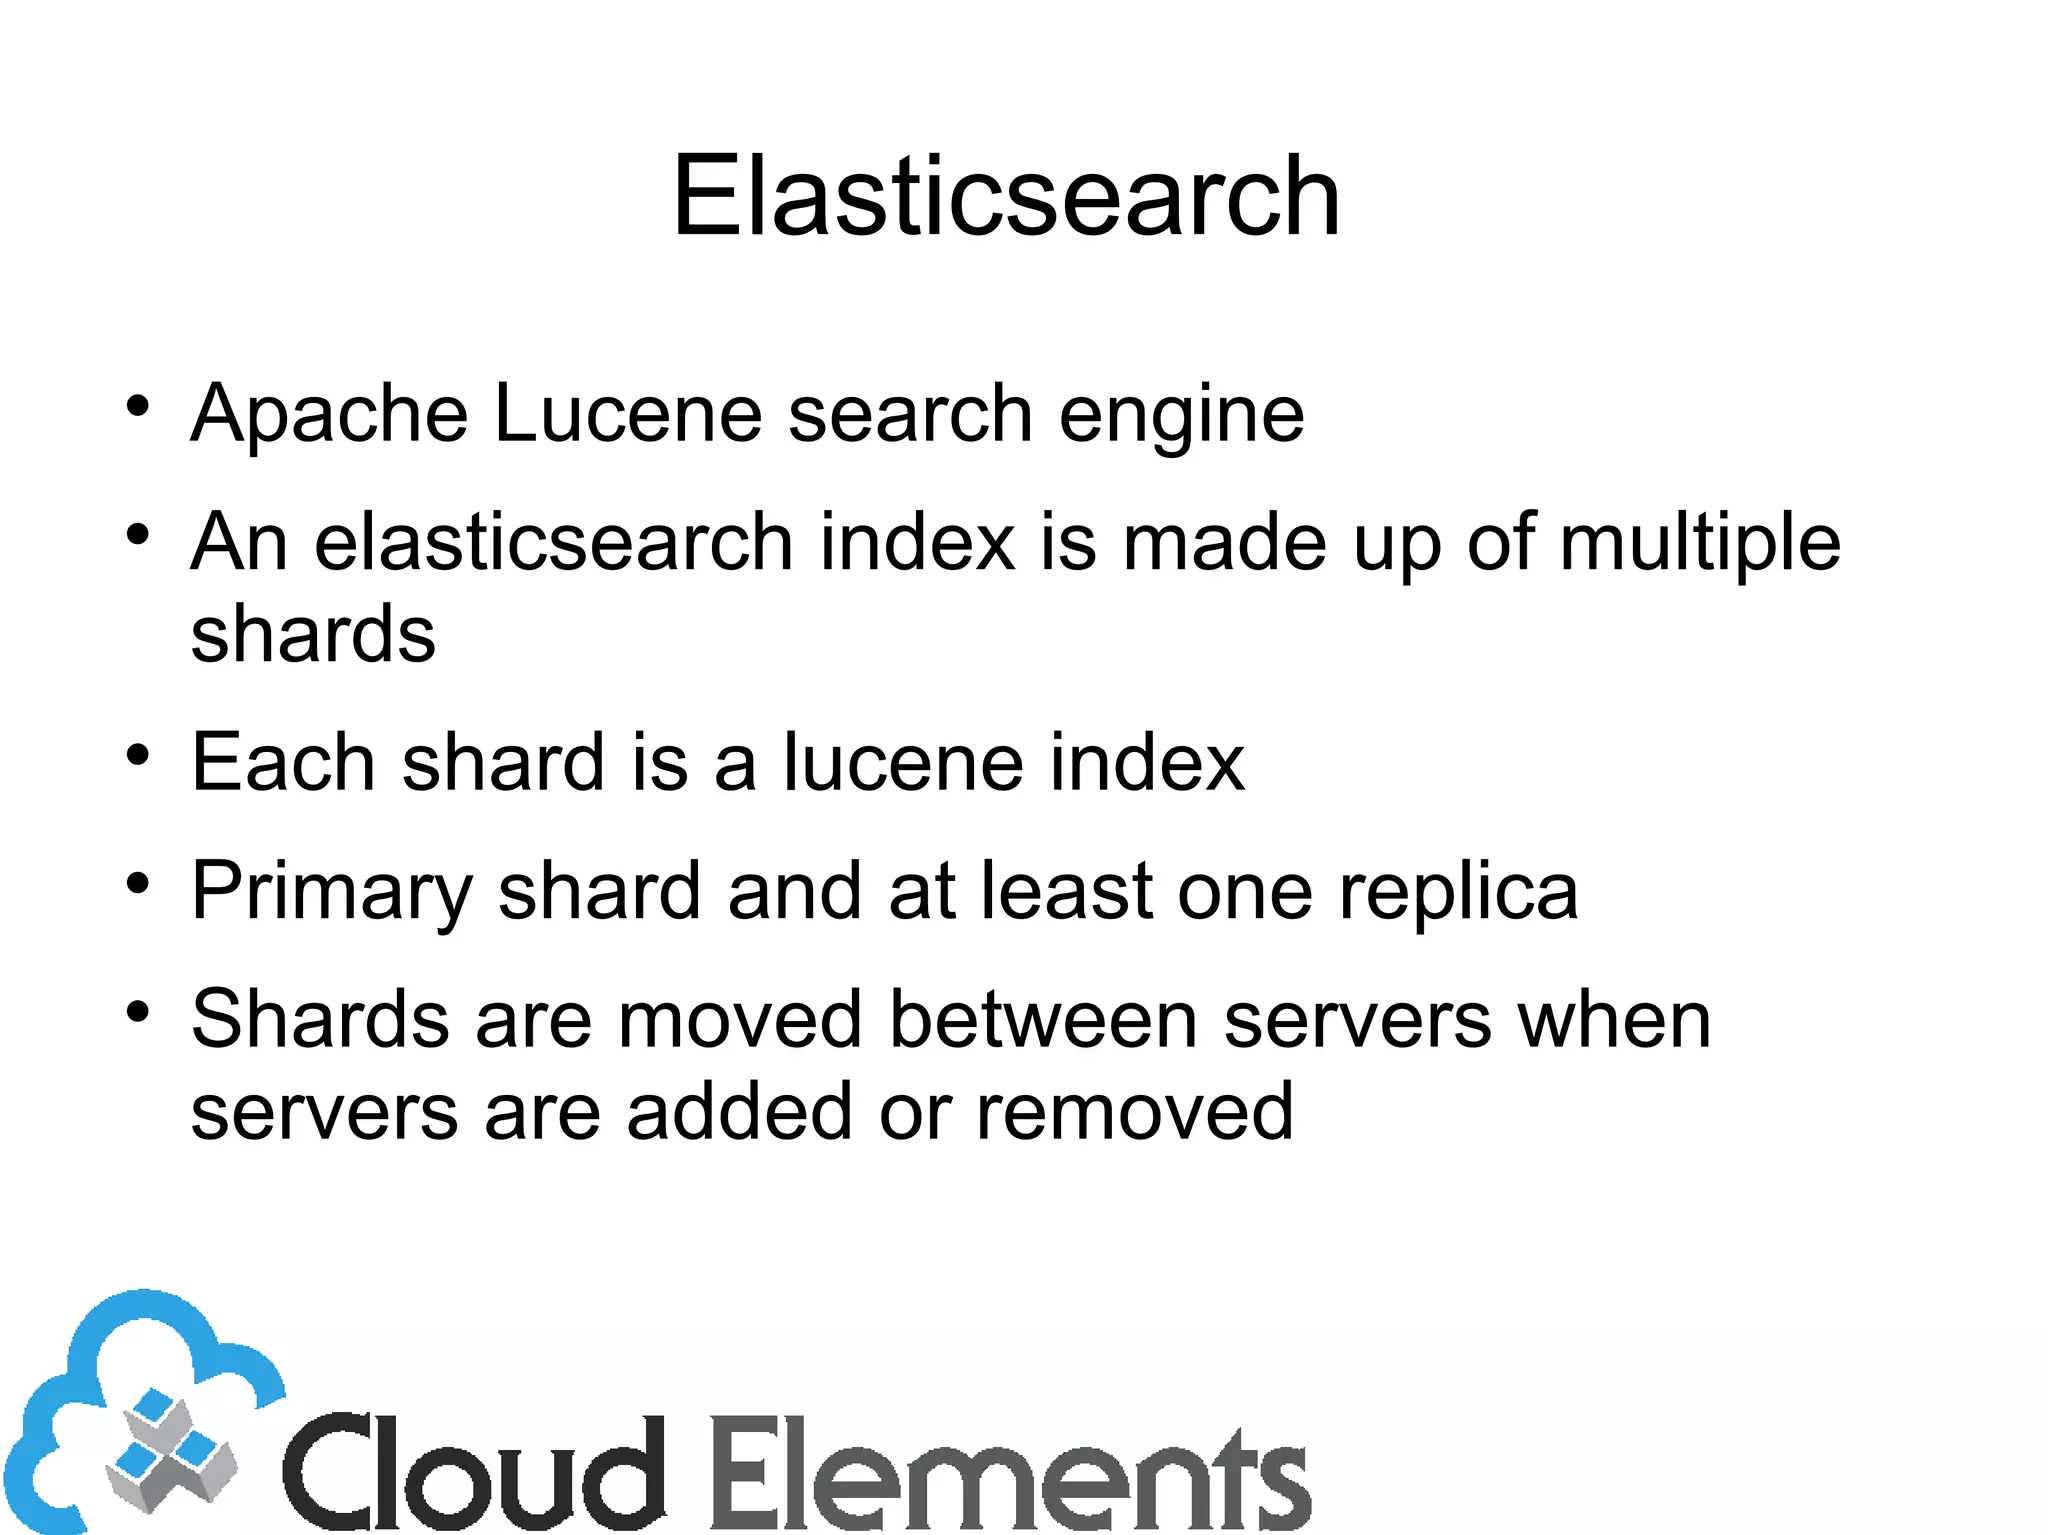
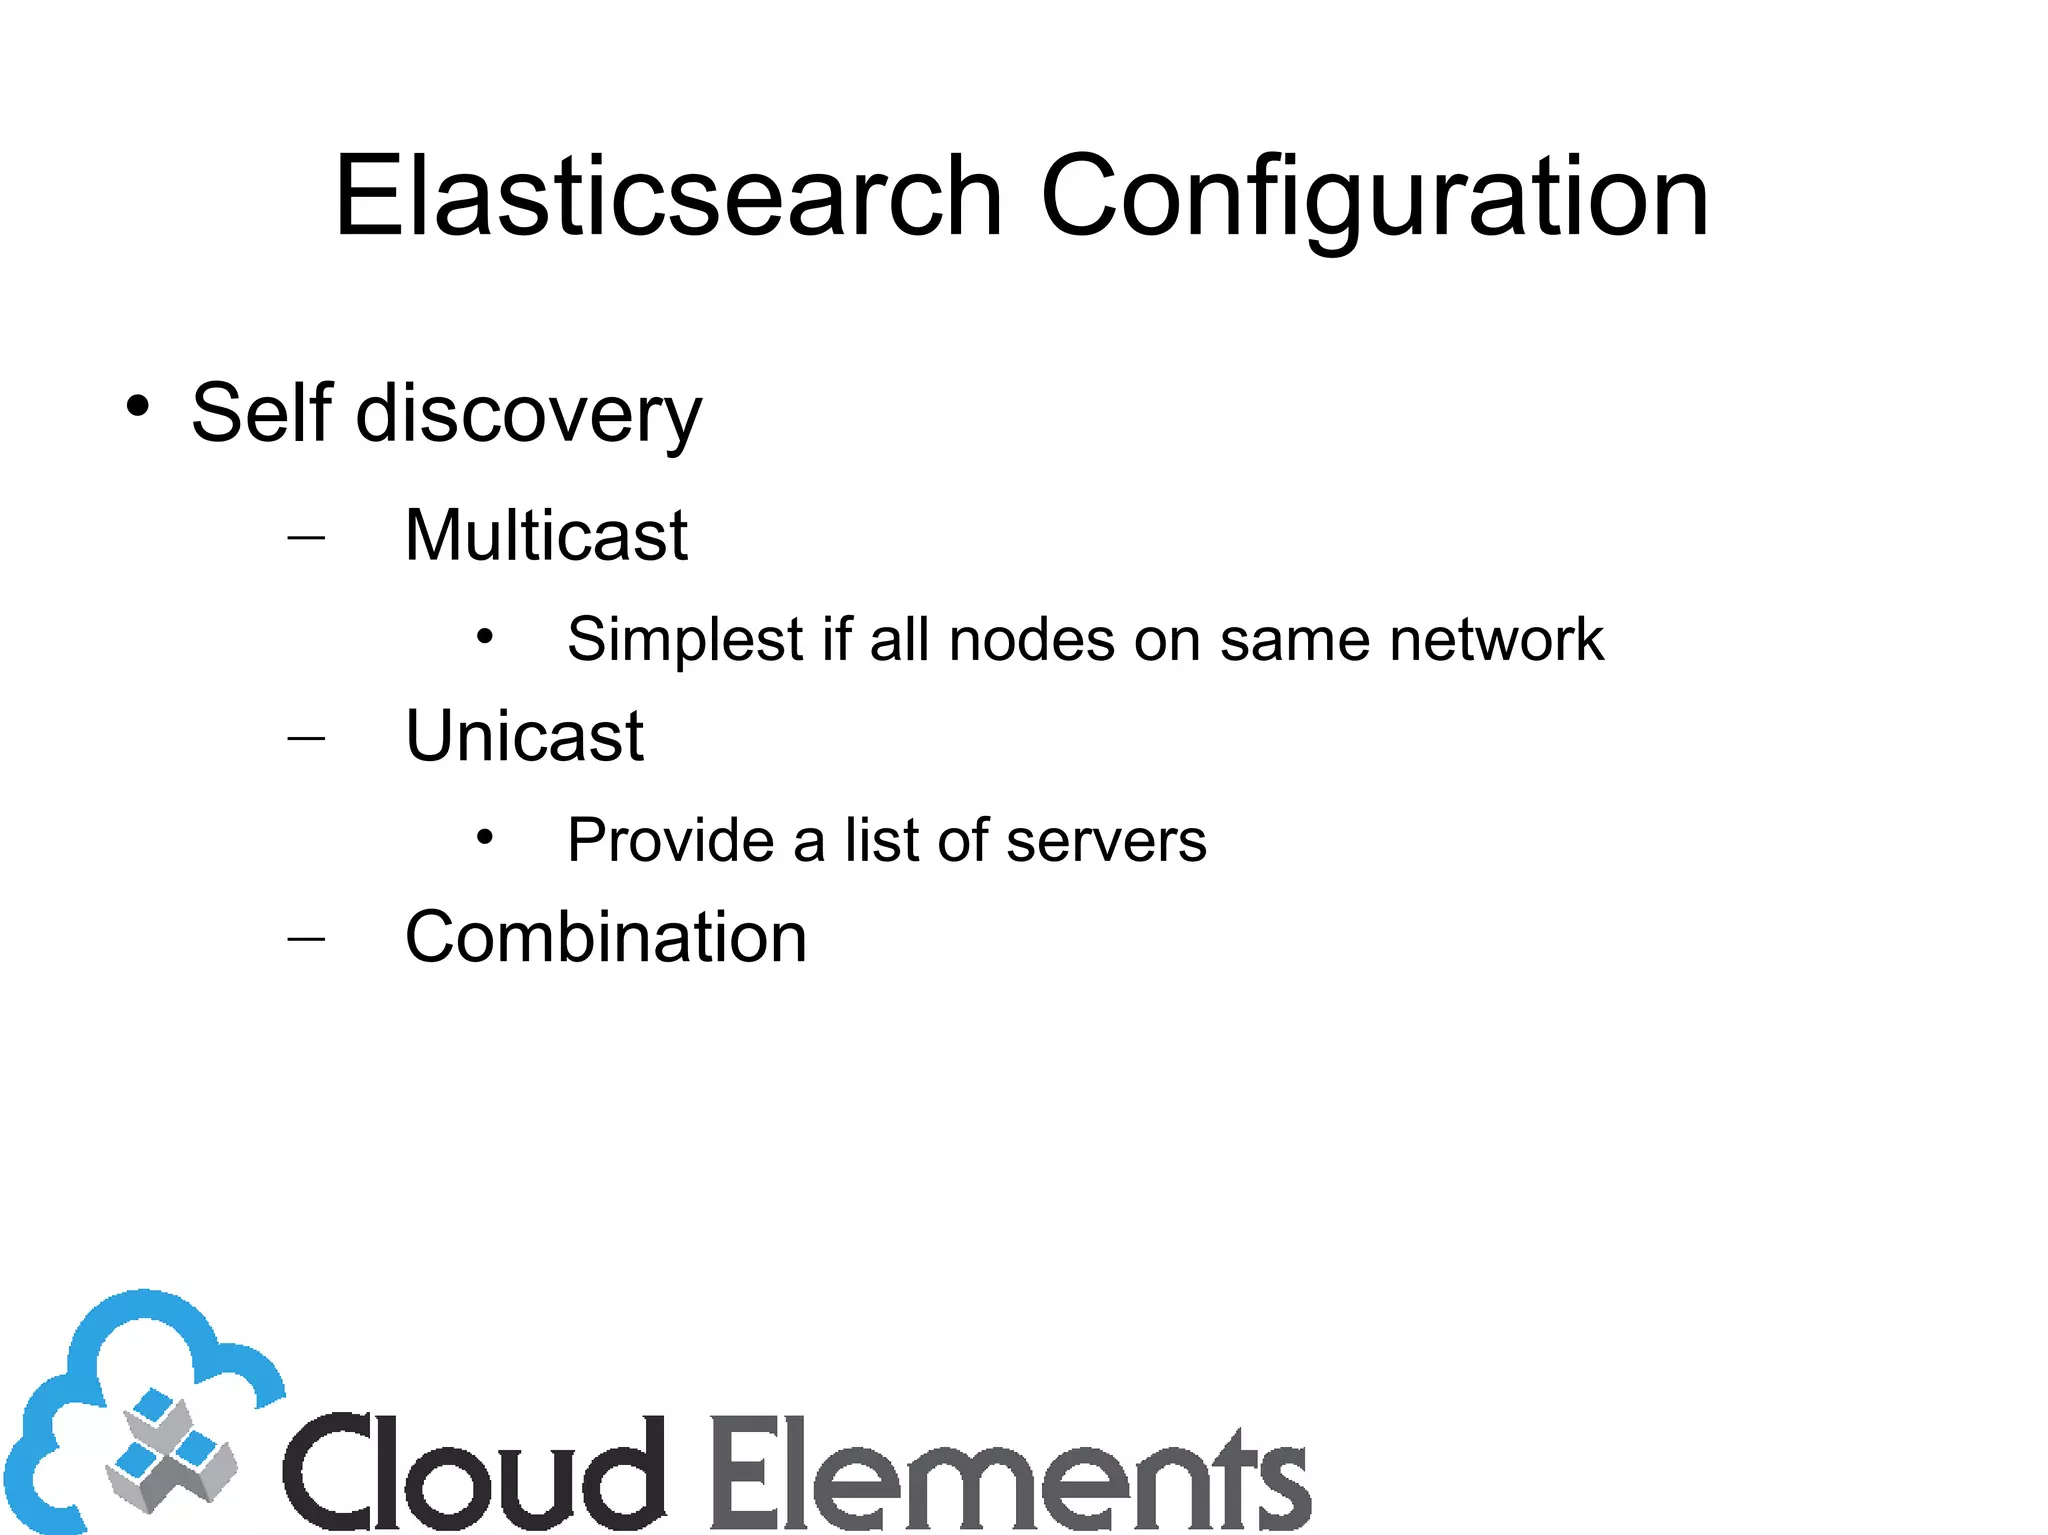
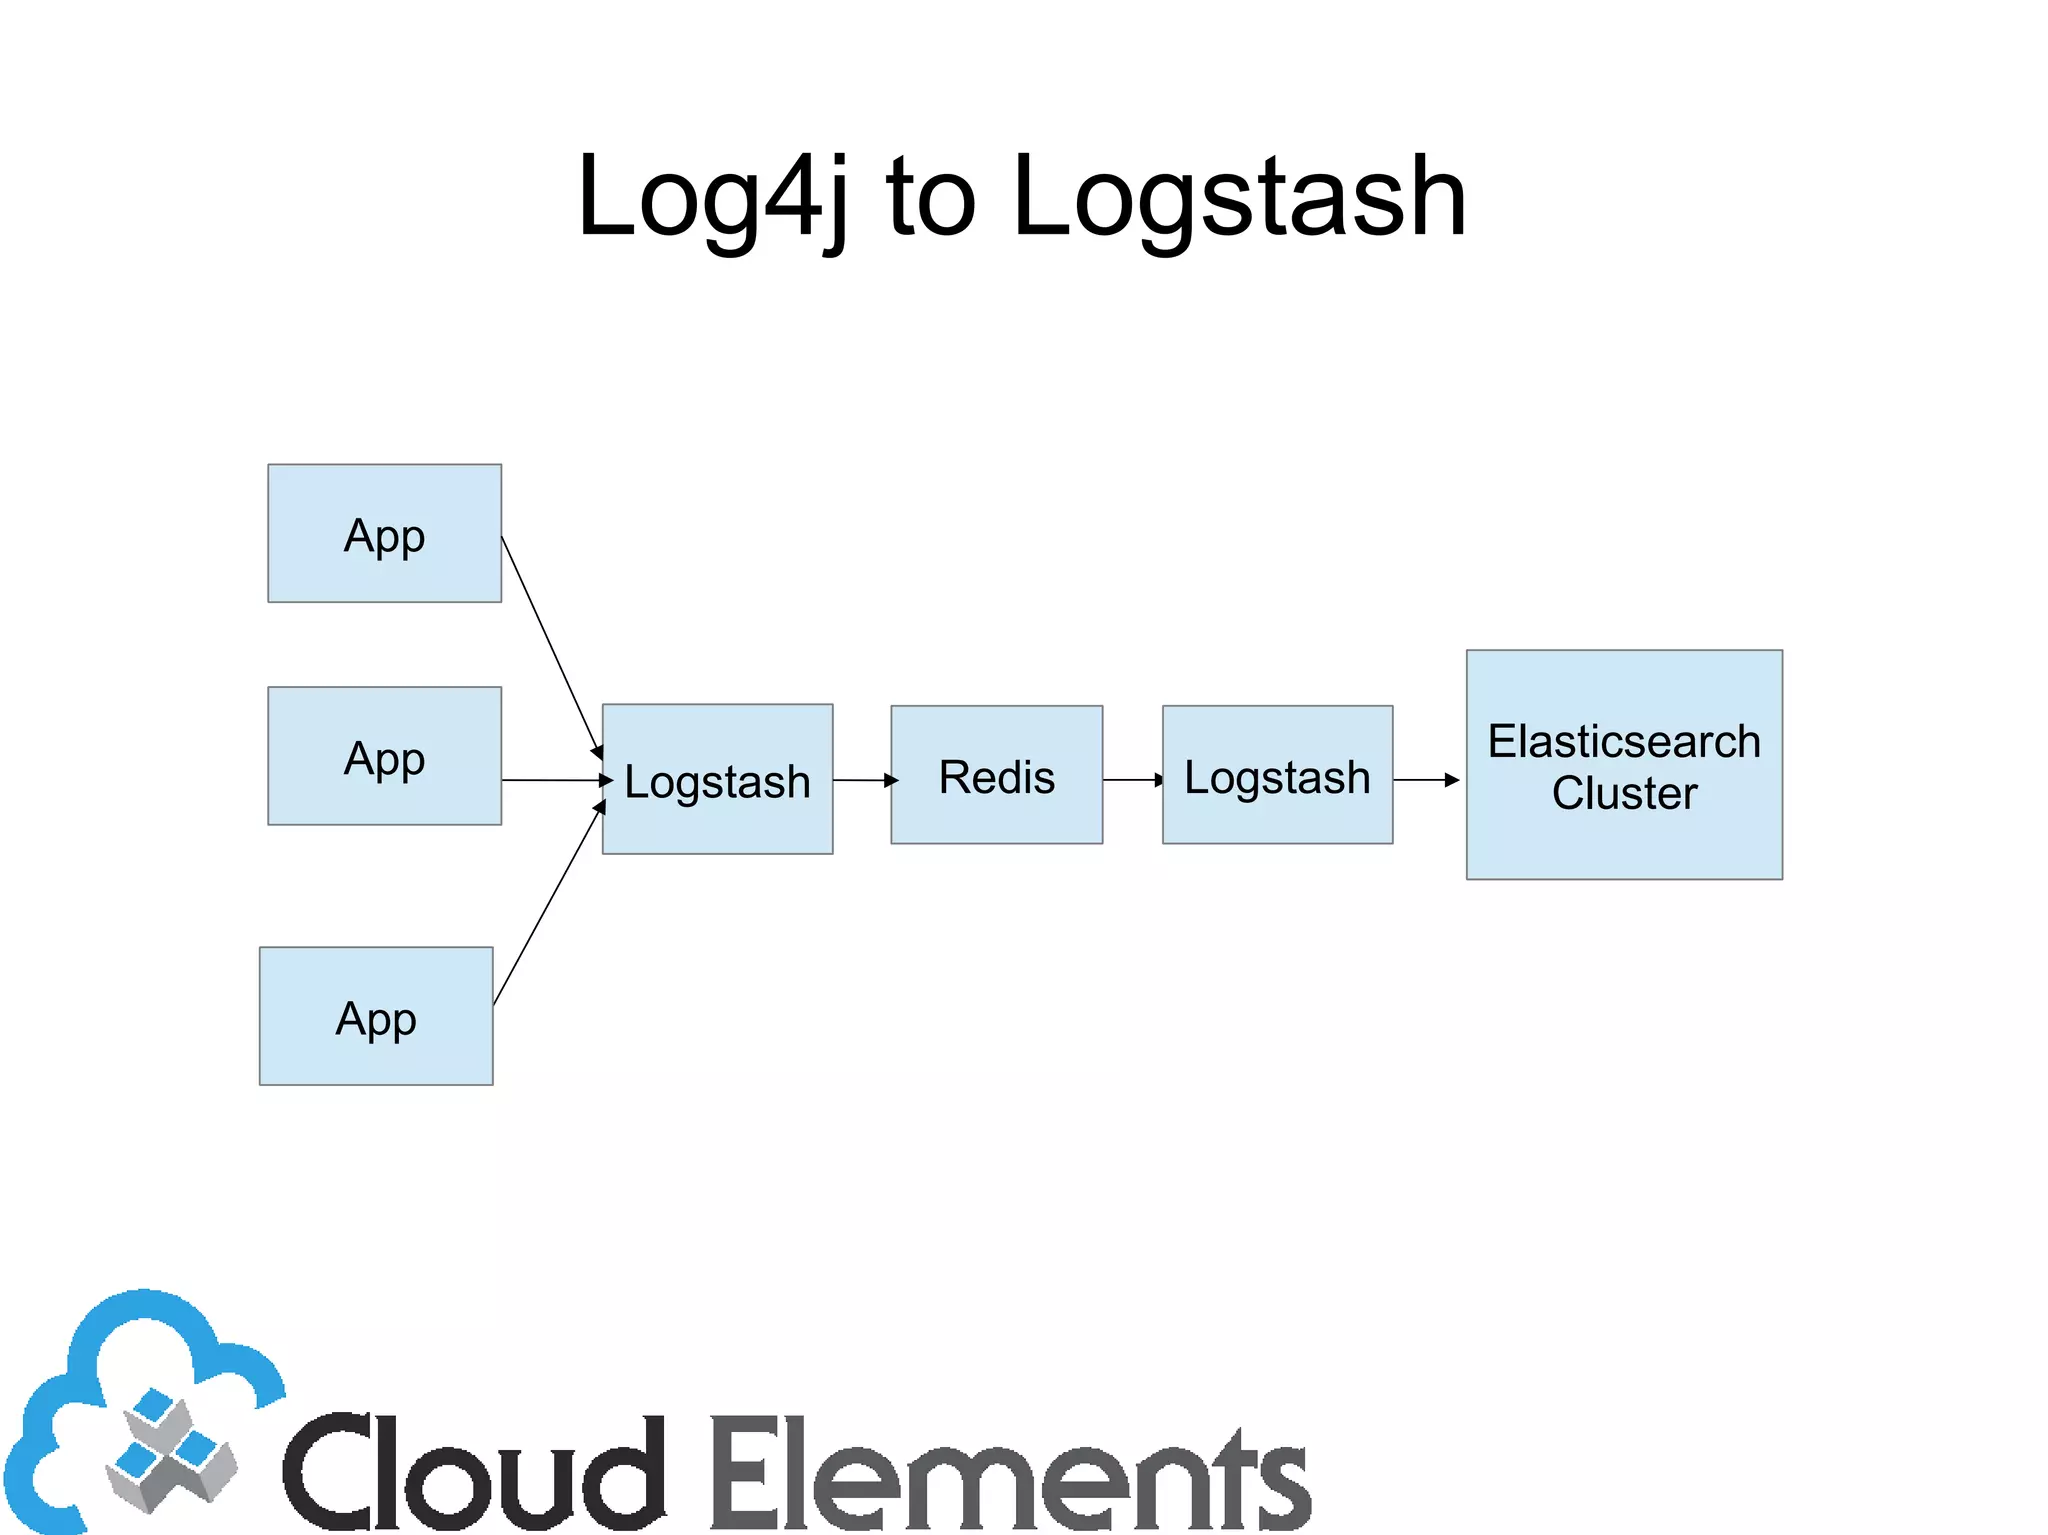
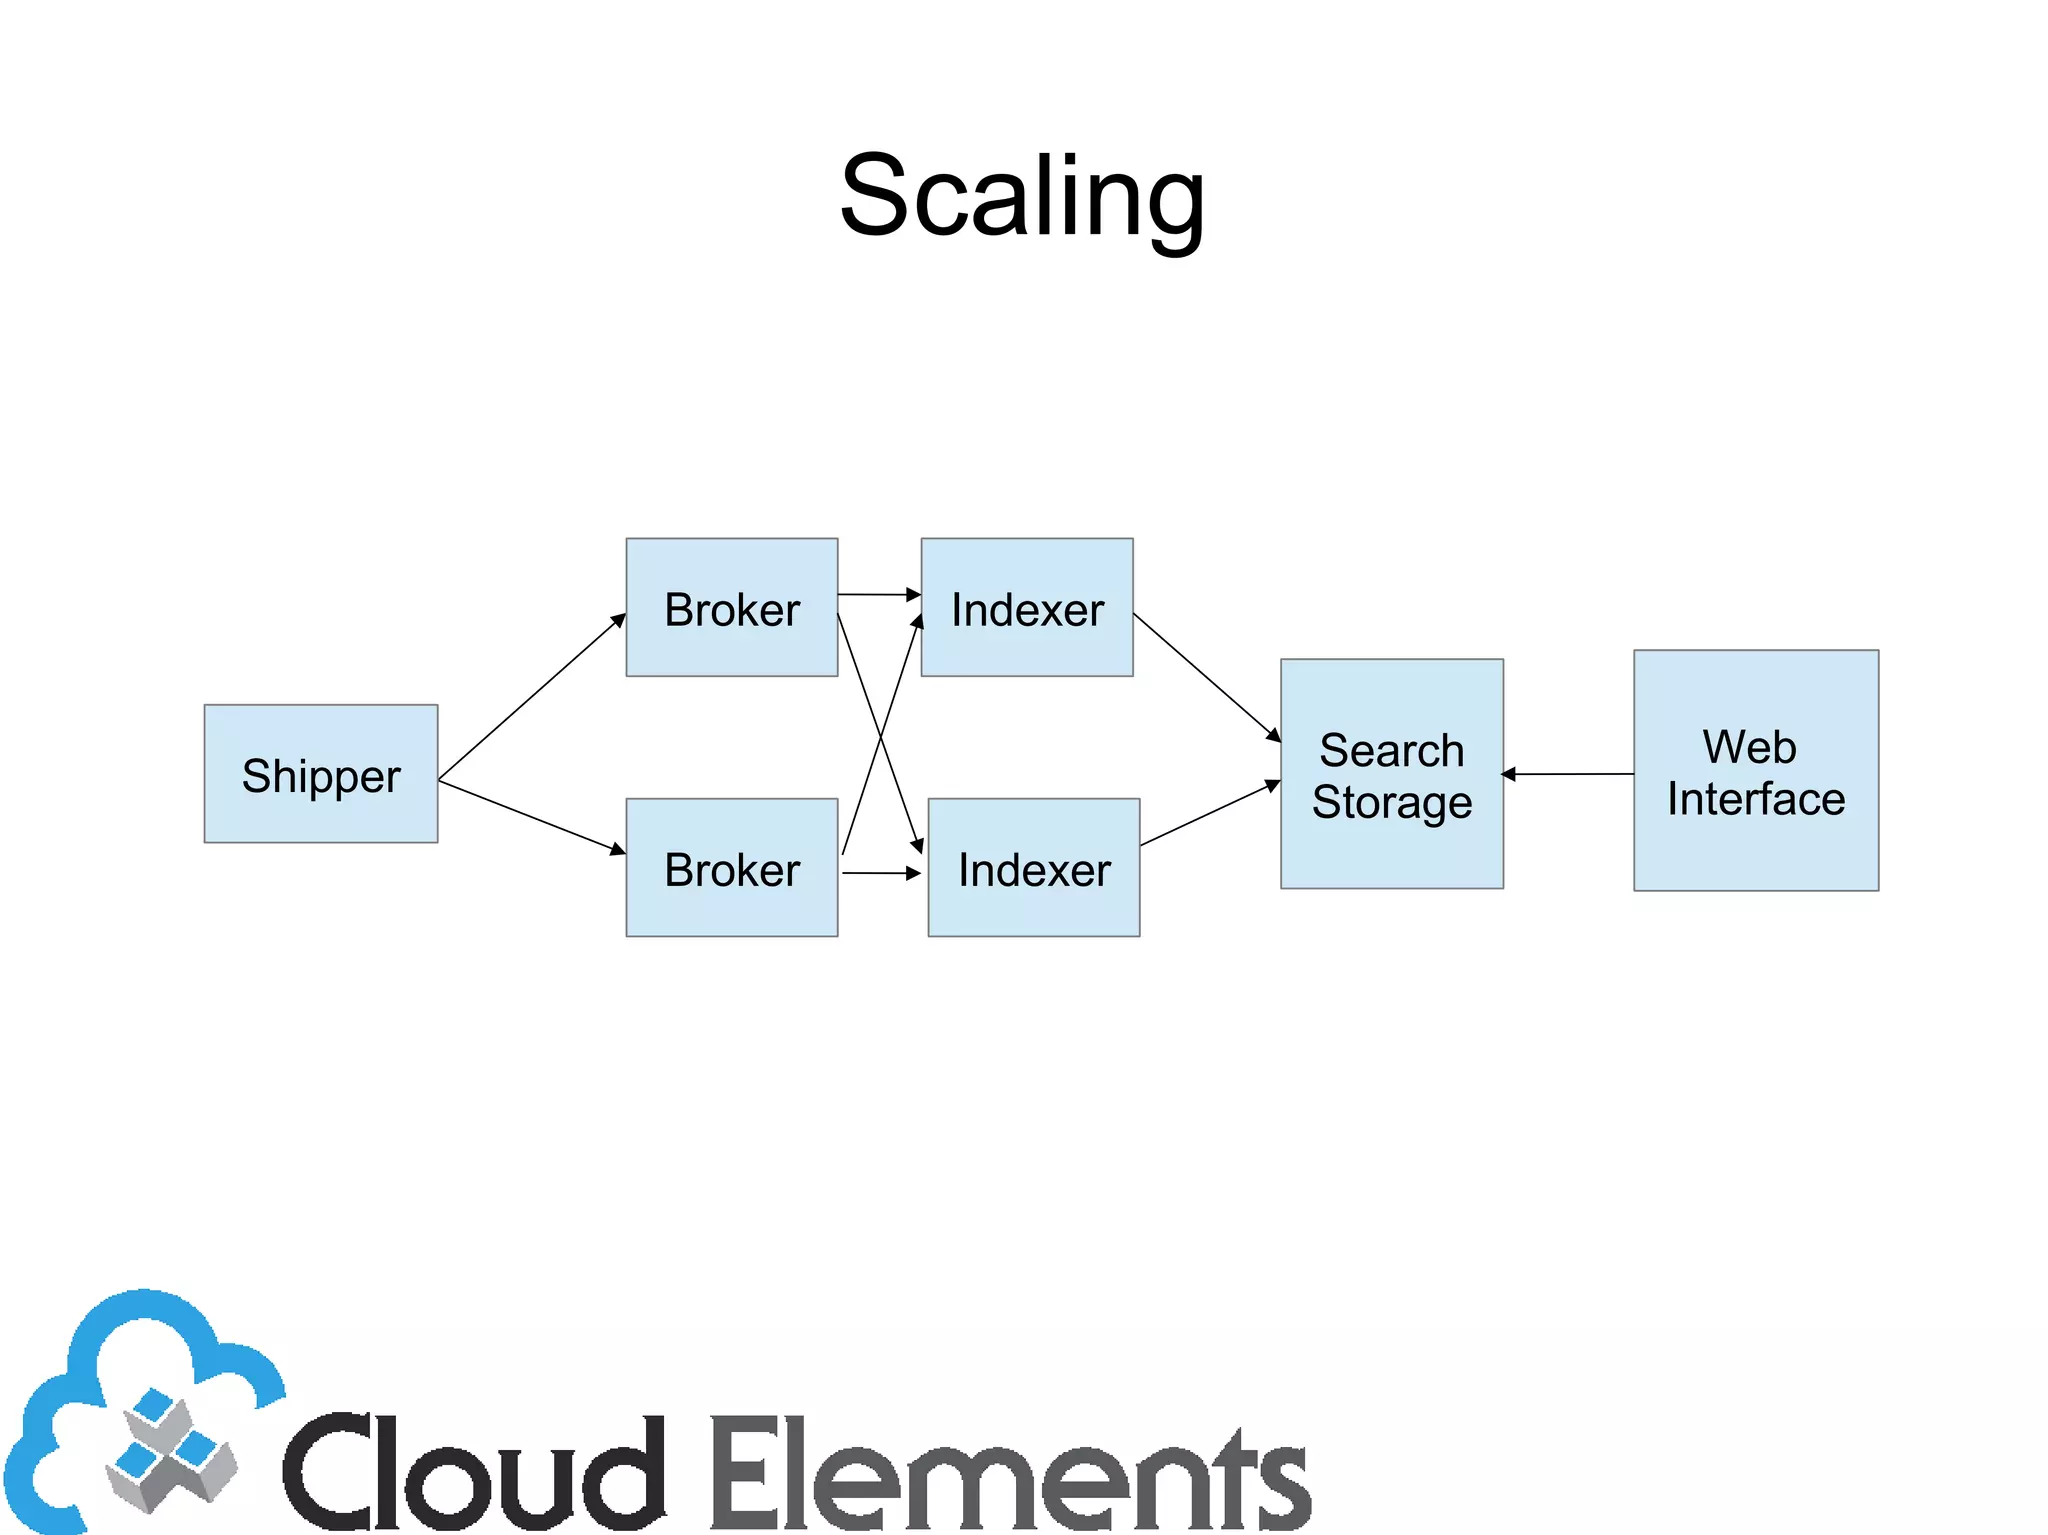
The document outlines log scaling and analytics using Logstash, addressing common logging challenges such as load on databases and difficulties in log format management. It describes Logstash as an open-source tool that processes, filters, and outputs logs to various destinations while integrating with Elasticsearch for indexing and Kibana for analytics. Additionally, it provides details on the architecture, plugins, and configuration necessary for effective log management and data analysis.


![All Things API Presentation - Gordon Weakleim [HomeAway]](https://cdn.slidesharecdn.com/ss_thumbnails/allthingsapipresentation-150415102056-conversion-gate02-thumbnail.jpg?width=640&height=640&fit=bounds)


![Vibe Coding vs. Spec-Driven Development [Free Meetup]](https://cdn.slidesharecdn.com/ss_thumbnails/vibecodingvsspecdrivendevelopment-251209105622-43f455e7-thumbnail.jpg?width=640&height=640&fit=bounds)


