Downloaded 51 times


![2016-06-02T13:05:22.614090Z 0 [Note] InnoDB: 5.7.12 started; log sequence number 2522067
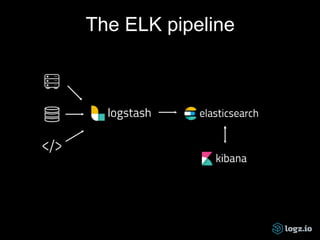
CONTAINER CPU % MEM USAGE / LIMIT MEM % NET I/O BLOCK I/O
3747bd397456 0.01% 3.641 MB / 2.1 GB 0.17% 3.366 kB / 648 B 0 B / 0 B
396e42ba0d15 0.11% 1.638 MB / 2.1 GB 0.08% 9.79 kB / 648 B 348.2 kB / 0 B
468bf755240a 3.19% 45.67 MB / 2.1 GB 2.17% 25.19 MB / 17.95 MB 774.1 kB / 0 B
5f16814a3c0e 0.01% 495.6 kB / 2.1 GB 0.02% 8.564 kB / 648 B 0 B / 0 B
74cdfa7b8a0c 0.04% 3.908 MB / 2.1 GB 0.19% 2.028 kB / 648 B 0 B / 0 B
99bafb7600fc 0.00% 32.95 MB / 2.1 GB 1.57% 0 B / 0 B 2.093 MB / 20.48 kB
a48f7ba0ace7 0.04% 390.4 MB / 2.1 GB 18.59% 4.704 kB / 648 B 31.29 MB / 306.5 MB
d7b60560e4d8 0.27% 220.9 MB / 2.1 GB 10.52% 7.338 kB / 648 B 94.21 kB / 114.7 kB
$ docker logs
$ docker stats
$ docker daemon
time="2016-06-05T12:03:49.716900785Z" level=debug msg="received containerd event: &types.Event{Type:"exit",
Id:"3747bd397456cd28058bb40799cd0642f431849b5c43ce56536ab7f55a98114f", Status:0x0,
Pid:"4120a7625a592f7c95eab4b1b442a45370f6dd95b63d284714dbb58f00d0a20d", Timestamp:0x57541525}"](https://image.slidesharecdn.com/monitoringdockerwithelk-160801073816/85/Monitoring-Docker-with-ELK-14-320.jpg)


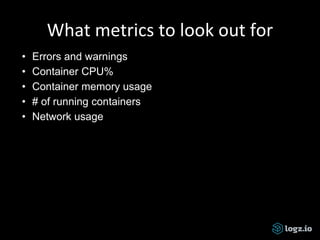
![Old school logging
$ grep ' 30[1234] ' /var/logs/apache2/access.log | grep -v
baidu | grep -v Googlebot
173.230.156.8 - - [04/Sep/2015:06:10:10 +0000] "GET /morpht HTTP/1.0" 301 26
"-" "Mozilla/5.0 (pc-x86_64-linux-gnu)"
192.3.83.5 - - [04/Sep/2015:06:10:22 +0000] "GET /?q=node/add HTTP/1.0" 301
26 "http://morpht.com/" "Mozilla/5.0 (Macintosh; Intel Mac OS X 10_10_1)
AppleWebKit/600.2.5 (KHTML, like Gecko) Version/8.0.2 Safari/600.2.5"
192.3.83.5 - - [04/Sep/2015:06:10:23 +0000] "GET /?q=user/register HTTP/1.0"
301 26 "http://morpht.com/node/add" "Mozilla/5.0 (Macintosh; Intel Mac OS X
10_10_1) AppleWebKit/600.2.5 (KHTML, like Gecko) Version/8.0.2 Safari/600.
2.5"](https://image.slidesharecdn.com/monitoringdockerwithelk-160801073816/85/Monitoring-Docker-with-ELK-19-320.jpg)
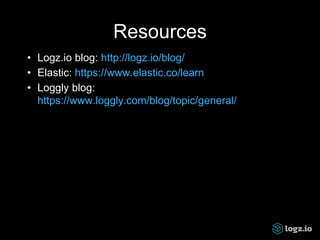
![New school logging
type:apache AND website: "mysite" AND response: [500 TO *]](https://image.slidesharecdn.com/monitoringdockerwithelk-160801073816/85/Monitoring-Docker-with-ELK-20-320.jpg)


This document discusses monitoring containers with the ELK stack. It introduces ELK (Elasticsearch, Logstash, Kibana) as a solution for centralized logging of containers. It describes using Logstash to collect logs from Docker containers via syslog and using a Docker log collector container to fetch logs and metrics from all containers on a Docker host. The document concludes with a demonstration of ELK for container monitoring.


![[scala.by] Launching new application fast](https://cdn.slidesharecdn.com/ss_thumbnails/scala-150330014222-conversion-gate01-thumbnail.jpg?width=640&height=640&fit=bounds)


