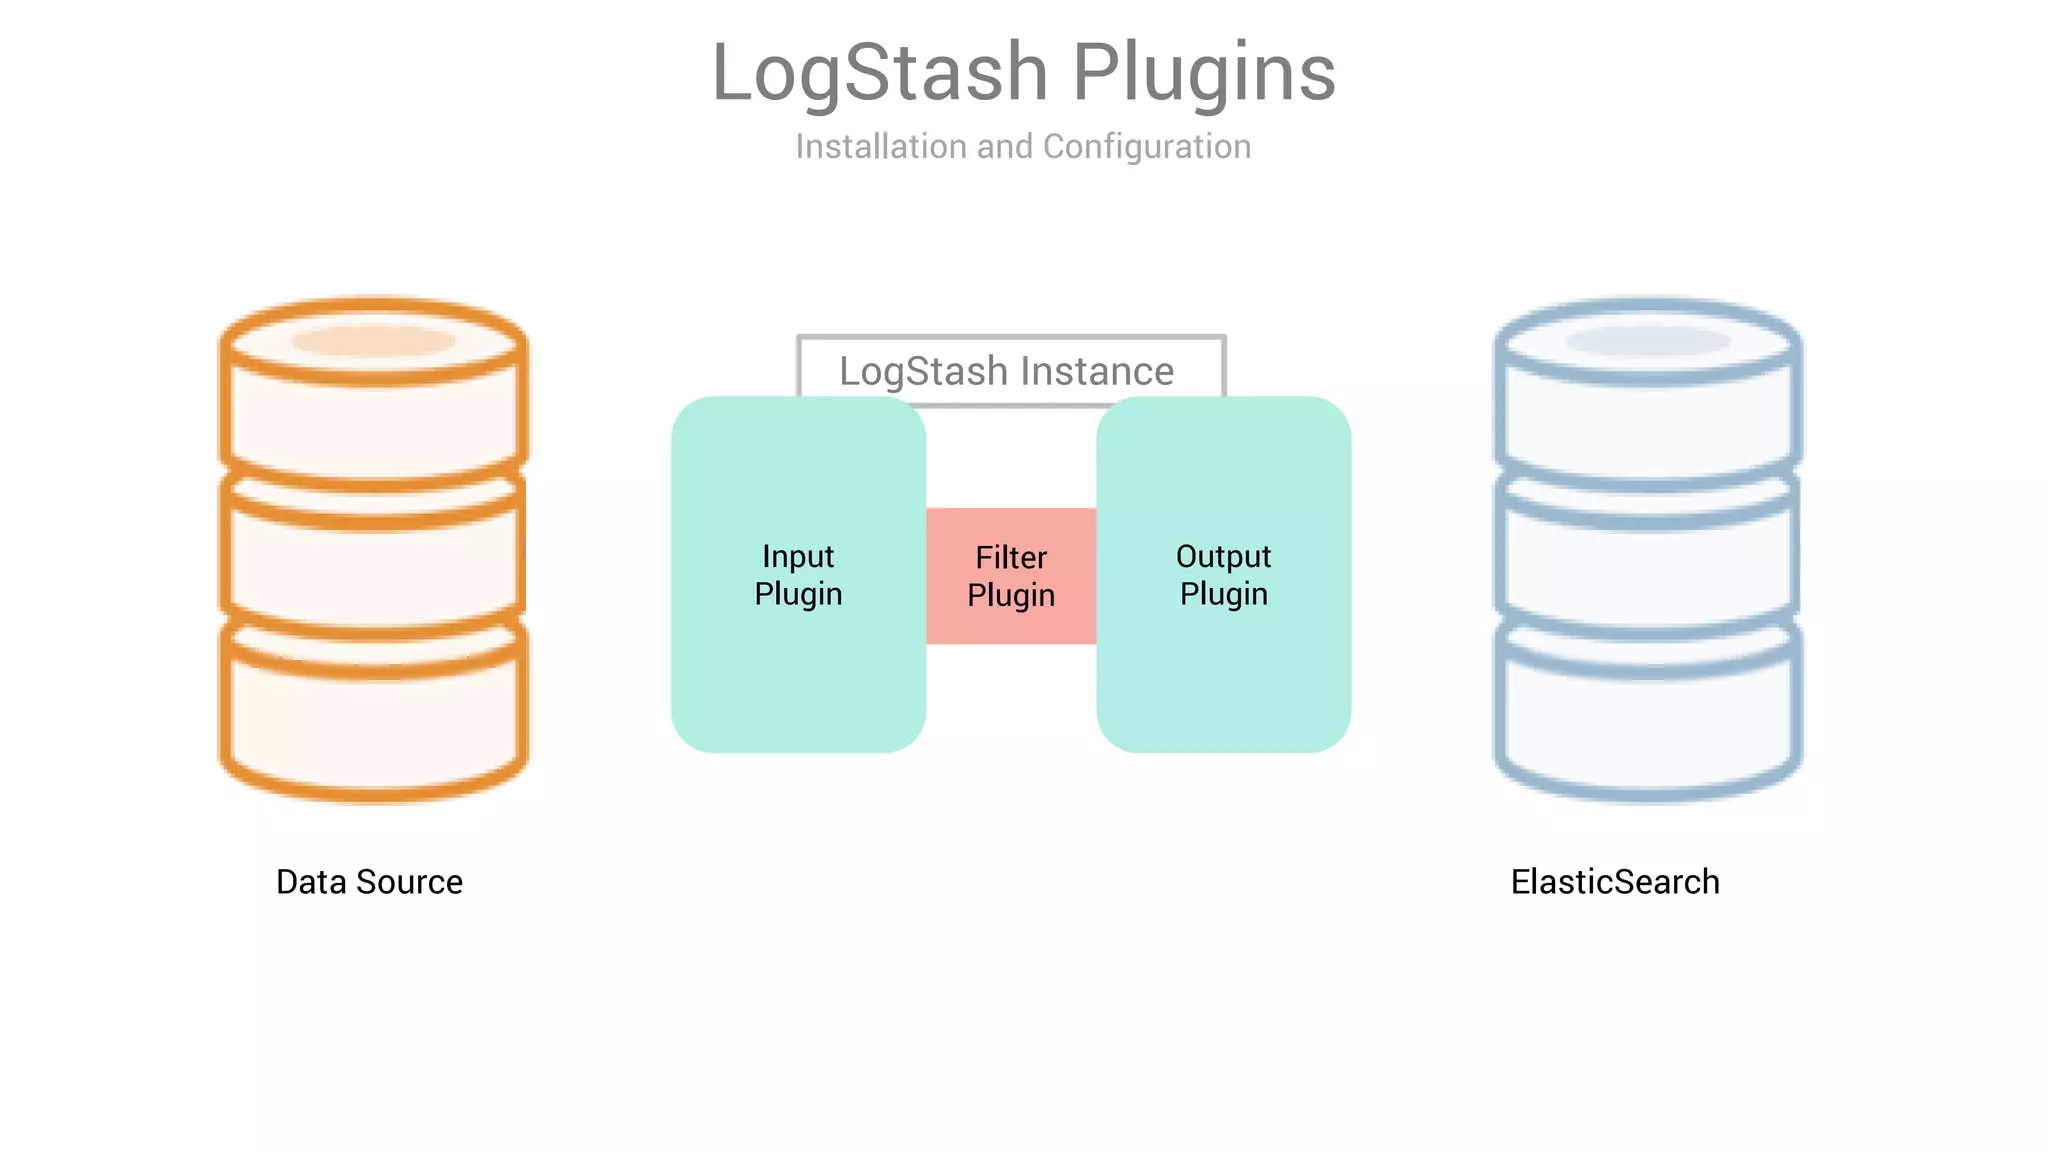
LogStash is a tool for ingesting, processing, and storing data from various sources into Elasticsearch. It includes plugins for input, filter, and output functionality. Common uses of LogStash include parsing log files, enriching events, and loading data into Elasticsearch for search and analysis. The document provides an overview of LogStash and demonstrates how to install it, configure input and output plugins, and create simple and advanced processing pipelines.


![3 # AWS S3 input
4
5 Input {
6
7 # Read all documents from AWS S3
8
9 s3 {
10
11 bucket => “my-bucket “
12 credentials => [ “my-aws-key “ , “my-aws-token “ ]
13 region_endpoint => “us-east-1 “
14 codec => “json “
15
16 }
17 }
18
Input-s3
Installation and Configuration](https://image.slidesharecdn.com/logstashmodule4v1-170613135210/75/LogStash-in-action-25-2048.jpg)
![Filter-csv
Installation and Configuration
2
3 # CSV filter
4 filter {
5
6 csv {
7
8 # List of columns as they appear in csv
9 column => [ “column_1” , “column_2” ]
10 column => { “column_3” => “integer” , “column_4” => “boolean” }
11 type => “syslog”
12
13 }
14
15 }
16](https://image.slidesharecdn.com/logstashmodule4v1-170613135210/75/LogStash-in-action-28-2048.jpg)
![2
3 # date filter
4
5 filter {
6
7
8 date {
9
10 match => [ “logdate” , “MMM dd HH:mm:ss” ]
11 # Default for target is @timestamp
12 target => “logdate_modified”
13
14 }
15 }
Filter-date
Installation and Configuration
• Used for parsing dates and use as LogStash event timestamp in ISO8601 format
• For example “Jan 01 10:40:01” can be parsed using the pattern “MMM dd HH:mm:ss”](https://image.slidesharecdn.com/logstashmodule4v1-170613135210/75/LogStash-in-action-29-2048.jpg)
![Filter-drop
Installation and Configuration
2
3 # drop filter
4
5 filter {
6
7 # drop the events of their loglevel is debug
8 drop {
9 if [ loglevel ] = = “debug” {
10 drop { }
11 }
12 }
13 }
14
15](https://image.slidesharecdn.com/logstashmodule4v1-170613135210/75/LogStash-in-action-30-2048.jpg)
![Filter-range
Installation and Configuration
2
3 # range filter
4
5 filter {
6 range {
7 ranges => [“request_time” , 0, 10, “tag: short” ,
8 “request_time” , 11, 100, “tag: medium”,
9 “request_time” , 101, 1000, “tag: long”,
10 “request_time” , 1001, 100000, “drop”,
11 “request_length” , 0, 100, “field: size: small”,
12 “request_length” , 101, 200, “field: size: normal”,
13 “request_length” , 201, 1000, “field: size: big”,
14 “request_length” , 1001, 100000, “field: size: hugel”,
15 “number_of_requests” , 0, 10, “tag: request_from_%{host}” ]
16 }
17 }](https://image.slidesharecdn.com/logstashmodule4v1-170613135210/75/LogStash-in-action-31-2048.jpg)

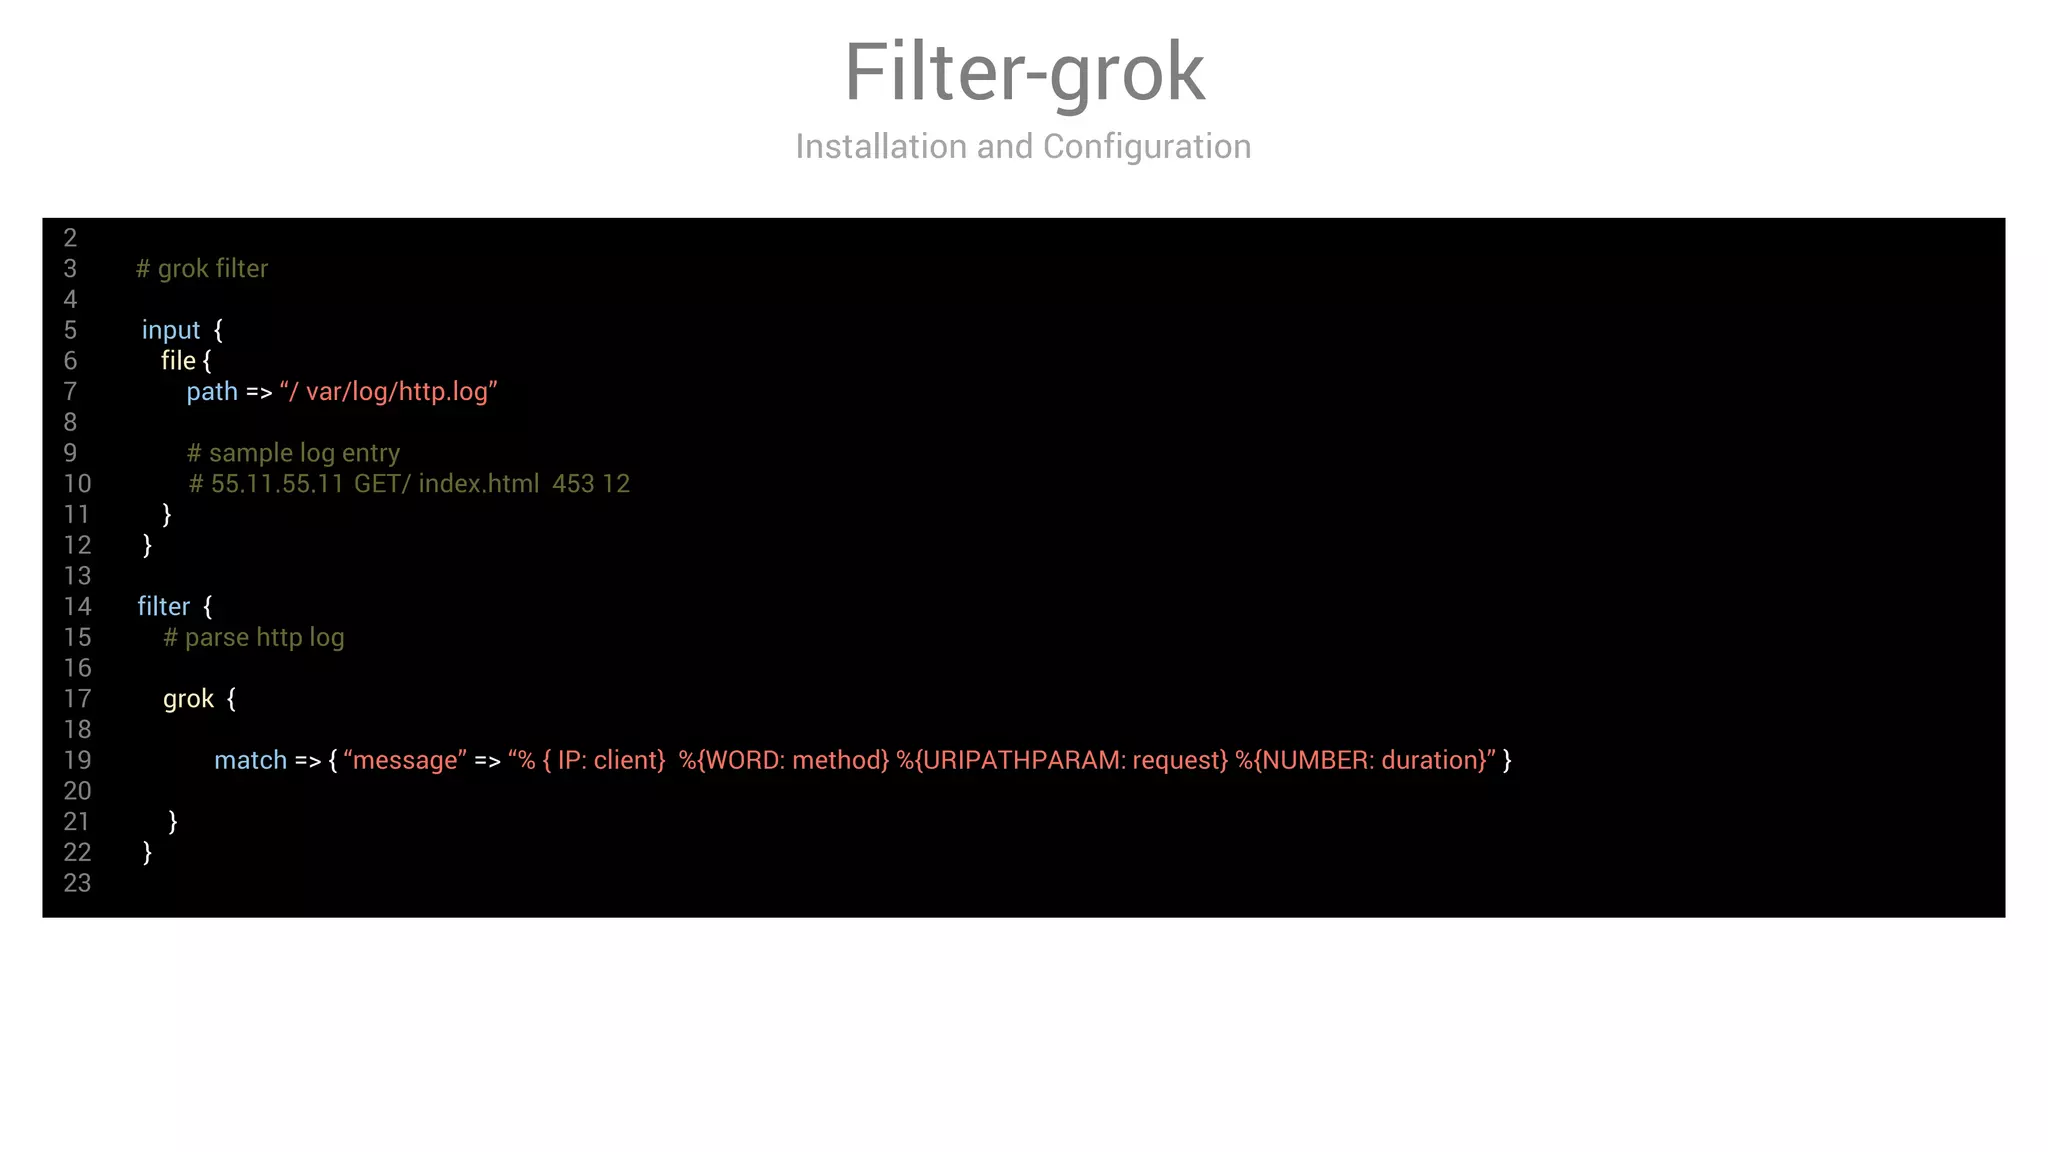
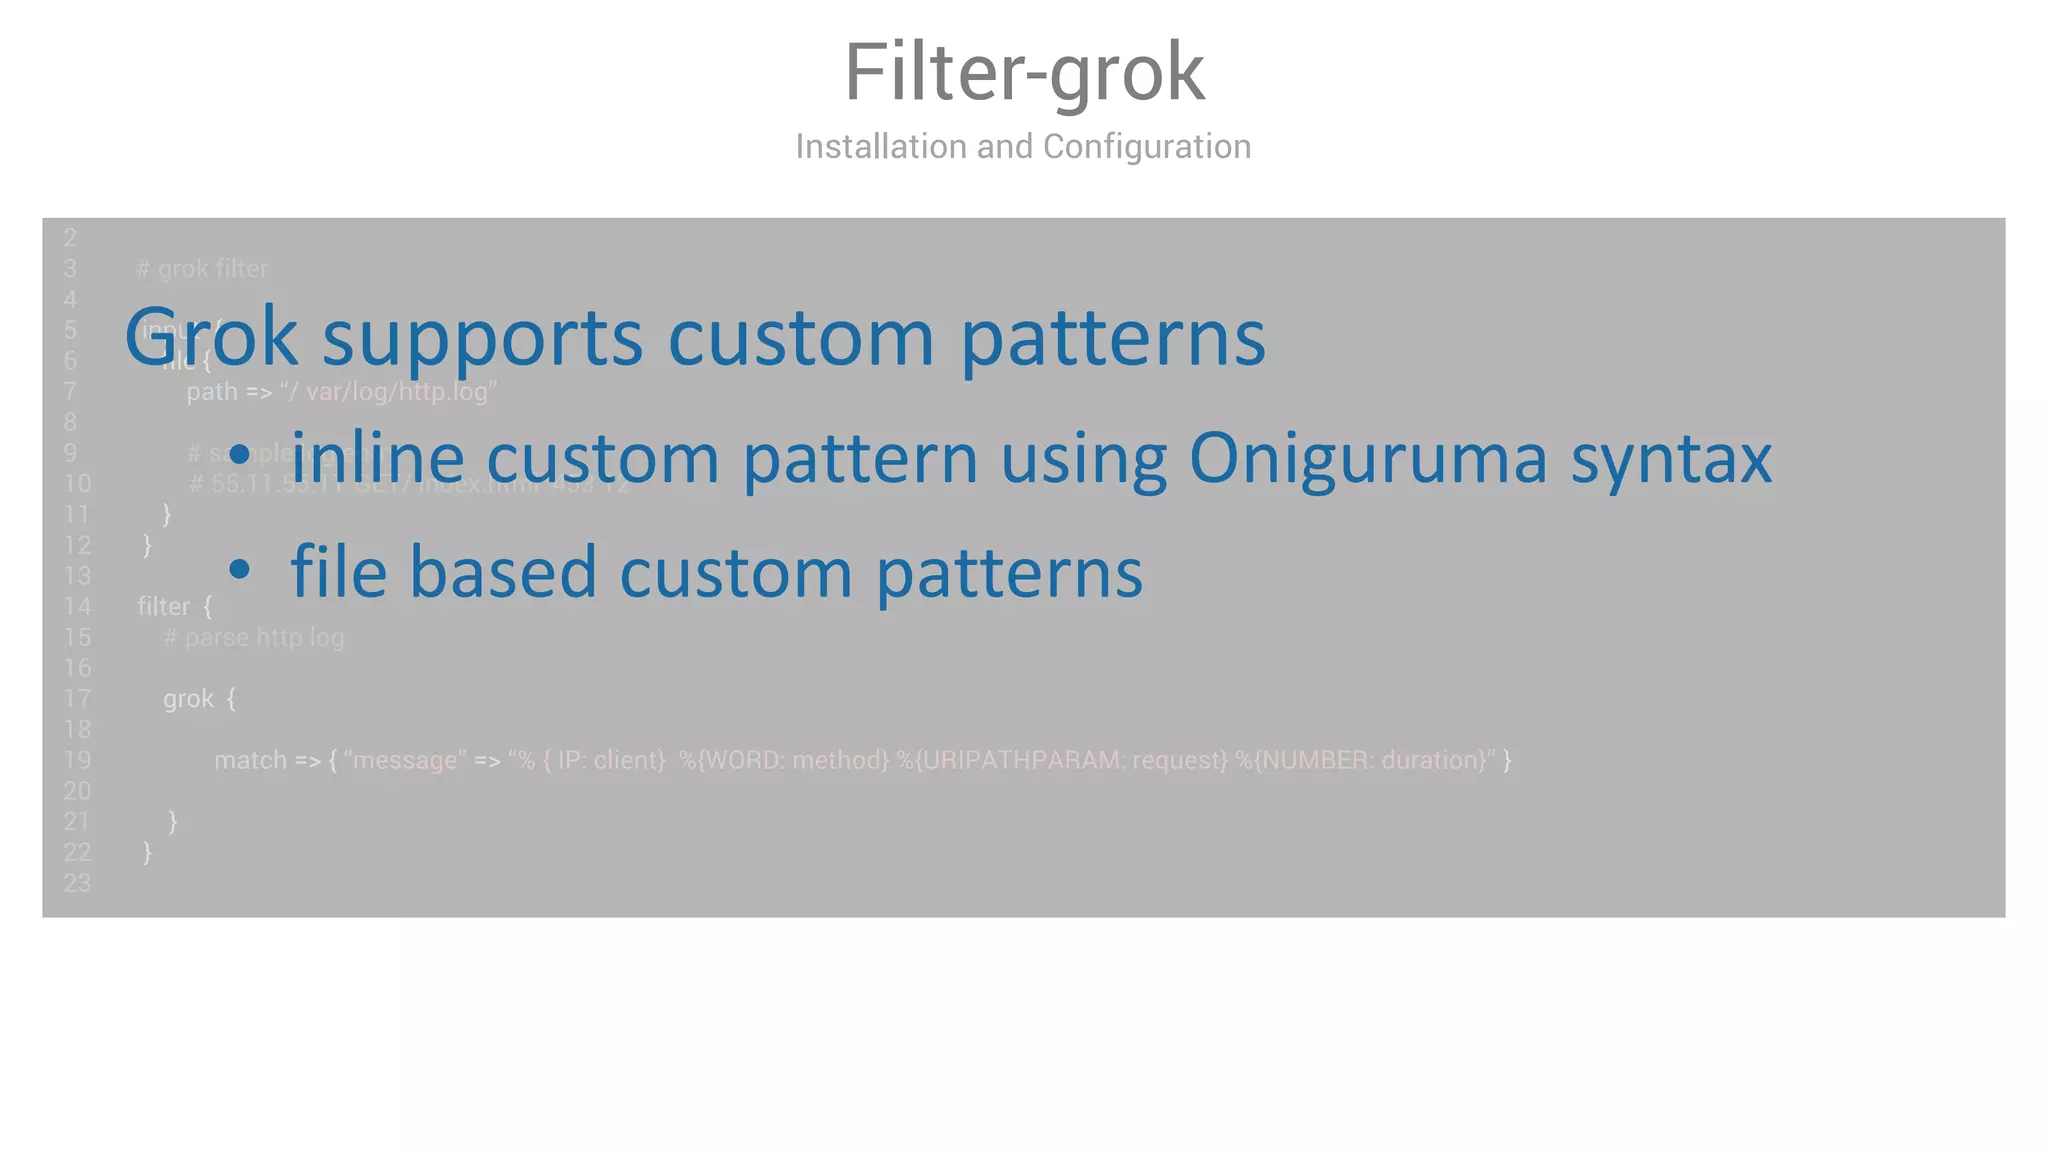
![Filter-grok
Installation and Configuration
43 # ( ? < field_name> the pattern here
44
45
46 ( ? < message_id> [0-9A-F] {10, 11}](https://image.slidesharecdn.com/logstashmodule4v1-170613135210/75/LogStash-in-action-35-2048.jpg)
![24
25 # grok filter
26
27 filter {
28
29 grok {
30
31 patterns_dir => [ “~/patterns” ]
32 match => { “message” => “% {SYSLOGBASE} %{POSTFIXQUEUEID: queue_id}: %{GREEDYDATA:syslog_message}” }
33
34 }
35 }
Filter-grok
Installation and Configuration](https://image.slidesharecdn.com/logstashmodule4v1-170613135210/75/LogStash-in-action-36-2048.jpg)