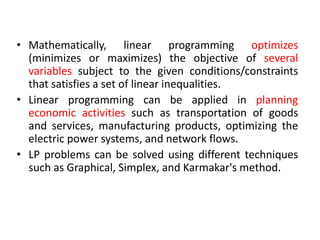
- Linear programming is an optimization technique used to maximize or minimize an objective function subject to constraints.
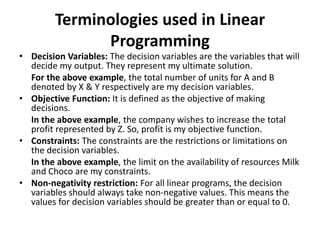
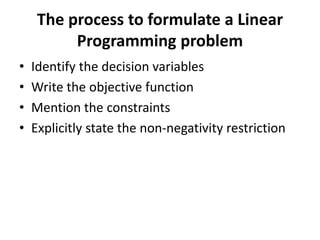
- It involves defining decision variables, an objective function, constraints, and finding optimal values for the decision variables.
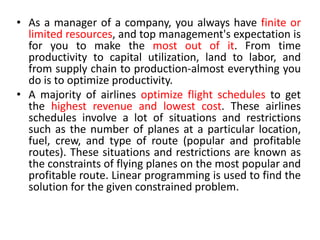
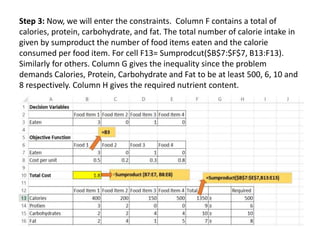
- An example problem involves optimizing a chocolate company's profit by determining the optimal production quantities of two chocolate types given constraints on available ingredients.
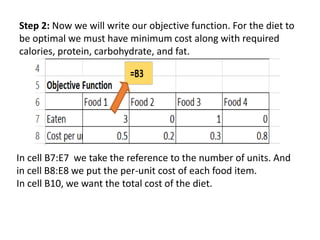
- The problem is formulated as a linear program and solved using OpenSolver, an Excel add-in, to find the maximum profit production plan.