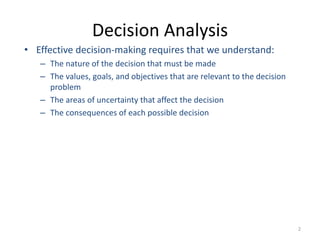
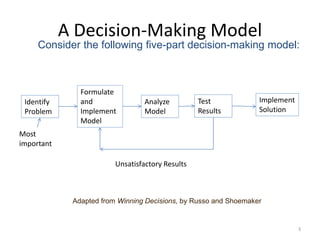
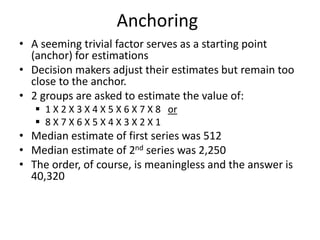
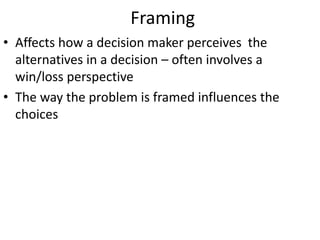
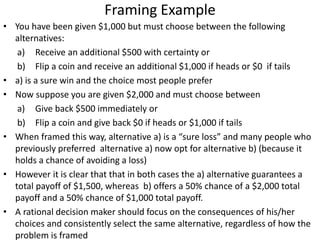
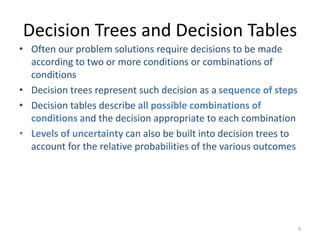
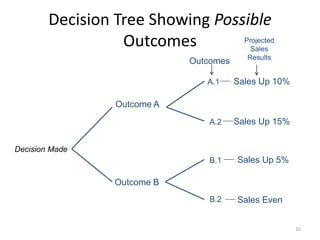
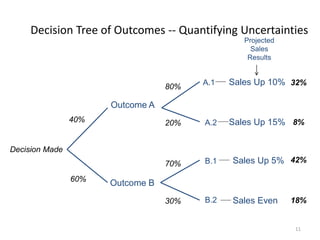
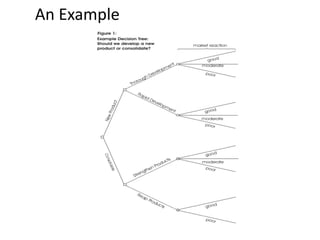
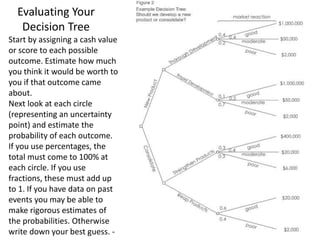
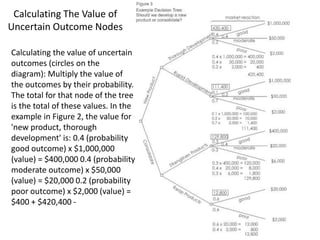
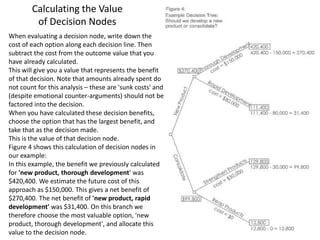
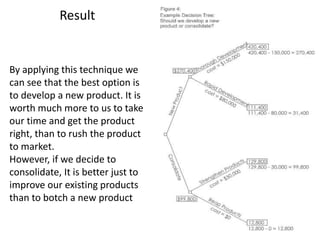
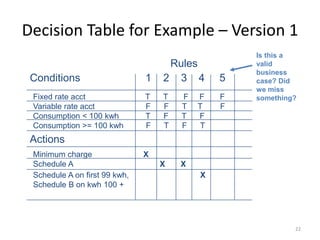
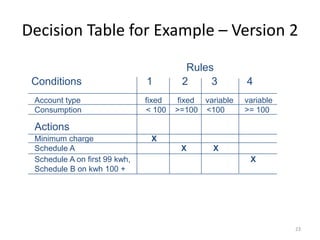
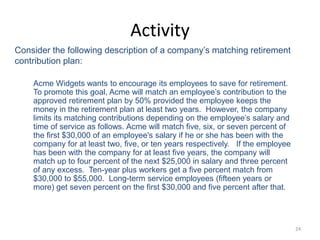
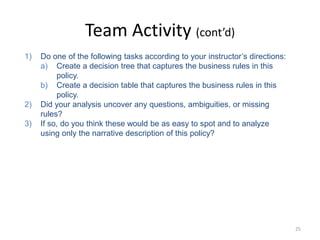
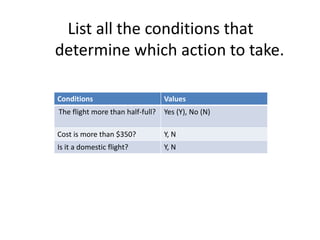
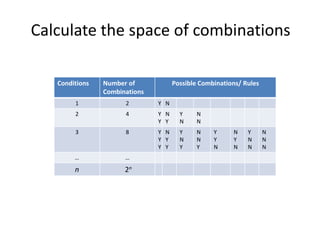
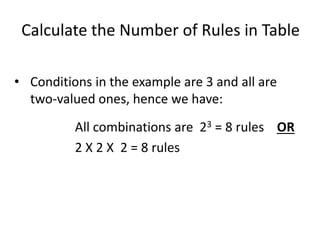
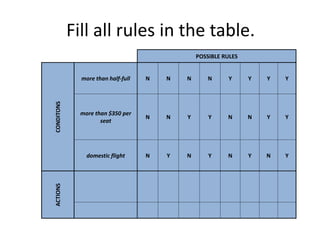
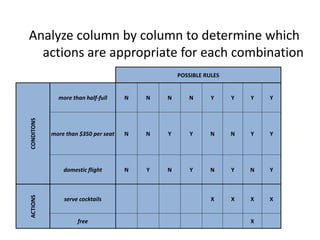
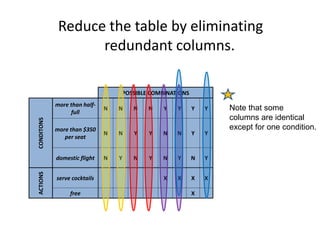
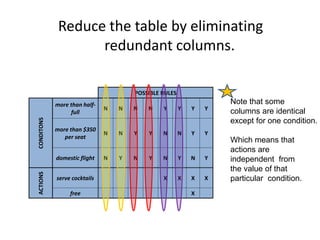
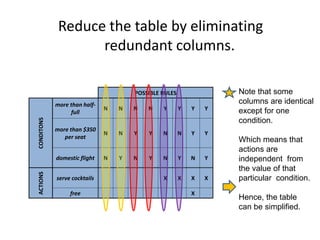
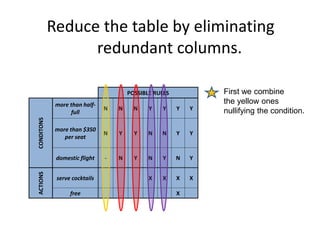
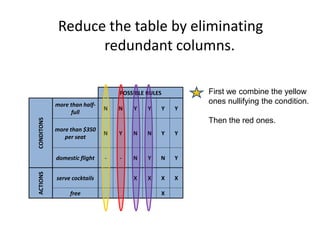
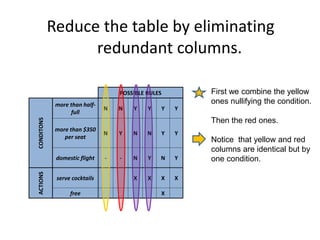
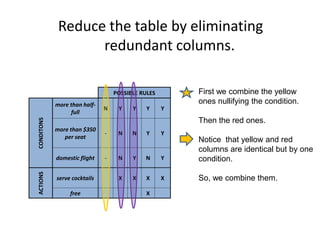
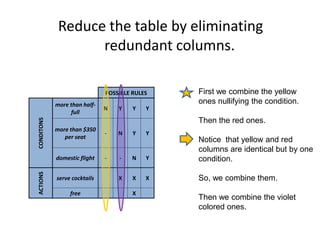
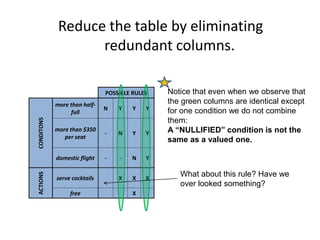
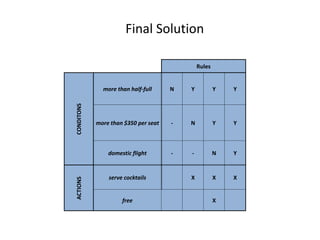
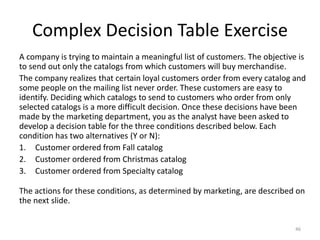
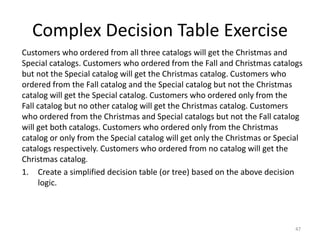
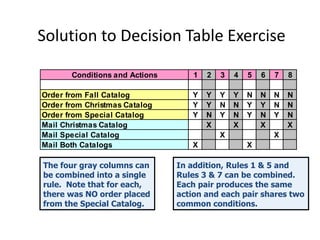
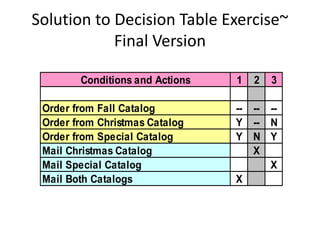
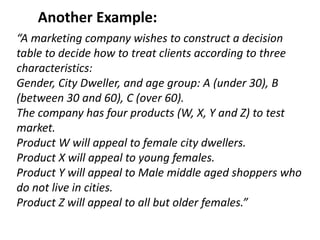
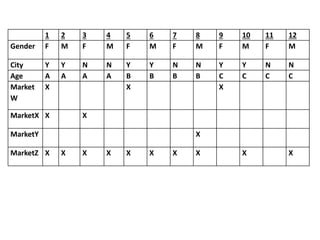
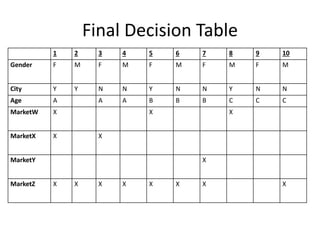
Decision Analysis
2
Decision Analysis
• Effective decision-making requires that we understand:
– The nature of the decision that must be made
– The values, goals, and objectives that are relevant to the decision
problem
– The areas of uncertainty that affect the decision
– The consequences of each possible decision
3
A Decision-Making Model
Consider the following five-part decision-making model:
Adapted from Winning Decisions, by Russo and Shoemaker
Identify
Problem
Formulate
and
Implement
Model
Analyze
Model
Test
Results
Implement
Solution
Unsatisfactory Results
Most
important
Anchoring and Framing
• Errors in judgment arise due to what
psychologists term anchoring and framing
Anchoring
• A seeming trivial factor serves as a starting point
(anchor) for estimations
• Decision makers adjust their estimates but remain too
close to the anchor.
• 2 groups are asked to estimate the value of:
 1 X 2 X 3 X 4 X 5 X 6 X 7 X 8 or
 8 X 7 X 6 X 5 X 4 X 3 X 2 X 1
• Median estimate of first series was 512
• Median estimate of 2nd series was 2,250
• The order, of course, is meaningless and the answer is
40,320
Framing
• Affects how a decision maker perceives the
alternatives in a decision – often involves a
win/loss perspective
• The way the problem is framed influences the
choices
Framing Example
• You have been given $1,000 but must choose between the following
alternatives:
a) Receive an additional $500 with certainty or
b) Flip a coin and receive an additional $1,000 if heads or $0 if tails
• a) is a sure win and the choice most people prefer
• Now suppose you are given $2,000 and must choose between
a) Give back $500 immediately or
b) Flip a coin and give back $0 if heads or $1,000 if tails
• When framed this way, alternative a) is a “sure loss” and many people who
previously preferred alternative a) now opt for alternative b) (because it
holds a chance of avoiding a loss)
• However it is clear that that in both cases the a) alternative guarantees a
total payoff of $1,500, whereas b) offers a 50% chance of a $2,000 total
payoff and a 50% chance of $1,000 total payoff.
• A rational decision maker should focus on the consequences of his/her
choices and consistently select the same alternative, regardless of how the
problem is framed
8
A Framing Example
“Careful analysis at a major U.S. steel company showed it
could save hundreds of thousands of dollars per year by
replacing its hot-metal mixing technology, which required that
metal be heated twice, with direct-pouring technology, in
which the metal was only heated once. But the move was
approved only after considerable delay because senior
engineers complained that the analysis did not include the cost
of the hot metal mixers that had been purchased for $3 million
just a few years previously.”
How would you critique this decision?
Adapted from Winning Decisions, by Russo and Shoemaker
9
Decision Trees and Decision Tables
• Often our problem solutions require decisions to be made
according to two or more conditions or combinations of
conditions
• Decision trees represent such decision as a sequence of steps
• Decision tables describe all possible combinations of
conditions and the decision appropriate to each combination
• Levels of uncertainty can also be built into decision trees to
account for the relative probabilities of the various outcomes
10
Decision Tree Showing Possible
Outcomes
Outcome A
Outcome B
Sales Up 10%
Sales Up 15%
Sales Up 5%
Sales Even
A.1
A.2
B.1
B.2
Decision Made
Outcomes
Projected
Sales
Results
11
Decision Tree of Outcomes -- Quantifying Uncertainties
Outcome A
Outcome B
Sales Up 10%
Sales Up 15%
Sales Up 5%
Sales Even
A.1
A.2
B.1
B.2
40%
60%
80%
20%
32%
8%
70%
30%
42%
18%
Decision Made
Projected
Sales
Results
An Example
Evaluating Your
Decision Tree
Start by assigning a cash value
or score to each possible
outcome. Estimate how much
you think it would be worth to
you if that outcome came
about.
Next look at each circle
(representing an uncertainty
point) and estimate the
probability of each outcome.
If you use percentages, the
total must come to 100% at
each circle. If you use
fractions, these must add up
to 1. If you have data on past
events you may be able to
make rigorous estimates of
the probabilities. Otherwise
write down your best guess. -
Calculating Tree Values
• Once you have worked out the value of the outcomes,
and have assessed the probability of the outcomes of
uncertainty, it is time to start calculating the values
that will help you make your decision.
• Start on the right hand side of the decision tree, and
work back towards the left. As you complete a set of
calculations on a node (decision square or uncertainty
circle), all you need to do is to record the result. You
can ignore all the calculations that lead to that result
from then on. –
Calculating The Value of
Uncertain Outcome Nodes
Calculating the value of uncertain
outcomes (circles on the
diagram): Multiply the value of
the outcomes by their probability.
The total for that node of the tree
is the total of these values. In the
example in Figure 2, the value for
'new product, thorough
development' is: 0.4 (probability
good outcome) x $1,000,000
(value) = $400,000 0.4 (probability
moderate outcome) x $50,000
(value) = $20,000 0.2 (probability
poor outcome) x $2,000 (value) =
$400 + $420,400 -
Calculating the Value
of Decision Nodes
When evaluating a decision node, write down the
cost of each option along each decision line. Then
subtract the cost from the outcome value that you
have already calculated.
This will give you a value that represents the benefit
of that decision. Note that amounts already spent do
not count for this analysis – these are 'sunk costs' and
(despite emotional counter-arguments) should not be
factored into the decision.
When you have calculated these decision benefits,
choose the option that has the largest benefit, and
take that as the decision made.
This is the value of that decision node.
Figure 4 shows this calculation of decision nodes in
our example:
In this example, the benefit we previously calculated
for 'new product, thorough development' was
$420,400. We estimate the future cost of this
approach as $150,000. This gives a net benefit of
$270,400. The net benefit of 'new product, rapid
development' was $31,400. On this branch we
therefore choose the most valuable option, 'new
product, thorough development', and allocate this
value to the decision node.
Result
By applying this technique we
can see that the best option is
to develop a new product. It is
worth much more to us to take
our time and get the product
right, than to rush the product
to market.
However, if we decide to
consolidate, It is better just to
improve our existing products
than to botch a new product
18
Example of Using a Decision Tree or
Table to Capture Complex Business
Logic
Consider the following excerpt from an actual business
document:
If the customer account is billed using a fixed rate method, a minimum
monthly charge is assessed for consumption of less than 100 kwh.
Otherwise, apply a schedule A rate structure. However, if the account is
billed using a variable rate method, a schedule A rate structure will apply to
consumption below 100 kwh, with additional consumption billed according
to schedule B.
Articulating Complex Business Rules
 Complex business rules, such as our example, can become
rather confusing
 Capturing such rules in text form alone can lead to ambiguity
and misinterpretation
 As an alternative, it is often wise to capture such rules in
decision tress or decision tables
 The examples on the following slides will illustrate this
technique
20
Decision Tree for this Example
fixed
rate
billing
variable
rate
billing
< 100 kwh
>= 100 kwh
< 100 kwh
>= 100 kwh
minimum charge
schedule A
schedule A
?
21
Decision Tree for this Example
< 100 kwh
>= 100 kwh
< 100 kwh
>= 100 kwh
minimum charge
schedule A
schedule A
schedule A on
first 99 kwh
schedule B on
kwh 100 and above
fixed
rate
billing
variable
rate
billing
22
Decision Table for Example – Version 1
Conditions 1 2 3 4 5
Rules
Fixed rate acct T T F F F
Variable rate acct F F T T F
Consumption < 100 kwh T F T F
Consumption >= 100 kwh F T F T
Minimum charge X
Schedule A X X
Schedule A on first 99 kwh, X
Schedule B on kwh 100 +
Actions
Is this a
valid
business
case? Did
we miss
something?
23
Decision Table for Example – Version 2
Conditions 1 2 3 4
Rules
Account type fixed fixed variable variable
Consumption < 100 >=100 <100 >= 100
Minimum charge X
Schedule A X X
Schedule A on first 99 kwh, X
Schedule B on kwh 100 +
Actions
24
Activity
Consider the following description of a company’s matching retirement
contribution plan:
Acme Widgets wants to encourage its employees to save for retirement.
To promote this goal, Acme will match an employee’s contribution to the
approved retirement plan by 50% provided the employee keeps the
money in the retirement plan at least two years. However, the company
limits its matching contributions depending on the employee’s salary and
time of service as follows. Acme will match five, six, or seven percent of
the first $30,000 of an employee's salary if he or she has been with the
company for at least two, five, or ten years respectively. If the employee
has been with the company for at least five years, the company will
match up to four percent of the next $25,000 in salary and three percent
of any excess. Ten-year plus workers get a five percent match from
$30,000 to $55,000. Long-term service employees (fifteen years or
more) get seven percent on the first $30,000 and five percent after that.
25
Team Activity (cont’d)
1) Do one of the following tasks according to your instructor’s directions:
a) Create a decision tree that captures the business rules in this
policy.
b) Create a decision table that captures the business rules in this
policy.
2) Did your analysis uncover any questions, ambiguities, or missing
rules?
3) If so, do you think these would be as easy to spot and to analyze
using only the narrative description of this policy?
Developing a More Complex Decision
Table
26
Developing More Complex Decision
Tables
In the 1950's General Electric, the Sutherland
Corporation, and the United States Air Force
worked on a complex file maintenance project,
using flowcharts and traditional narratives, they
spent six labor-years of effort but failed to define
the problem.
It was not until 1958, when four analysts using
decision tables, successfully defined the problem
in less than four weeks1.
_____________________________________
1Taken from “A History of Decision Tables” located at
http://www.catalyst.com/products/logicgem/overview.html
Steps to create a decision table
1. List all the conditions which determine which action to take.
2. Calculate the number of rules required.
– Multiple the number of values for each condition by each other.
• Example: Condition 1 has 2 values, Condition 2 has 2 values, Condition
3 has 2 values. Thus 2 X 2 X 2 = 8 rules
3. Fill all combinations in the table.
4. Define the action for each rule
5. Analyze column by column to determine which actions are
appropriate for each rule.
6. Reduce the table by eliminating redundant columns.
<cond-1> F T F T F T F T … T
<cond-2> F F T T F F T T … T
<cond-3> F F F F T T T T … T
… …
<cond-n> F F F F F F F F … T
<action-1> X X X X
<action-2> X X X X
<action-3> X X X X
… …
<action-m> X X X
Actions
Conditions
All possible combinations
Actions per combination
(each column represents a different state of affairs)
Example
• Policy for charging charter flight costumers for
certain in-flight services:2
If the flight is more than half-full and costs more than
$350 per seat, we serve free cocktails unless it is a
domestic flight. We charge for cocktails on all domestic
flights; that is, for all the ones where we serve cocktails.
(Cocktails are only served on flights that are more than
half-full.)
_____________________________________
2 Example taken form: Structured Analysis and System Specification, Tom de Marco,
Yourdon inc., New York,
List all the conditions that
determine which action to take.
Conditions Values
The flight more than half-full? Yes (Y), No (N)
Cost is more than $350? Y, N
Is it a domestic flight? Y, N
Calculate the space of combinations
Conditions Number of
Combinations
Possible Combinations/ Rules
1 2 Y N
2 4 Y
Y
N
Y
Y
N
N
N
3 8 Y
Y
Y
N
Y
Y
Y
N
Y
N
N
Y
Y
Y
N
N
Y
N
Y
N
N
N
N
N
… …
n 2n
Calculate the Number of Rules in Table
• Conditions in the example are 3 and all are
two-valued ones, hence we have:
All combinations are 23 = 8 rules OR
2 X 2 X 2 = 8 rules
Fill all rules in the table.
POSSIBLE RULESCONDITONS
more than half-full N N N N Y Y Y Y
more than $350 per
seat
N N Y Y N N Y Y
domestic flight N Y N Y N Y N Y
ACTIONS
Analyze column by column to determine which
actions are appropriate for each combination
POSSIBLE RULES
CONDITONS
more than half-full N N N N Y Y Y Y
more than $350 per seat N N Y Y N N Y Y
domestic flight N Y N Y N Y N Y
ACTIONS
serve cocktails X X X X
free X
Reduce the table by eliminating
redundant columns.
POSSIBLE COMBINATIONS
CONDITONS
more than half-
full
N N N N Y Y Y Y
more than $350
per seat
N N Y Y N N Y Y
domestic flight N Y N Y N Y N Y
ACTIONS
serve cocktails X X X X
free X
Note that some
columns are identical
except for one condition.
Reduce the table by eliminating
redundant columns.
POSSIBLE RULES
CONDITONS
more than half-
full
N N N N Y Y Y Y
more than $350
per seat
N N Y Y N N Y Y
domestic flight N Y N Y N Y N Y
ACTIONS
serve cocktails X X X X
free X
Note that some
columns are identical
except for one condition.
Which means that
actions are
independent from
the value of that
particular condition.
Reduce the table by eliminating
redundant columns.
POSSIBLE RULES
CONDITONS
more than half-
full
N N N N Y Y Y Y
more than $350
per seat
N N Y Y N N Y Y
domestic flight N Y N Y N Y N Y
ACTIONS
serve cocktails X X X X
free X
Note that some
columns are identical
except for one
condition.
Which means that
actions are
independent from
the value of that
particular condition.
Hence, the table
can be simplified.
Reduce the table by eliminating
redundant columns.
POSSIBLE RULES
CONDITONS
more than half-
full
N N N Y Y Y Y
more than $350
per seat
N Y Y N N Y Y
domestic flight - N Y N Y N Y
ACTIONS
serve cocktails X X X X
free X
First we combine
the yellow ones
nullifying the condition.
Reduce the table by eliminating
redundant columns.
POSSIBLE RULES
CONDITONS
more than half-
full
N N Y Y Y Y
more than $350
per seat
N Y N N Y Y
domestic flight - - N Y N Y
ACTIONS
serve cocktails X X X X
free X
First we combine the yellow
ones nullifying the condition.
Then the red ones.
Reduce the table by eliminating
redundant columns.
POSSIBLE RULES
CONDITONS
more than half-
full
N N Y Y Y Y
more than $350
per seat
N Y N N Y Y
domestic flight - - N Y N Y
ACTIONS
serve cocktails X X X X
free X
First we combine the yellow
ones nullifying the condition.
Then the red ones.
Notice that yellow and red
columns are identical but by
one condition.
Reduce the table by eliminating
redundant columns.
POSSIBLE RULES
CONDITONS
more than half-
full
N Y Y Y Y
more than $350
per seat
- N N Y Y
domestic flight - N Y N Y
ACTIONS
serve cocktails X X X X
free X
First we combine the yellow
ones nullifying the condition.
Then the red ones.
Notice that yellow and red
columns are identical but by one
condition.
So, we combine them.
Reduce the table by eliminating
redundant columns.
POSSIBLE RULES
CONDITONS
more than half-
full
N Y Y Y
more than $350
per seat
- N Y Y
domestic flight - - N Y
ACTIONS
serve cocktails X X X
free X
First we combine the yellow
ones nullifying the condition.
Then the red ones.
Notice that yellow and red
columns are identical but by one
condition.
So, we combine them.
Then we combine the violet
colored ones.
Reduce the table by eliminating
redundant columns.
POSSIBLE RULES
CONDITONS
more than half-
full
N Y Y Y
more than $350
per seat
- N Y Y
domestic flight - - N Y
ACTIONS
serve cocktails X X X
free X
Notice that even when we observe that
the green columns are identical except
for one condition we do not combine
them:
A “NULLIFIED” condition is not the
same as a valued one.
What about this rule? Have we
over looked something?
Final Solution
Rules
CONDITONS
more than half-full N Y Y Y
more than $350 per seat - N Y Y
domestic flight - - N Y
ACTIONS
serve cocktails X X X
free X
Complex Decision Table Exercise
A company is trying to maintain a meaningful list of customers. The objective is
to send out only the catalogs from which customers will buy merchandise.
The company realizes that certain loyal customers order from every catalog and
some people on the mailing list never order. These customers are easy to
identify. Deciding which catalogs to send to customers who order from only
selected catalogs is a more difficult decision. Once these decisions have been
made by the marketing department, you as the analyst have been asked to
develop a decision table for the three conditions described below. Each
condition has two alternatives (Y or N):
1. Customer ordered from Fall catalog
2. Customer ordered from Christmas catalog
3. Customer ordered from Specialty catalog
The actions for these conditions, as determined by marketing, are described on
the next slide.
46
Complex Decision Table Exercise
Customers who ordered from all three catalogs will get the Christmas and
Special catalogs. Customers who ordered from the Fall and Christmas catalogs
but not the Special catalog will get the Christmas catalog. Customers who
ordered from the Fall catalog and the Special catalog but not the Christmas
catalog will get the Special catalog. Customers who ordered only from the
Fall catalog but no other catalog will get the Christmas catalog. Customers
who ordered from the Christmas and Special catalogs but not the Fall catalog
will get both catalogs. Customers who ordered only from the Christmas
catalog or only from the Special catalog will get only the Christmas or Special
catalogs respectively. Customers who ordered from no catalog will get the
Christmas catalog.
1. Create a simplified decision table (or tree) based on the above decision
logic.
47
Solution to Decision Table Exercise
Conditions and Actions 1 2 3 4 5 6 7 8
Order from Fall Catalog Y Y Y Y N N N N
Order from Christmas Catalog Y Y N N Y Y N N
Order from Special Catalog Y N Y N Y N Y N
Mail Christmas Catalog X X X X
Mail Special Catalog X X
Mail Both Catalogs X X
The four gray columns can
be combined into a single
rule. Note that for each,
there was NO order placed
from the Special Catalog.
In addition, Rules 1 & 5 and
Rules 3 & 7 can be combined.
Each pair produces the same
action and each pair shares two
common conditions.
Solution to Decision Table Exercise~
Final Version
Conditions and Actions 1 2 3
Order from Fall Catalog -- -- --
Order from Christmas Catalog Y -- N
Order from Special Catalog Y N Y
Mail Christmas Catalog X
Mail Special Catalog X
Mail Both Catalogs X
“A marketing company wishes to construct a decision
table to decide how to treat clients according to three
characteristics:
Gender, City Dweller, and age group: A (under 30), B
(between 30 and 60), C (over 60).
The company has four products (W, X, Y and Z) to test
market.
Product W will appeal to female city dwellers.
Product X will appeal to young females.
Product Y will appeal to Male middle aged shoppers who
do not live in cities.
Product Z will appeal to all but older females.”
Another Example:
The process used to create this decision table is the following:
1. Identify conditions and their alternative values.
There are 3 conditions: gender, city dweller, and age group. Put these into table as 3
rows in upper left side.
Gender’s alternative values are: F and M.
City dweller’s alternative values are: Y and N
Age group’s alternative values are: A, B, and C
2. Compute max. number of rules.
Determine the product of number of alternative values for each condition.
2 x 2 x 3 = 12.
Fill table on upper right side with one column for each unique combination of these
alternative values. Label each column using increasing numbers 1-12 corresponding to
the 12 rules. For example, the first column (rule 1) corresponds to F, Y, and A. Rule 2
corresponds to M, Y, and A. Rule 3 corresponds to F, N, and A. Rule 4 corresponds to M,
N, and A. Rule 5 corresponds to F, Y, and B. Rule 6 corresponds to M, Y, and B and so on.
3. Identify possible actions
Market product W, X, Y, or Z. Put these into table as 4 rows in lower left side.
4. Define each of the actions to take given each rule.
For example, for rule 1 where it is F, Y, and A; we see from the above example scenario
that products W, X, and Z will appeal. Therefore, we put an ‘X’ into the table’s
intersection of column 1 and the rows that correspond to the actions: market product W,
market product X, and market product Z.
1 2 3 4 5 6 7 8 9 10 11 12
Gender F M F M F M F M F M F M
City Y Y N N Y Y N N Y Y N N
Age A A A A B B B B C C C C
Market
W
X X X
MarketX X X
MarketY X
MarketZ X X X X X X X X X X
5. Verify that the actions given to each rule are correct.
6. Simplify the table.
Determine if there are rules (columns) that represent impossible situations.
If so, remove those columns. There are no impossible situations in this
example.
Determine if there are rules (columns) that have the same actions. If so,
determine if these are rules that are identical except for one condition and
for that one condition, all possible values of this condition are present in the
rules in these columns. In the example scenario, columns 2, 4, 6, 7, 10, and
12 have the same action. Of these columns: 2, 6, and 10 are identical except
for one condition: age group. The gender is M and they are city dwellers. The
age group is A for rule 2, B for rule 6, and C for rule 10. Therefore, all possible
values of condition ‘age group’ are present. For rules 2, 6, and 10; the age
group is a “don’t care”. These 3 columns can be collapsed into one column
and a hyphen is put into the age group location to signify that we don’t care
what the value of the age group is, we will treat all male city dwellers the
same: market product Z.
Final Decision Table
1 2 3 4 5 6 7 8 9 10
Gender F M F M F M F M F M
City Y Y N N Y N N Y N N
Age A A A B B B C C C
MarketW X X X
MarketX X X
MarketY X
MarketZ X X X X X X X X

Decision analysis

  • 1.
  • 2.
    2 Decision Analysis • Effectivedecision-making requires that we understand: – The nature of the decision that must be made – The values, goals, and objectives that are relevant to the decision problem – The areas of uncertainty that affect the decision – The consequences of each possible decision
  • 3.
    3 A Decision-Making Model Considerthe following five-part decision-making model: Adapted from Winning Decisions, by Russo and Shoemaker Identify Problem Formulate and Implement Model Analyze Model Test Results Implement Solution Unsatisfactory Results Most important
  • 4.
    Anchoring and Framing •Errors in judgment arise due to what psychologists term anchoring and framing
  • 5.
    Anchoring • A seemingtrivial factor serves as a starting point (anchor) for estimations • Decision makers adjust their estimates but remain too close to the anchor. • 2 groups are asked to estimate the value of:  1 X 2 X 3 X 4 X 5 X 6 X 7 X 8 or  8 X 7 X 6 X 5 X 4 X 3 X 2 X 1 • Median estimate of first series was 512 • Median estimate of 2nd series was 2,250 • The order, of course, is meaningless and the answer is 40,320
  • 6.
    Framing • Affects howa decision maker perceives the alternatives in a decision – often involves a win/loss perspective • The way the problem is framed influences the choices
  • 7.
    Framing Example • Youhave been given $1,000 but must choose between the following alternatives: a) Receive an additional $500 with certainty or b) Flip a coin and receive an additional $1,000 if heads or $0 if tails • a) is a sure win and the choice most people prefer • Now suppose you are given $2,000 and must choose between a) Give back $500 immediately or b) Flip a coin and give back $0 if heads or $1,000 if tails • When framed this way, alternative a) is a “sure loss” and many people who previously preferred alternative a) now opt for alternative b) (because it holds a chance of avoiding a loss) • However it is clear that that in both cases the a) alternative guarantees a total payoff of $1,500, whereas b) offers a 50% chance of a $2,000 total payoff and a 50% chance of $1,000 total payoff. • A rational decision maker should focus on the consequences of his/her choices and consistently select the same alternative, regardless of how the problem is framed
  • 8.
    8 A Framing Example “Carefulanalysis at a major U.S. steel company showed it could save hundreds of thousands of dollars per year by replacing its hot-metal mixing technology, which required that metal be heated twice, with direct-pouring technology, in which the metal was only heated once. But the move was approved only after considerable delay because senior engineers complained that the analysis did not include the cost of the hot metal mixers that had been purchased for $3 million just a few years previously.” How would you critique this decision? Adapted from Winning Decisions, by Russo and Shoemaker
  • 9.
    9 Decision Trees andDecision Tables • Often our problem solutions require decisions to be made according to two or more conditions or combinations of conditions • Decision trees represent such decision as a sequence of steps • Decision tables describe all possible combinations of conditions and the decision appropriate to each combination • Levels of uncertainty can also be built into decision trees to account for the relative probabilities of the various outcomes
  • 10.
    10 Decision Tree ShowingPossible Outcomes Outcome A Outcome B Sales Up 10% Sales Up 15% Sales Up 5% Sales Even A.1 A.2 B.1 B.2 Decision Made Outcomes Projected Sales Results
  • 11.
    11 Decision Tree ofOutcomes -- Quantifying Uncertainties Outcome A Outcome B Sales Up 10% Sales Up 15% Sales Up 5% Sales Even A.1 A.2 B.1 B.2 40% 60% 80% 20% 32% 8% 70% 30% 42% 18% Decision Made Projected Sales Results
  • 12.
  • 13.
    Evaluating Your Decision Tree Startby assigning a cash value or score to each possible outcome. Estimate how much you think it would be worth to you if that outcome came about. Next look at each circle (representing an uncertainty point) and estimate the probability of each outcome. If you use percentages, the total must come to 100% at each circle. If you use fractions, these must add up to 1. If you have data on past events you may be able to make rigorous estimates of the probabilities. Otherwise write down your best guess. -
  • 14.
    Calculating Tree Values •Once you have worked out the value of the outcomes, and have assessed the probability of the outcomes of uncertainty, it is time to start calculating the values that will help you make your decision. • Start on the right hand side of the decision tree, and work back towards the left. As you complete a set of calculations on a node (decision square or uncertainty circle), all you need to do is to record the result. You can ignore all the calculations that lead to that result from then on. –
  • 15.
    Calculating The Valueof Uncertain Outcome Nodes Calculating the value of uncertain outcomes (circles on the diagram): Multiply the value of the outcomes by their probability. The total for that node of the tree is the total of these values. In the example in Figure 2, the value for 'new product, thorough development' is: 0.4 (probability good outcome) x $1,000,000 (value) = $400,000 0.4 (probability moderate outcome) x $50,000 (value) = $20,000 0.2 (probability poor outcome) x $2,000 (value) = $400 + $420,400 -
  • 16.
    Calculating the Value ofDecision Nodes When evaluating a decision node, write down the cost of each option along each decision line. Then subtract the cost from the outcome value that you have already calculated. This will give you a value that represents the benefit of that decision. Note that amounts already spent do not count for this analysis – these are 'sunk costs' and (despite emotional counter-arguments) should not be factored into the decision. When you have calculated these decision benefits, choose the option that has the largest benefit, and take that as the decision made. This is the value of that decision node. Figure 4 shows this calculation of decision nodes in our example: In this example, the benefit we previously calculated for 'new product, thorough development' was $420,400. We estimate the future cost of this approach as $150,000. This gives a net benefit of $270,400. The net benefit of 'new product, rapid development' was $31,400. On this branch we therefore choose the most valuable option, 'new product, thorough development', and allocate this value to the decision node.
  • 17.
    Result By applying thistechnique we can see that the best option is to develop a new product. It is worth much more to us to take our time and get the product right, than to rush the product to market. However, if we decide to consolidate, It is better just to improve our existing products than to botch a new product
  • 18.
    18 Example of Usinga Decision Tree or Table to Capture Complex Business Logic Consider the following excerpt from an actual business document: If the customer account is billed using a fixed rate method, a minimum monthly charge is assessed for consumption of less than 100 kwh. Otherwise, apply a schedule A rate structure. However, if the account is billed using a variable rate method, a schedule A rate structure will apply to consumption below 100 kwh, with additional consumption billed according to schedule B.
  • 19.
    Articulating Complex BusinessRules  Complex business rules, such as our example, can become rather confusing  Capturing such rules in text form alone can lead to ambiguity and misinterpretation  As an alternative, it is often wise to capture such rules in decision tress or decision tables  The examples on the following slides will illustrate this technique
  • 20.
    20 Decision Tree forthis Example fixed rate billing variable rate billing < 100 kwh >= 100 kwh < 100 kwh >= 100 kwh minimum charge schedule A schedule A ?
  • 21.
    21 Decision Tree forthis Example < 100 kwh >= 100 kwh < 100 kwh >= 100 kwh minimum charge schedule A schedule A schedule A on first 99 kwh schedule B on kwh 100 and above fixed rate billing variable rate billing
  • 22.
    22 Decision Table forExample – Version 1 Conditions 1 2 3 4 5 Rules Fixed rate acct T T F F F Variable rate acct F F T T F Consumption < 100 kwh T F T F Consumption >= 100 kwh F T F T Minimum charge X Schedule A X X Schedule A on first 99 kwh, X Schedule B on kwh 100 + Actions Is this a valid business case? Did we miss something?
  • 23.
    23 Decision Table forExample – Version 2 Conditions 1 2 3 4 Rules Account type fixed fixed variable variable Consumption < 100 >=100 <100 >= 100 Minimum charge X Schedule A X X Schedule A on first 99 kwh, X Schedule B on kwh 100 + Actions
  • 24.
    24 Activity Consider the followingdescription of a company’s matching retirement contribution plan: Acme Widgets wants to encourage its employees to save for retirement. To promote this goal, Acme will match an employee’s contribution to the approved retirement plan by 50% provided the employee keeps the money in the retirement plan at least two years. However, the company limits its matching contributions depending on the employee’s salary and time of service as follows. Acme will match five, six, or seven percent of the first $30,000 of an employee's salary if he or she has been with the company for at least two, five, or ten years respectively. If the employee has been with the company for at least five years, the company will match up to four percent of the next $25,000 in salary and three percent of any excess. Ten-year plus workers get a five percent match from $30,000 to $55,000. Long-term service employees (fifteen years or more) get seven percent on the first $30,000 and five percent after that.
  • 25.
    25 Team Activity (cont’d) 1)Do one of the following tasks according to your instructor’s directions: a) Create a decision tree that captures the business rules in this policy. b) Create a decision table that captures the business rules in this policy. 2) Did your analysis uncover any questions, ambiguities, or missing rules? 3) If so, do you think these would be as easy to spot and to analyze using only the narrative description of this policy?
  • 26.
    Developing a MoreComplex Decision Table 26
  • 27.
    Developing More ComplexDecision Tables In the 1950's General Electric, the Sutherland Corporation, and the United States Air Force worked on a complex file maintenance project, using flowcharts and traditional narratives, they spent six labor-years of effort but failed to define the problem. It was not until 1958, when four analysts using decision tables, successfully defined the problem in less than four weeks1. _____________________________________ 1Taken from “A History of Decision Tables” located at http://www.catalyst.com/products/logicgem/overview.html
  • 28.
    Steps to createa decision table 1. List all the conditions which determine which action to take. 2. Calculate the number of rules required. – Multiple the number of values for each condition by each other. • Example: Condition 1 has 2 values, Condition 2 has 2 values, Condition 3 has 2 values. Thus 2 X 2 X 2 = 8 rules 3. Fill all combinations in the table. 4. Define the action for each rule 5. Analyze column by column to determine which actions are appropriate for each rule. 6. Reduce the table by eliminating redundant columns.
  • 29.
    <cond-1> F TF T F T F T … T <cond-2> F F T T F F T T … T <cond-3> F F F F T T T T … T … … <cond-n> F F F F F F F F … T <action-1> X X X X <action-2> X X X X <action-3> X X X X … … <action-m> X X X Actions Conditions All possible combinations Actions per combination (each column represents a different state of affairs)
  • 30.
    Example • Policy forcharging charter flight costumers for certain in-flight services:2 If the flight is more than half-full and costs more than $350 per seat, we serve free cocktails unless it is a domestic flight. We charge for cocktails on all domestic flights; that is, for all the ones where we serve cocktails. (Cocktails are only served on flights that are more than half-full.) _____________________________________ 2 Example taken form: Structured Analysis and System Specification, Tom de Marco, Yourdon inc., New York,
  • 31.
    List all theconditions that determine which action to take. Conditions Values The flight more than half-full? Yes (Y), No (N) Cost is more than $350? Y, N Is it a domestic flight? Y, N
  • 32.
    Calculate the spaceof combinations Conditions Number of Combinations Possible Combinations/ Rules 1 2 Y N 2 4 Y Y N Y Y N N N 3 8 Y Y Y N Y Y Y N Y N N Y Y Y N N Y N Y N N N N N … … n 2n
  • 33.
    Calculate the Numberof Rules in Table • Conditions in the example are 3 and all are two-valued ones, hence we have: All combinations are 23 = 8 rules OR 2 X 2 X 2 = 8 rules
  • 34.
    Fill all rulesin the table. POSSIBLE RULESCONDITONS more than half-full N N N N Y Y Y Y more than $350 per seat N N Y Y N N Y Y domestic flight N Y N Y N Y N Y ACTIONS
  • 35.
    Analyze column bycolumn to determine which actions are appropriate for each combination POSSIBLE RULES CONDITONS more than half-full N N N N Y Y Y Y more than $350 per seat N N Y Y N N Y Y domestic flight N Y N Y N Y N Y ACTIONS serve cocktails X X X X free X
  • 36.
    Reduce the tableby eliminating redundant columns. POSSIBLE COMBINATIONS CONDITONS more than half- full N N N N Y Y Y Y more than $350 per seat N N Y Y N N Y Y domestic flight N Y N Y N Y N Y ACTIONS serve cocktails X X X X free X Note that some columns are identical except for one condition.
  • 37.
    Reduce the tableby eliminating redundant columns. POSSIBLE RULES CONDITONS more than half- full N N N N Y Y Y Y more than $350 per seat N N Y Y N N Y Y domestic flight N Y N Y N Y N Y ACTIONS serve cocktails X X X X free X Note that some columns are identical except for one condition. Which means that actions are independent from the value of that particular condition.
  • 38.
    Reduce the tableby eliminating redundant columns. POSSIBLE RULES CONDITONS more than half- full N N N N Y Y Y Y more than $350 per seat N N Y Y N N Y Y domestic flight N Y N Y N Y N Y ACTIONS serve cocktails X X X X free X Note that some columns are identical except for one condition. Which means that actions are independent from the value of that particular condition. Hence, the table can be simplified.
  • 39.
    Reduce the tableby eliminating redundant columns. POSSIBLE RULES CONDITONS more than half- full N N N Y Y Y Y more than $350 per seat N Y Y N N Y Y domestic flight - N Y N Y N Y ACTIONS serve cocktails X X X X free X First we combine the yellow ones nullifying the condition.
  • 40.
    Reduce the tableby eliminating redundant columns. POSSIBLE RULES CONDITONS more than half- full N N Y Y Y Y more than $350 per seat N Y N N Y Y domestic flight - - N Y N Y ACTIONS serve cocktails X X X X free X First we combine the yellow ones nullifying the condition. Then the red ones.
  • 41.
    Reduce the tableby eliminating redundant columns. POSSIBLE RULES CONDITONS more than half- full N N Y Y Y Y more than $350 per seat N Y N N Y Y domestic flight - - N Y N Y ACTIONS serve cocktails X X X X free X First we combine the yellow ones nullifying the condition. Then the red ones. Notice that yellow and red columns are identical but by one condition.
  • 42.
    Reduce the tableby eliminating redundant columns. POSSIBLE RULES CONDITONS more than half- full N Y Y Y Y more than $350 per seat - N N Y Y domestic flight - N Y N Y ACTIONS serve cocktails X X X X free X First we combine the yellow ones nullifying the condition. Then the red ones. Notice that yellow and red columns are identical but by one condition. So, we combine them.
  • 43.
    Reduce the tableby eliminating redundant columns. POSSIBLE RULES CONDITONS more than half- full N Y Y Y more than $350 per seat - N Y Y domestic flight - - N Y ACTIONS serve cocktails X X X free X First we combine the yellow ones nullifying the condition. Then the red ones. Notice that yellow and red columns are identical but by one condition. So, we combine them. Then we combine the violet colored ones.
  • 44.
    Reduce the tableby eliminating redundant columns. POSSIBLE RULES CONDITONS more than half- full N Y Y Y more than $350 per seat - N Y Y domestic flight - - N Y ACTIONS serve cocktails X X X free X Notice that even when we observe that the green columns are identical except for one condition we do not combine them: A “NULLIFIED” condition is not the same as a valued one. What about this rule? Have we over looked something?
  • 45.
    Final Solution Rules CONDITONS more thanhalf-full N Y Y Y more than $350 per seat - N Y Y domestic flight - - N Y ACTIONS serve cocktails X X X free X
  • 46.
    Complex Decision TableExercise A company is trying to maintain a meaningful list of customers. The objective is to send out only the catalogs from which customers will buy merchandise. The company realizes that certain loyal customers order from every catalog and some people on the mailing list never order. These customers are easy to identify. Deciding which catalogs to send to customers who order from only selected catalogs is a more difficult decision. Once these decisions have been made by the marketing department, you as the analyst have been asked to develop a decision table for the three conditions described below. Each condition has two alternatives (Y or N): 1. Customer ordered from Fall catalog 2. Customer ordered from Christmas catalog 3. Customer ordered from Specialty catalog The actions for these conditions, as determined by marketing, are described on the next slide. 46
  • 47.
    Complex Decision TableExercise Customers who ordered from all three catalogs will get the Christmas and Special catalogs. Customers who ordered from the Fall and Christmas catalogs but not the Special catalog will get the Christmas catalog. Customers who ordered from the Fall catalog and the Special catalog but not the Christmas catalog will get the Special catalog. Customers who ordered only from the Fall catalog but no other catalog will get the Christmas catalog. Customers who ordered from the Christmas and Special catalogs but not the Fall catalog will get both catalogs. Customers who ordered only from the Christmas catalog or only from the Special catalog will get only the Christmas or Special catalogs respectively. Customers who ordered from no catalog will get the Christmas catalog. 1. Create a simplified decision table (or tree) based on the above decision logic. 47
  • 48.
    Solution to DecisionTable Exercise Conditions and Actions 1 2 3 4 5 6 7 8 Order from Fall Catalog Y Y Y Y N N N N Order from Christmas Catalog Y Y N N Y Y N N Order from Special Catalog Y N Y N Y N Y N Mail Christmas Catalog X X X X Mail Special Catalog X X Mail Both Catalogs X X The four gray columns can be combined into a single rule. Note that for each, there was NO order placed from the Special Catalog. In addition, Rules 1 & 5 and Rules 3 & 7 can be combined. Each pair produces the same action and each pair shares two common conditions.
  • 49.
    Solution to DecisionTable Exercise~ Final Version Conditions and Actions 1 2 3 Order from Fall Catalog -- -- -- Order from Christmas Catalog Y -- N Order from Special Catalog Y N Y Mail Christmas Catalog X Mail Special Catalog X Mail Both Catalogs X
  • 50.
    “A marketing companywishes to construct a decision table to decide how to treat clients according to three characteristics: Gender, City Dweller, and age group: A (under 30), B (between 30 and 60), C (over 60). The company has four products (W, X, Y and Z) to test market. Product W will appeal to female city dwellers. Product X will appeal to young females. Product Y will appeal to Male middle aged shoppers who do not live in cities. Product Z will appeal to all but older females.” Another Example:
  • 51.
    The process usedto create this decision table is the following: 1. Identify conditions and their alternative values. There are 3 conditions: gender, city dweller, and age group. Put these into table as 3 rows in upper left side. Gender’s alternative values are: F and M. City dweller’s alternative values are: Y and N Age group’s alternative values are: A, B, and C 2. Compute max. number of rules. Determine the product of number of alternative values for each condition. 2 x 2 x 3 = 12. Fill table on upper right side with one column for each unique combination of these alternative values. Label each column using increasing numbers 1-12 corresponding to the 12 rules. For example, the first column (rule 1) corresponds to F, Y, and A. Rule 2 corresponds to M, Y, and A. Rule 3 corresponds to F, N, and A. Rule 4 corresponds to M, N, and A. Rule 5 corresponds to F, Y, and B. Rule 6 corresponds to M, Y, and B and so on. 3. Identify possible actions Market product W, X, Y, or Z. Put these into table as 4 rows in lower left side. 4. Define each of the actions to take given each rule. For example, for rule 1 where it is F, Y, and A; we see from the above example scenario that products W, X, and Z will appeal. Therefore, we put an ‘X’ into the table’s intersection of column 1 and the rows that correspond to the actions: market product W, market product X, and market product Z.
  • 52.
    1 2 34 5 6 7 8 9 10 11 12 Gender F M F M F M F M F M F M City Y Y N N Y Y N N Y Y N N Age A A A A B B B B C C C C Market W X X X MarketX X X MarketY X MarketZ X X X X X X X X X X
  • 53.
    5. Verify thatthe actions given to each rule are correct. 6. Simplify the table. Determine if there are rules (columns) that represent impossible situations. If so, remove those columns. There are no impossible situations in this example. Determine if there are rules (columns) that have the same actions. If so, determine if these are rules that are identical except for one condition and for that one condition, all possible values of this condition are present in the rules in these columns. In the example scenario, columns 2, 4, 6, 7, 10, and 12 have the same action. Of these columns: 2, 6, and 10 are identical except for one condition: age group. The gender is M and they are city dwellers. The age group is A for rule 2, B for rule 6, and C for rule 10. Therefore, all possible values of condition ‘age group’ are present. For rules 2, 6, and 10; the age group is a “don’t care”. These 3 columns can be collapsed into one column and a hyphen is put into the age group location to signify that we don’t care what the value of the age group is, we will treat all male city dwellers the same: market product Z.
  • 54.
    Final Decision Table 12 3 4 5 6 7 8 9 10 Gender F M F M F M F M F M City Y Y N N Y N N Y N N Age A A A B B B C C C MarketW X X X MarketX X X MarketY X MarketZ X X X X X X X X